| Param | Original file | Final file |
|---|---|---|
| Filename | modeM0/AS1A09_134T01_9000003896_26937cztM0_level2.evt | modeM0/AS1A09_134T01_9000003896_26937cztM0_level2_quad_clean.evt |
| Size (bytes) | 876,133,440 | 72,046,080 |
| Size | 835.5 MB | 68.7 MB |
| Events in quadrant A | 12,682,397 | 261,716 |
| Events in quadrant B | 5,030,867 | 504,039 |
| Events in quadrant C | 3,579,046 | 500,381 |
| Events in quadrant D | 4,803,515 | 461,765 |
| Mode M9 | |||
|---|---|---|---|
| Quadrant | BADHDUFLAG | Total packets | Discarded packets |
| A | 0 | 19 | 0 |
| B | 0 | 20 | 0 |
| C | 0 | 20 | 0 |
| D | 0 | 20 | 0 |
| Mode M0 | |||
|---|---|---|---|
| Quadrant | BADHDUFLAG | Total packets | Discarded packets |
| A | 0 | 42166 | 0 |
| B | 0 | 19124 | 0 |
| C | 0 | 14387 | 0 |
| D | 0 | 18463 | 0 |
| Quadrant | Total seconds | Saturated seconds | Saturation percentage |
|---|---|---|---|
| A | 6483 | 4866 | 75.057844% |
| B | 6483 | 444 | 6.848681% |
| C | 6483 | 79 | 1.218572% |
| D | 6482 | 286 | 4.412218% |
Noise dominated data is calculated using 1-second bins in cleaned event files. If a bin has >2000 counts, and if more than 50% of those come from <1% of pixels, then it is considered to be noise-dominated and hence unusable.
| Quadrant | # 1 sec bins | Bins with >0 counts | Bins with >2000 counts | High rate bins dominated by noise | Noise dominated (total time) | Noise dominated (detector-on time) | Marked lightcurve |
|---|---|---|---|---|---|---|---|
| A | 7853 | 6483 | 3951 | 3951 | 50.31% | 60.94% | 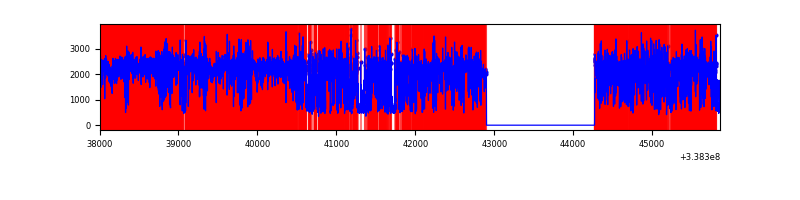 |
| B | 7853 | 6484 | 290 | 290 | 3.69% | 4.47% | 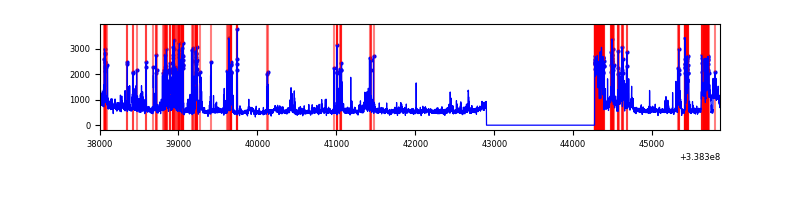 |
| C | 7853 | 6484 | 2 | 2 | 0.03% | 0.03% | 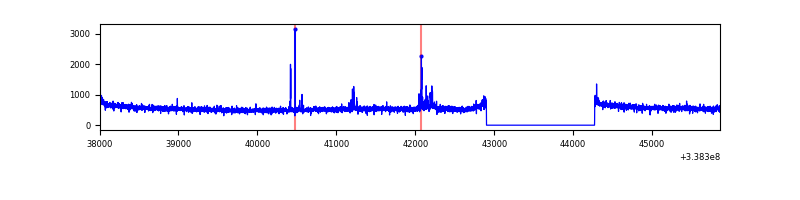 |
| D | 7852 | 6483 | 204 | 204 | 2.60% | 3.15% | 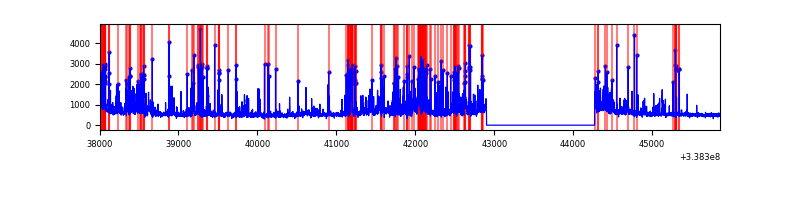 |
Top three noisy pixels from each quadrant. If the there are fewer than three noisy pixels in the level2.evt file, extra rows are filled as -1
| Pixel properties | Quadrant properties | ||||||
|---|---|---|---|---|---|---|---|
| Quadrant | DetID | PixID | Counts | Sigma | Mean | Median | Sigma |
| A | 14 | 235 | 10678674 | 109071.63 | 498 | 490 | 97.9 |
| A | 0 | 13 | 40117 | 404.76 | 498 | 490 | 97.9 |
| A | 8 | 192 | 33103 | 333.12 | 498 | 490 | 97.9 |
| B | 0 | 189 | 1010262 | 6201.06 | 878 | 861 | 162.8 |
| B | 10 | 245 | 396108 | 2428.12 | 878 | 861 | 162.8 |
| B | 10 | 246 | 125913 | 768.23 | 878 | 861 | 162.8 |
| C | 14 | 238 | 141756 | 710.35 | 865 | 875 | 198.3 |
| C | 0 | 207 | 43473 | 214.79 | 865 | 875 | 198.3 |
| C | 15 | 208 | 23324 | 113.19 | 865 | 875 | 198.3 |
| D | 1 | 52 | 782170 | 3929.4 | 846 | 826 | 198.8 |
| D | 7 | 80 | 332843 | 1669.72 | 846 | 826 | 198.8 |
| D | 2 | 250 | 274210 | 1374.85 | 846 | 826 | 198.8 |
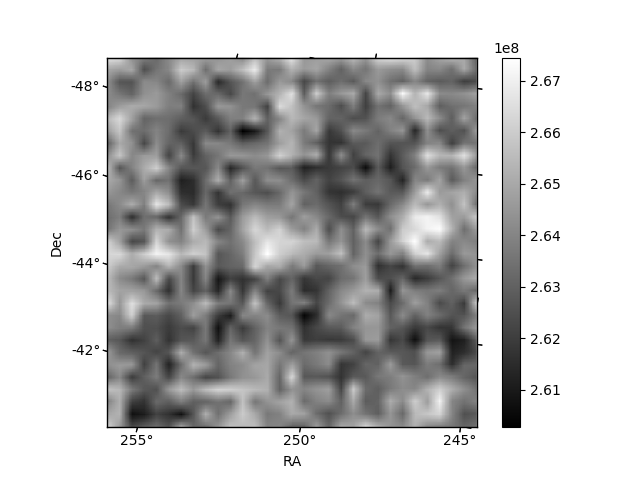
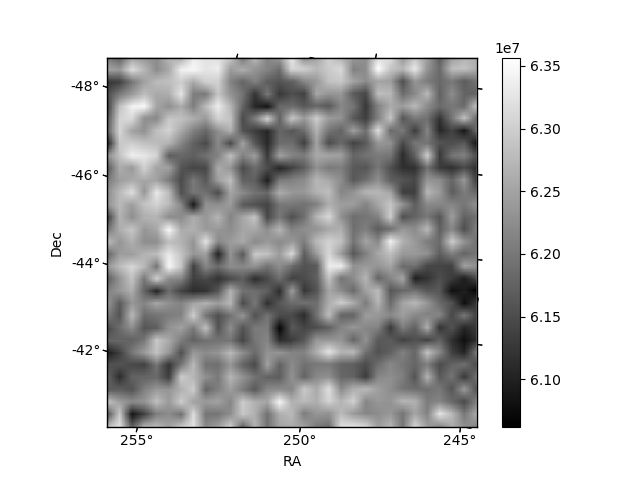
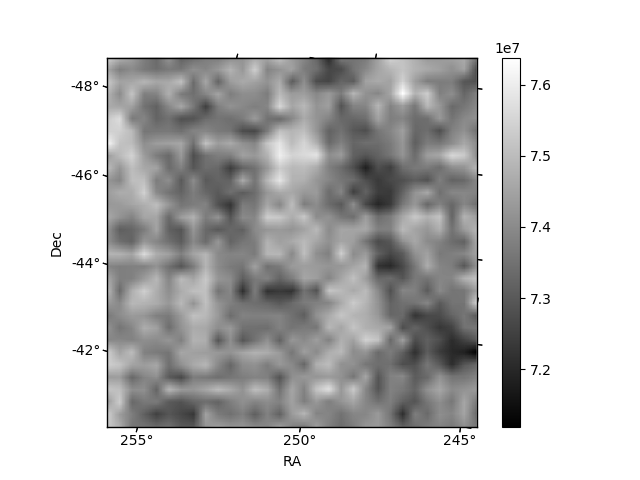
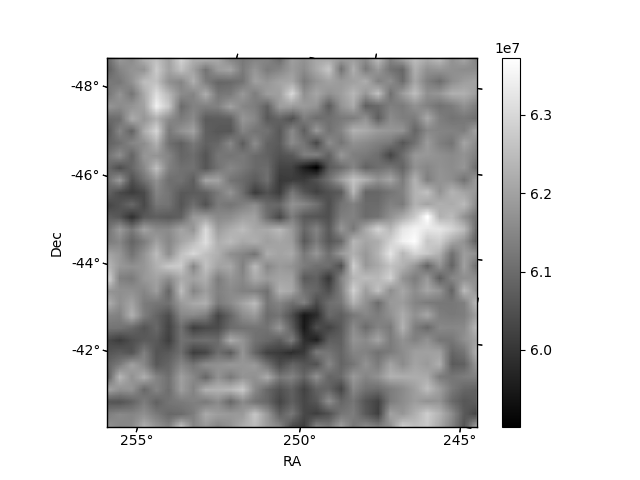
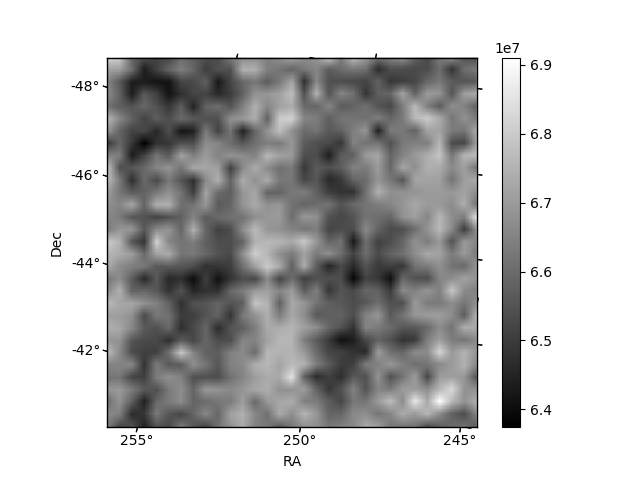
Histogram calculated using DETX and DETY for each event in the final _common_clean file
| Quadrant A | 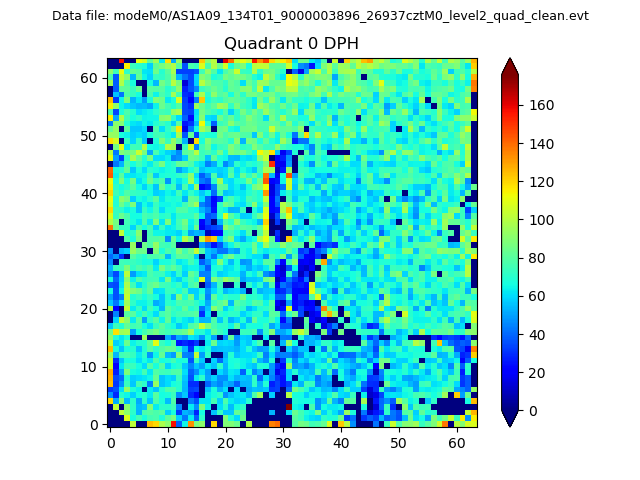 |
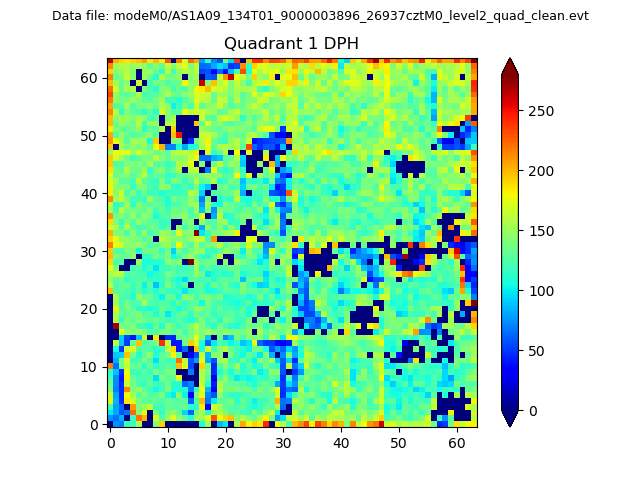 |
Quadrant B |
|---|---|---|---|
| Quadrant D | 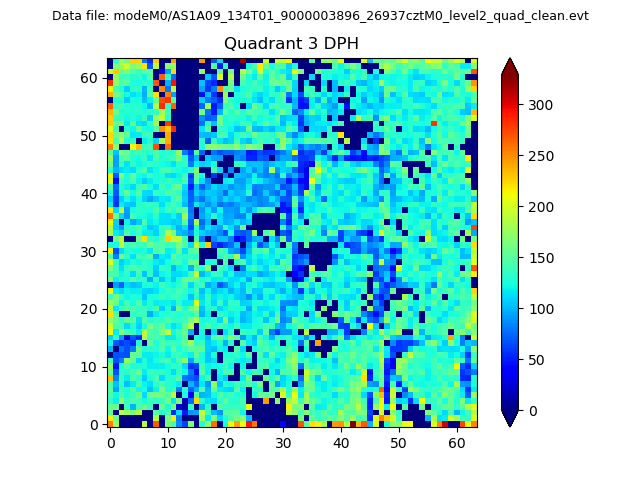 |
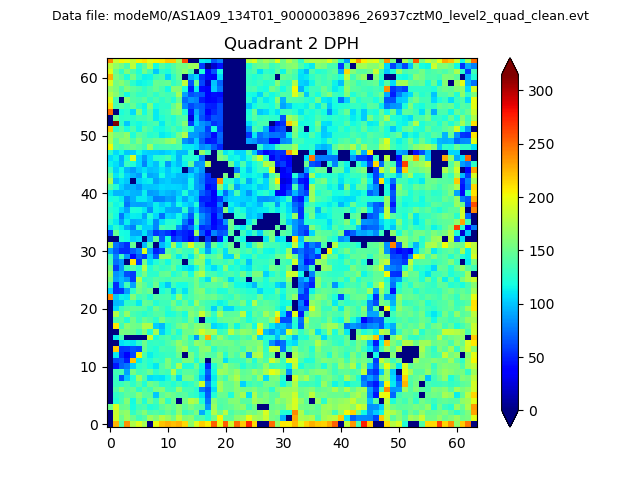 |
Quadrant C |
| Plot type | Count rate plots | Images |
|---|---|---|
| Comparison with Poisson distribution Blue bars denote a histogram of data divided into 1 sec bins. Red curve is a Poisson curve with rate = median count rate of data. |
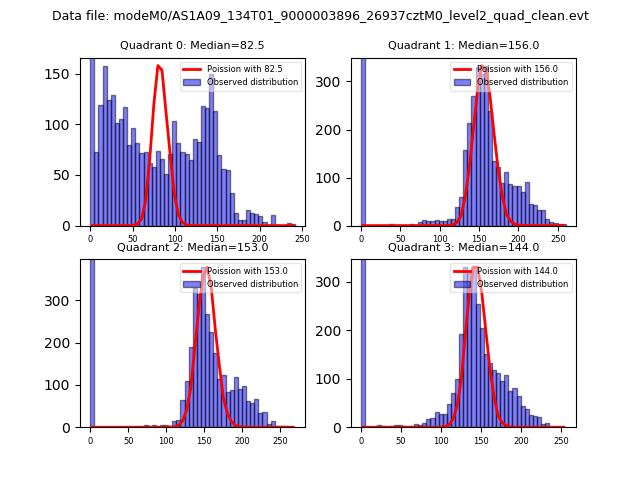 |
 |
| Quadrant-wise count rates Data is divided into 100 sec bins |
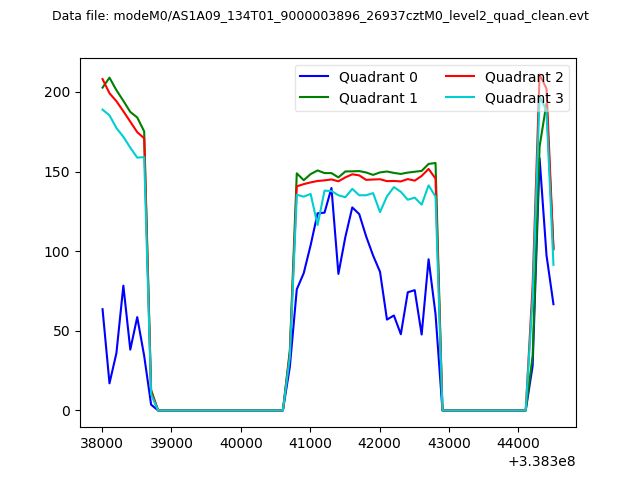 |
|
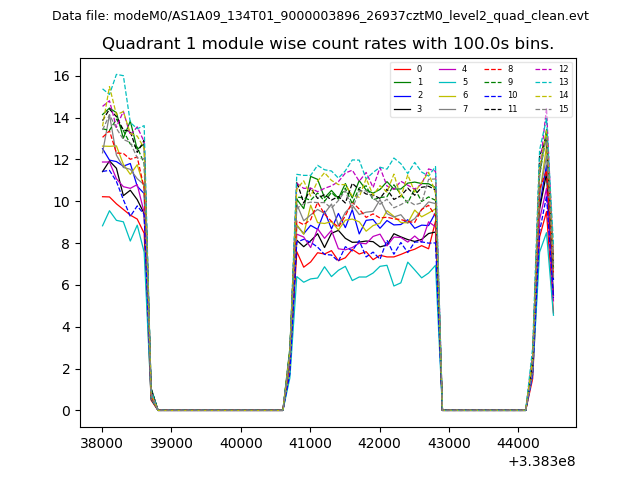
| Module-wise count rates for Quadrant A Data is divided into 100 sec bins |
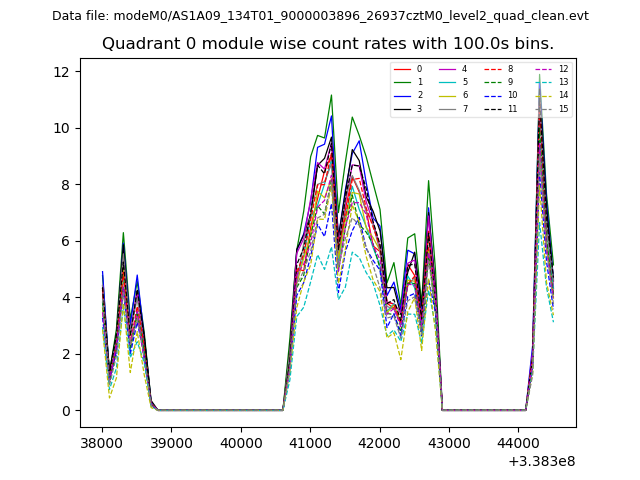 |
 |
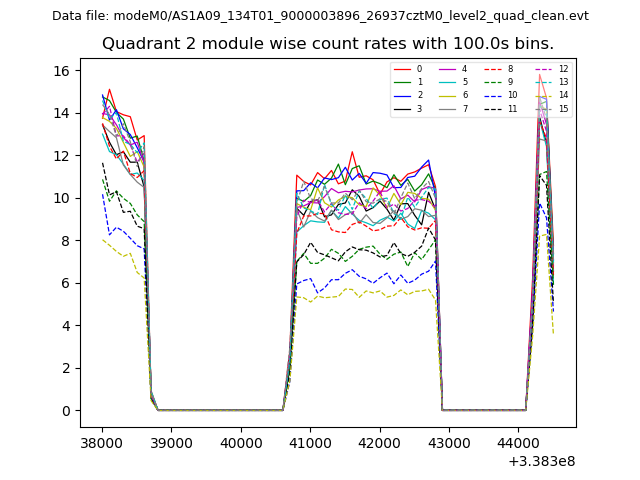
| Module-wise count rates for Quadrant B Data is divided into 100 sec bins |
 |
 |
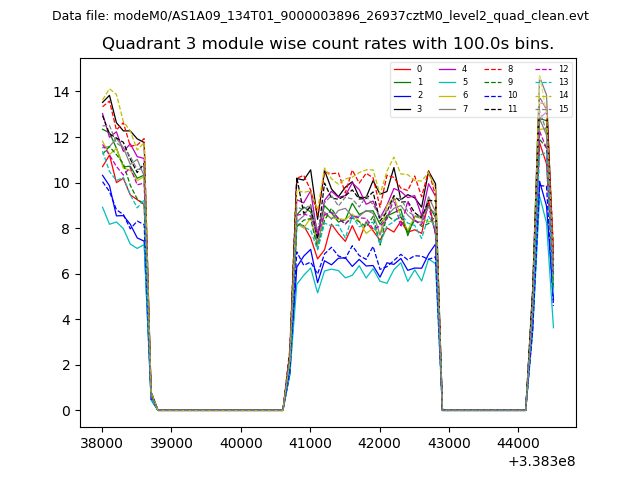
| Module-wise count rates for Quadrant C Data is divided into 100 sec bins |
 |
 |
| Module-wise count rates for Quadrant D Data is divided into 100 sec bins |
 |
 |
| Parameter | Plot |
|---|---|
| CZT HV Monitor | 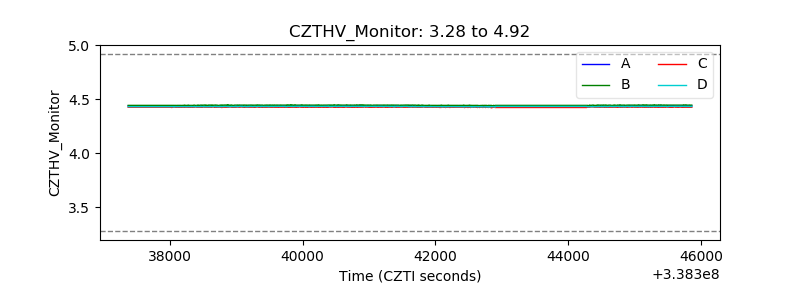 |
| D_VDD | 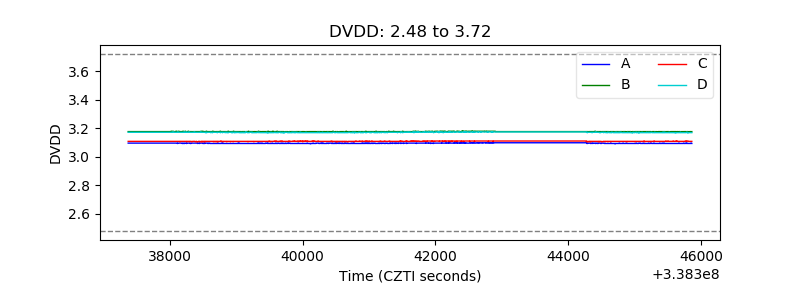 |
| Temperature 1 | 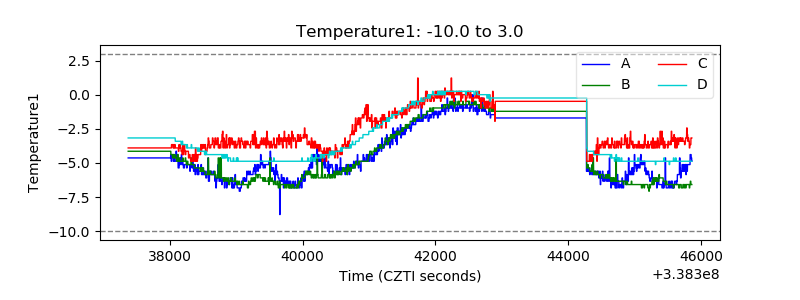 |
| Veto HV Monitor | 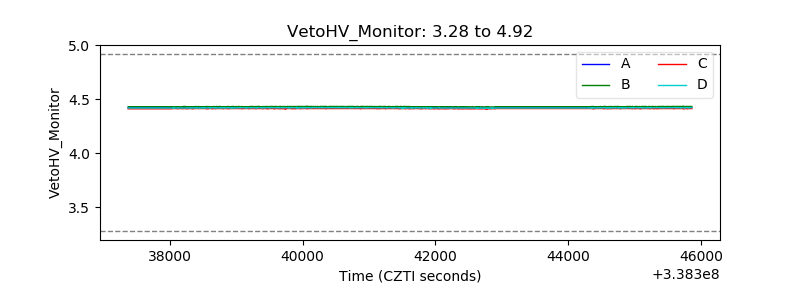 |
| Veto LLD | 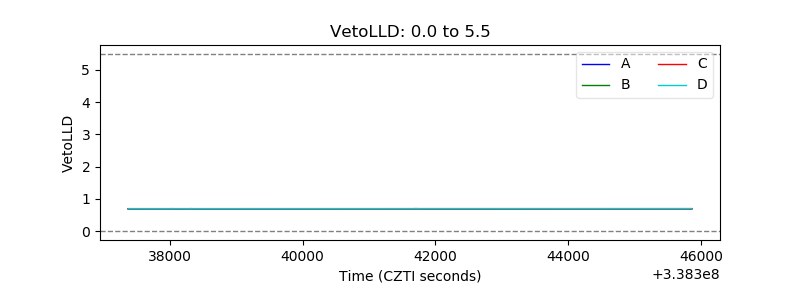 |
| Alpha Counter | 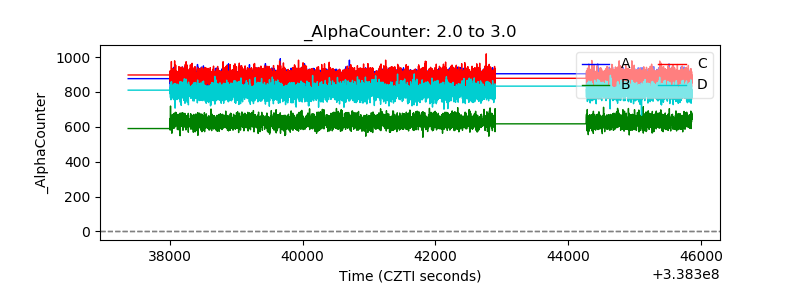 |
| _CPM_Rate | 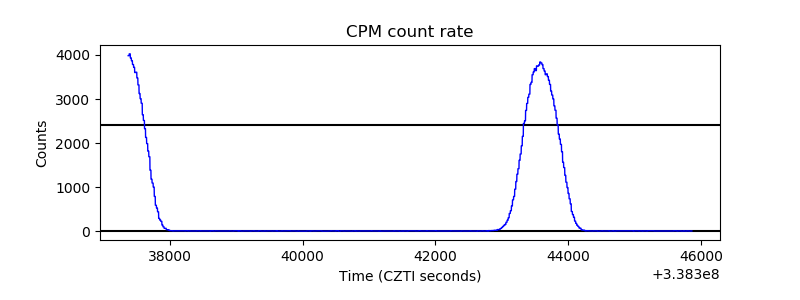 |
| CZT Counter | 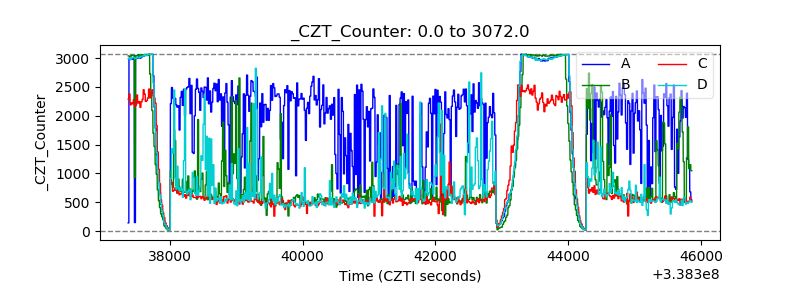 |
| +2.5 Volts monitor |  |
| +5 Volts monitor | 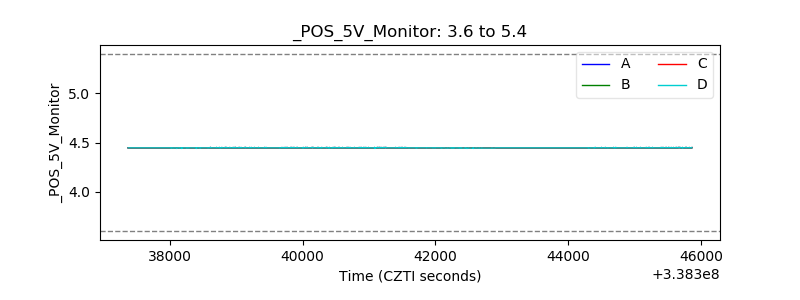 |
| _ROLL_ROT | 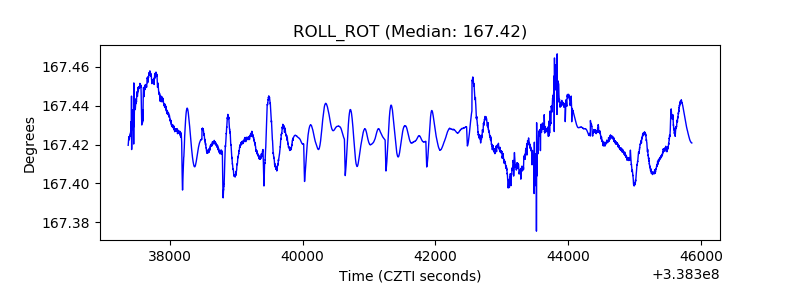 |
| _Roll_DEC | 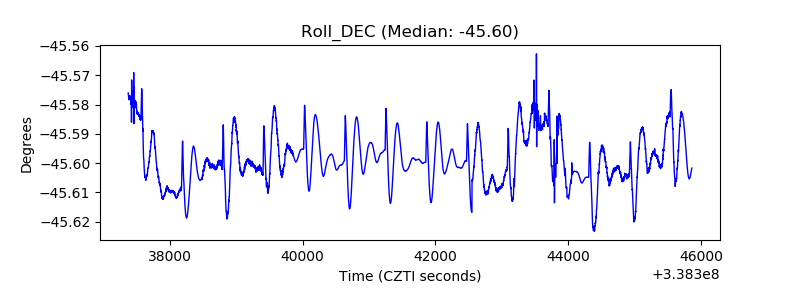 |
| _Roll_RA | 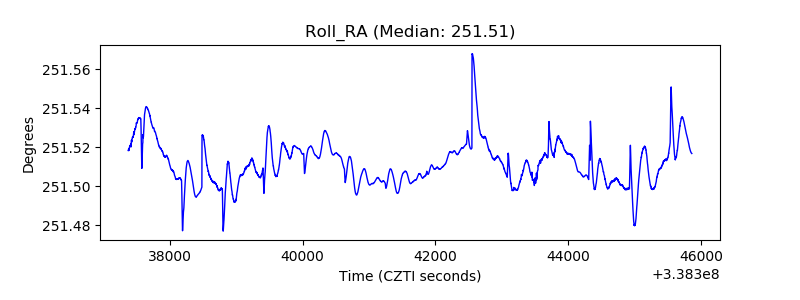 |
| Veto Counter | 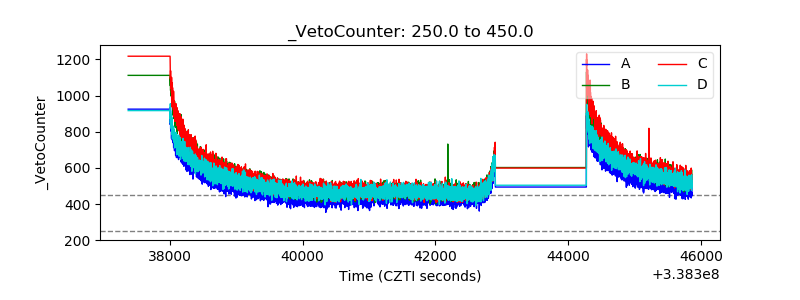 |