| Param | Original file | Final file |
|---|---|---|
| Filename | modeM0/AS1A09_134T01_9000003896_26938cztM0_level2.evt | modeM0/AS1A09_134T01_9000003896_26938cztM0_level2_quad_clean.evt |
| Size (bytes) | 725,736,960 | 66,942,720 |
| Size | 692.1 MB | 63.8 MB |
| Events in quadrant A | 8,245,305 | 335,849 |
| Events in quadrant B | 5,137,953 | 426,454 |
| Events in quadrant C | 3,612,568 | 427,343 |
| Events in quadrant D | 4,559,023 | 398,212 |
| Mode M9 | |||
|---|---|---|---|
| Quadrant | BADHDUFLAG | Total packets | Discarded packets |
| A | 0 | 14 | 0 |
| B | 0 | 14 | 0 |
| C | 0 | 14 | 0 |
| D | 0 | 14 | 0 |
| Mode M0 | |||
|---|---|---|---|
| Quadrant | BADHDUFLAG | Total packets | Discarded packets |
| A | 0 | 28714 | 0 |
| B | 0 | 19401 | 0 |
| C | 0 | 14420 | 0 |
| D | 0 | 17409 | 0 |
| Quadrant | Total seconds | Saturated seconds | Saturation percentage |
|---|---|---|---|
| A | 6286 | 2214 | 35.221126% |
| B | 6286 | 433 | 6.888323% |
| C | 6286 | 106 | 1.686287% |
| D | 6286 | 270 | 4.295259% |
Noise dominated data is calculated using 1-second bins in cleaned event files. If a bin has >2000 counts, and if more than 50% of those come from <1% of pixels, then it is considered to be noise-dominated and hence unusable.
| Quadrant | # 1 sec bins | Bins with >0 counts | Bins with >2000 counts | High rate bins dominated by noise | Noise dominated (total time) | Noise dominated (detector-on time) | Marked lightcurve |
|---|---|---|---|---|---|---|---|
| A | 7671 | 6286 | 1646 | 1646 | 21.46% | 26.19% | 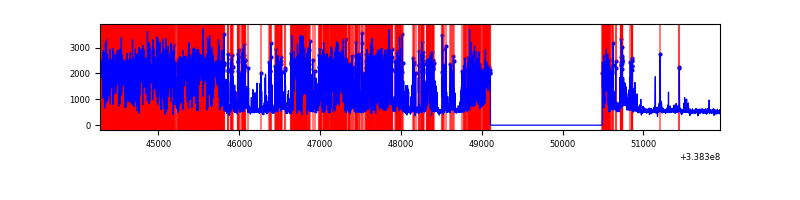 |
| B | 7671 | 6286 | 266 | 266 | 3.47% | 4.23% | 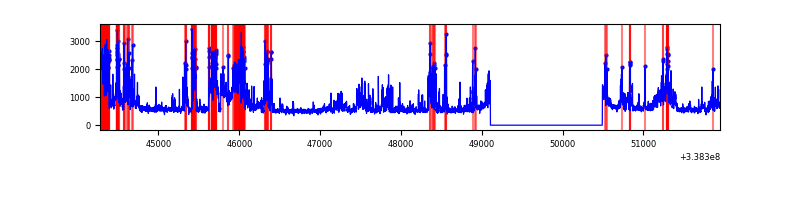 |
| C | 7671 | 6287 | 4 | 4 | 0.05% | 0.06% | 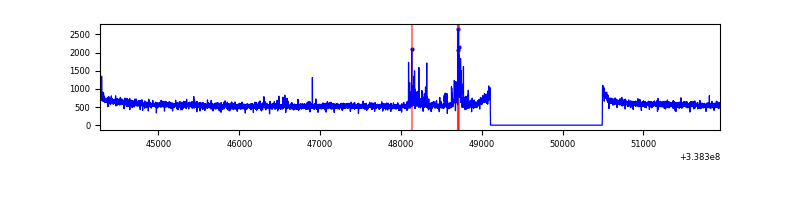 |
| D | 7671 | 6287 | 196 | 196 | 2.56% | 3.12% | 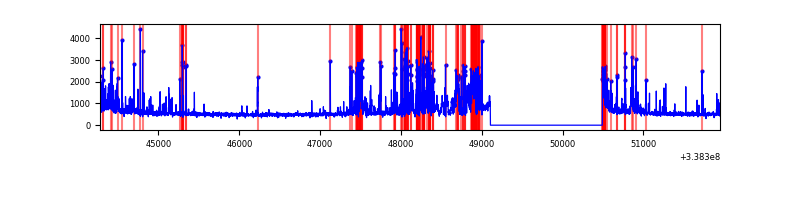 |
Top three noisy pixels from each quadrant. If the there are fewer than three noisy pixels in the level2.evt file, extra rows are filled as -1
| Pixel properties | Quadrant properties | ||||||
|---|---|---|---|---|---|---|---|
| Quadrant | DetID | PixID | Counts | Sigma | Mean | Median | Sigma |
| A | 14 | 235 | 5316624 | 37107.5 | 725 | 715 | 143.3 |
| A | 0 | 13 | 79027 | 546.65 | 725 | 715 | 143.3 |
| A | 8 | 192 | 31272 | 213.3 | 725 | 715 | 143.3 |
| B | 0 | 189 | 1699779 | 10734.91 | 861 | 842 | 158.3 |
| B | 0 | 219 | 34399 | 212.03 | 861 | 842 | 158.3 |
| B | 10 | 246 | 28185 | 172.77 | 861 | 842 | 158.3 |
| C | 14 | 238 | 140815 | 717.01 | 856 | 865 | 195.2 |
| C | 0 | 207 | 123348 | 627.52 | 856 | 865 | 195.2 |
| C | 15 | 208 | 15189 | 73.39 | 856 | 865 | 195.2 |
| D | 1 | 52 | 932555 | 4796.81 | 839 | 821 | 194.2 |
| D | 2 | 250 | 296255 | 1520.97 | 839 | 821 | 194.2 |
| D | 7 | 80 | 56821 | 288.3 | 839 | 821 | 194.2 |
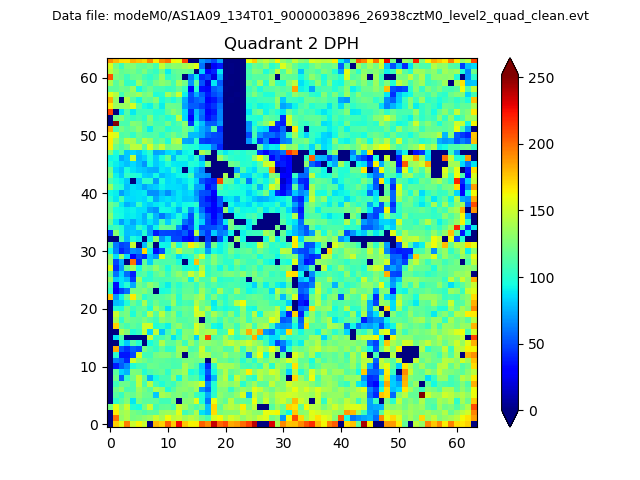
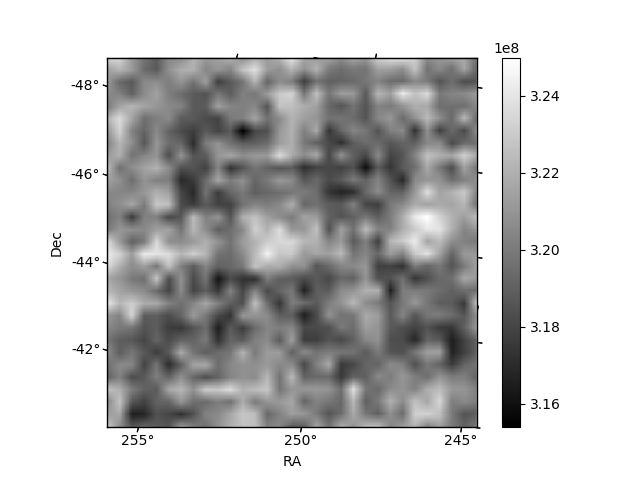
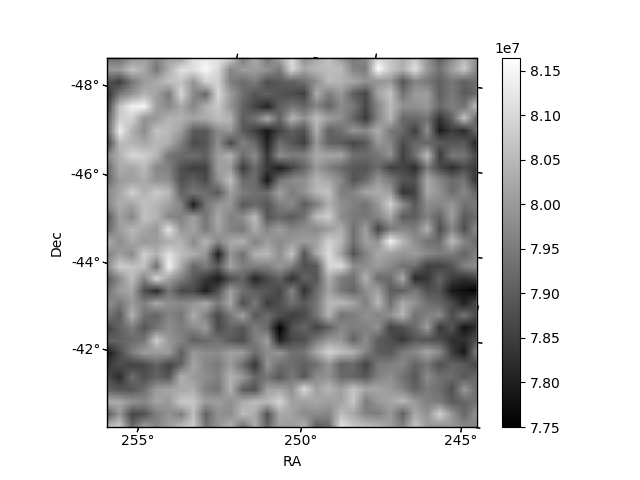
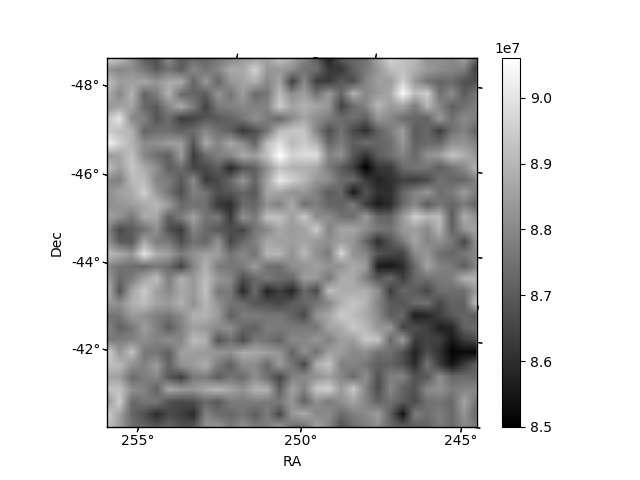
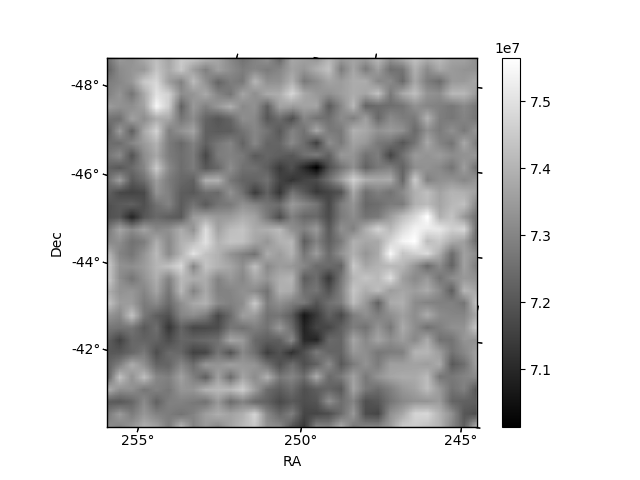
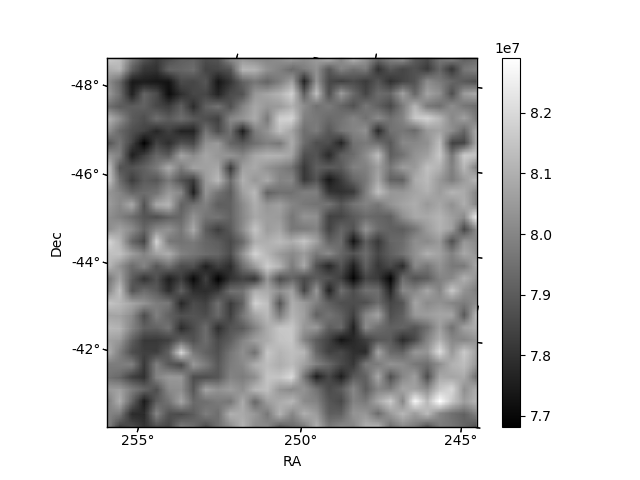
Histogram calculated using DETX and DETY for each event in the final _common_clean file
| Quadrant A | 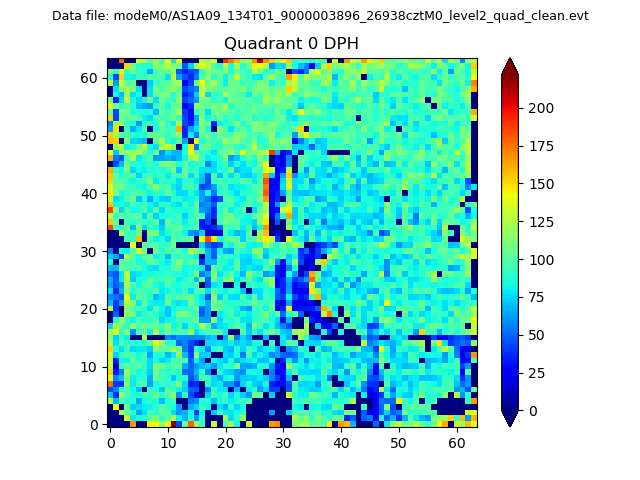 |
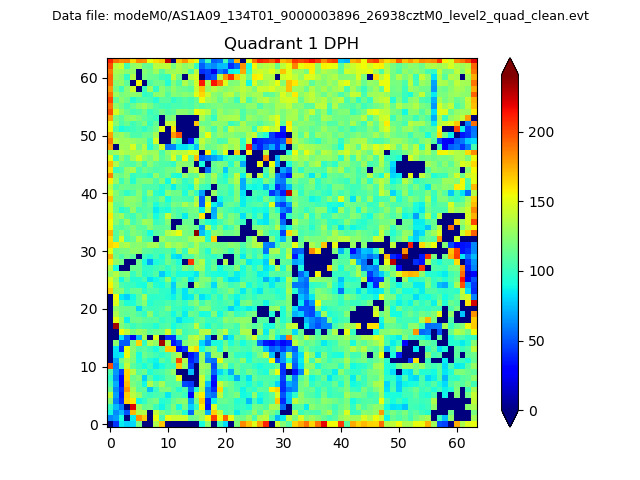 |
Quadrant B |
|---|---|---|---|
| Quadrant D | 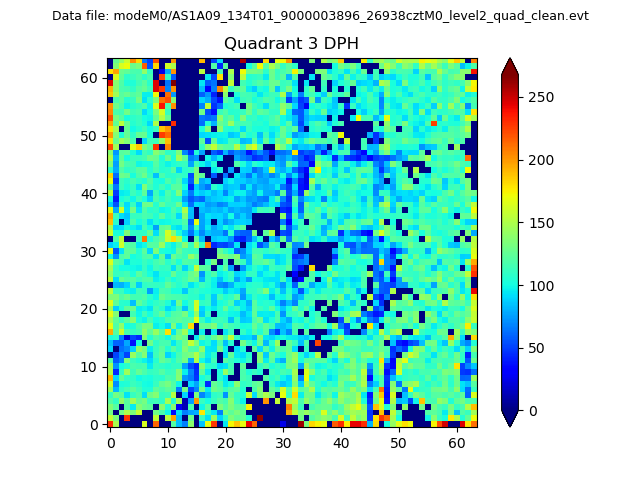 |
 |
Quadrant C |
| Plot type | Count rate plots | Images |
|---|---|---|
| Comparison with Poisson distribution Blue bars denote a histogram of data divided into 1 sec bins. Red curve is a Poisson curve with rate = median count rate of data. |
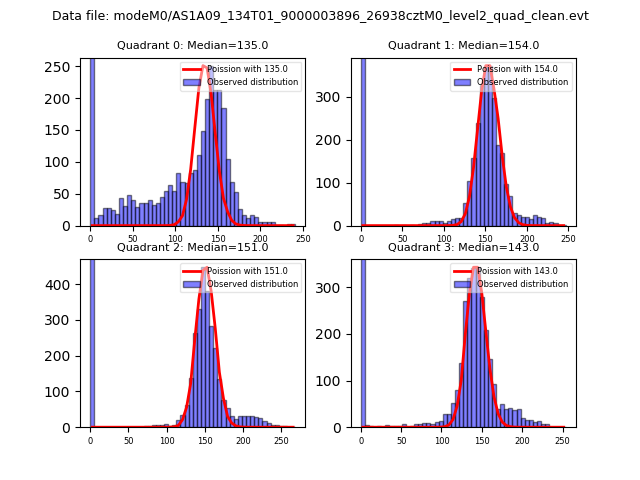 |
 |
| Quadrant-wise count rates Data is divided into 100 sec bins |
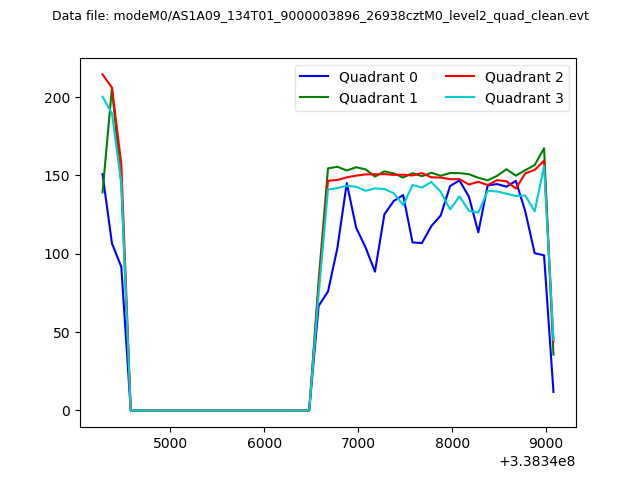 |
|
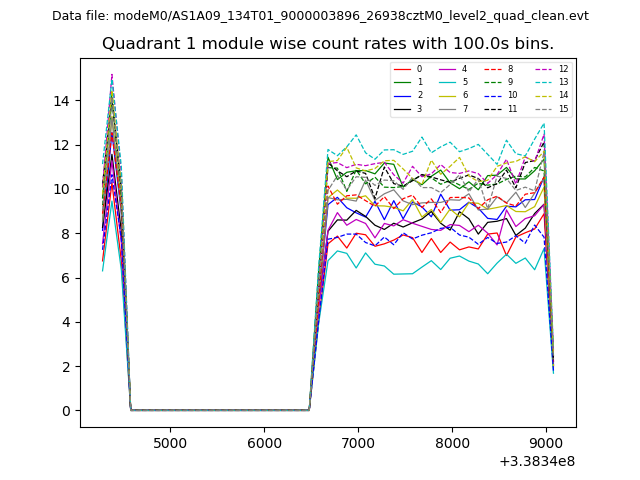
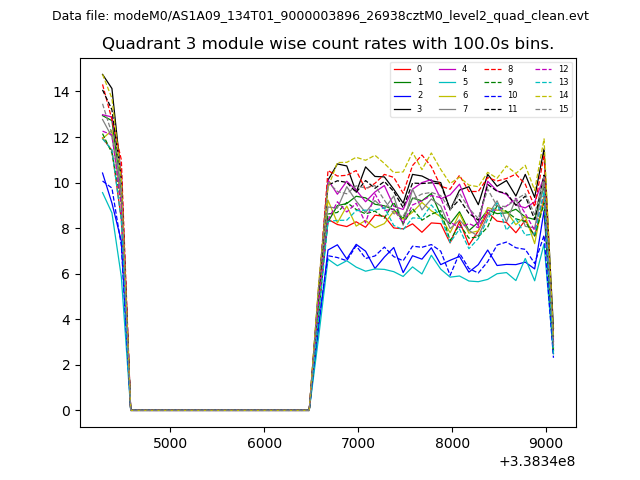
| Module-wise count rates for Quadrant A Data is divided into 100 sec bins |
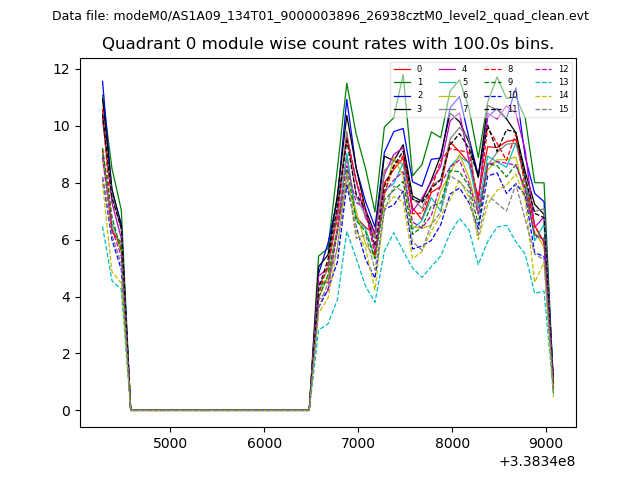 |
 |
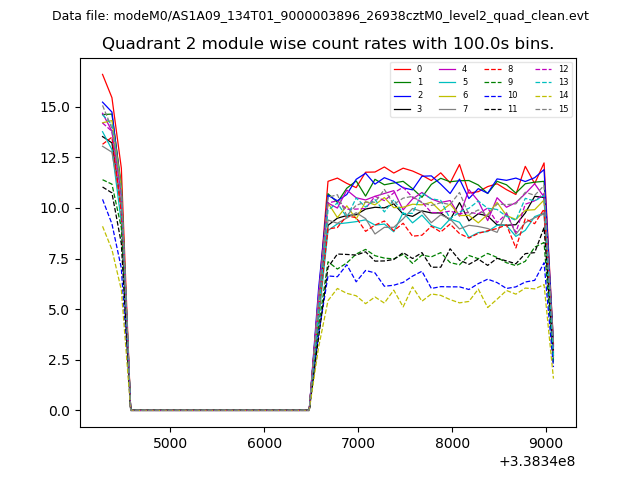
| Module-wise count rates for Quadrant B Data is divided into 100 sec bins |
 |
 |
| Module-wise count rates for Quadrant C Data is divided into 100 sec bins |
 |
 |
| Module-wise count rates for Quadrant D Data is divided into 100 sec bins |
 |
 |
| Parameter | Plot |
|---|---|
| CZT HV Monitor | 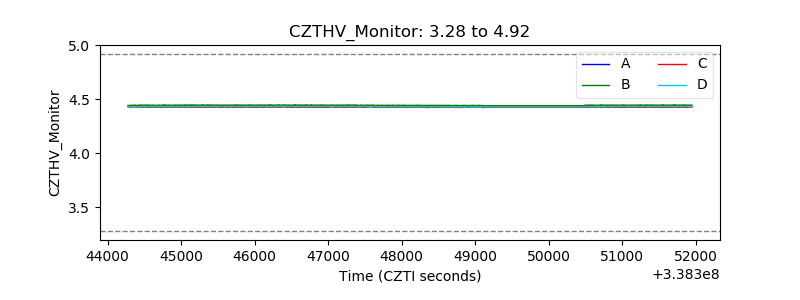 |
| D_VDD | 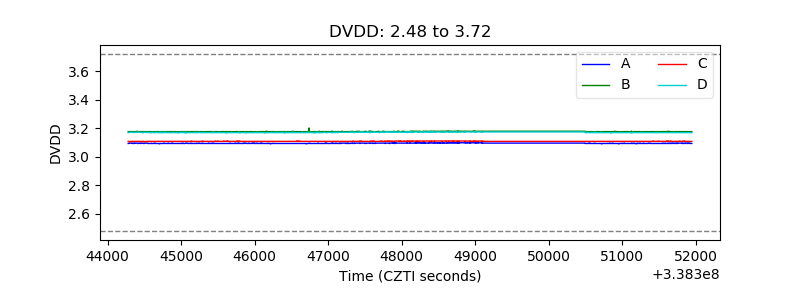 |
| Temperature 1 | 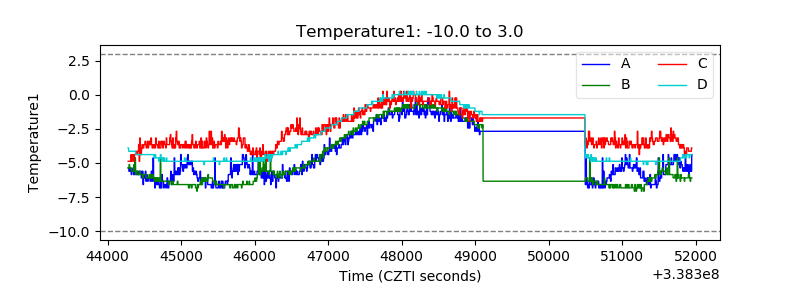 |
| Veto HV Monitor | 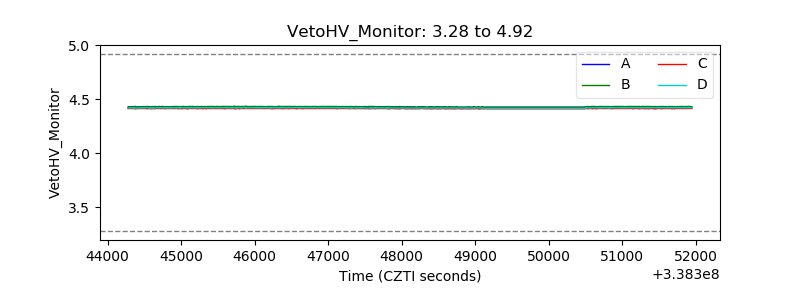 |
| Veto LLD | 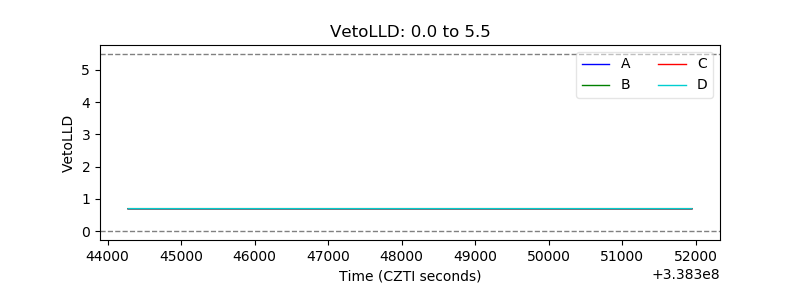 |
| Alpha Counter | 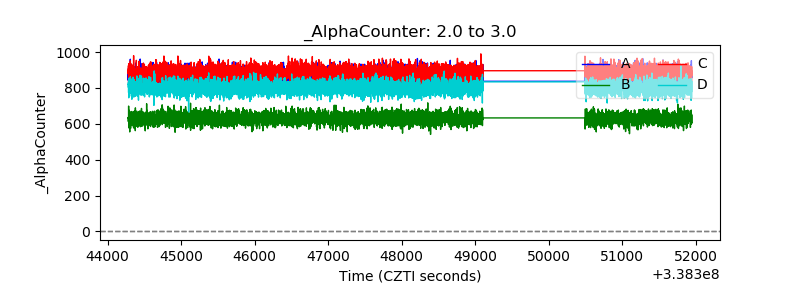 |
| _CPM_Rate | 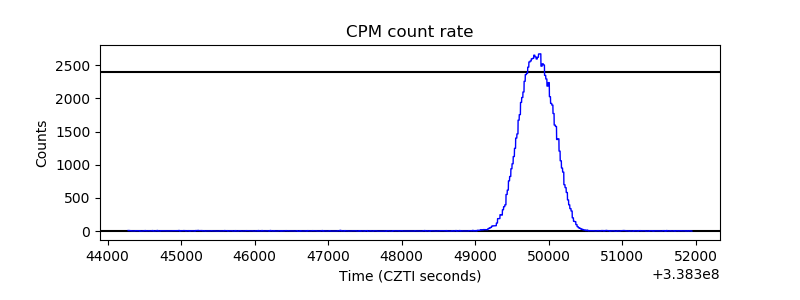 |
| CZT Counter | 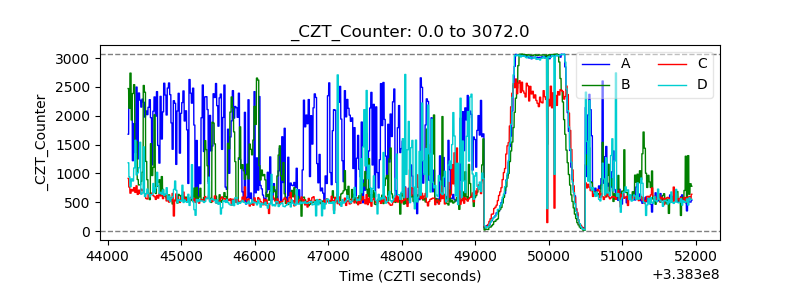 |
| +2.5 Volts monitor |  |
| +5 Volts monitor |  |
| _ROLL_ROT | 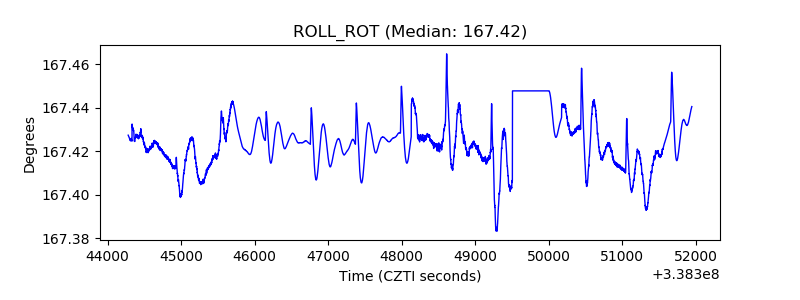 |
| _Roll_DEC | 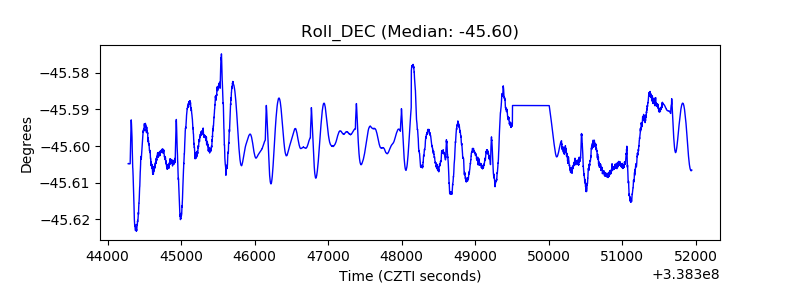 |
| _Roll_RA | 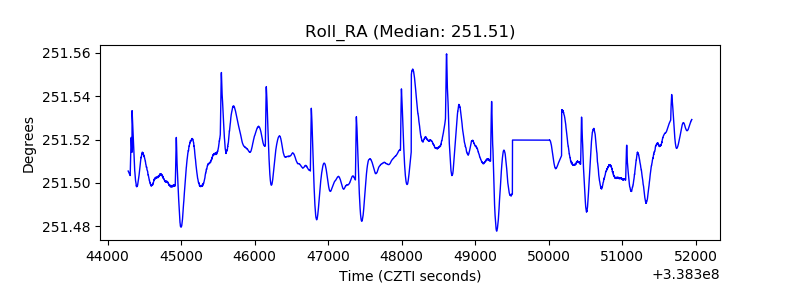 |
| Veto Counter |  |