| Param | Original file | Final file |
|---|---|---|
| Filename | modeM0/AS1A09_134T01_9000003896_26939cztM0_level2.evt | modeM0/AS1A09_134T01_9000003896_26939cztM0_level2_quad_clean.evt |
| Size (bytes) | 668,367,360 | 70,214,400 |
| Size | 637.4 MB | 67.0 MB |
| Events in quadrant A | 6,458,334 | 404,322 |
| Events in quadrant B | 4,737,056 | 443,577 |
| Events in quadrant C | 3,582,542 | 435,265 |
| Events in quadrant D | 5,034,064 | 399,145 |
| Mode M9 | |||
|---|---|---|---|
| Quadrant | BADHDUFLAG | Total packets | Discarded packets |
| A | 0 | 17 | 0 |
| B | 0 | 18 | 0 |
| C | 0 | 18 | 0 |
| D | 0 | 18 | 0 |
| Mode M0 | |||
|---|---|---|---|
| Quadrant | BADHDUFLAG | Total packets | Discarded packets |
| A | 0 | 23218 | 0 |
| B | 0 | 18253 | 0 |
| C | 0 | 14226 | 0 |
| D | 0 | 18968 | 0 |
| Quadrant | Total seconds | Saturated seconds | Saturation percentage |
|---|---|---|---|
| A | 6358 | 1370 | 21.547656% |
| B | 6358 | 310 | 4.875747% |
| C | 6358 | 135 | 2.123309% |
| D | 6357 | 419 | 6.591159% |
Noise dominated data is calculated using 1-second bins in cleaned event files. If a bin has >2000 counts, and if more than 50% of those come from <1% of pixels, then it is considered to be noise-dominated and hence unusable.
| Quadrant | # 1 sec bins | Bins with >0 counts | Bins with >2000 counts | High rate bins dominated by noise | Noise dominated (total time) | Noise dominated (detector-on time) | Marked lightcurve |
|---|---|---|---|---|---|---|---|
| A | 7663 | 6358 | 984 | 984 | 12.84% | 15.48% | 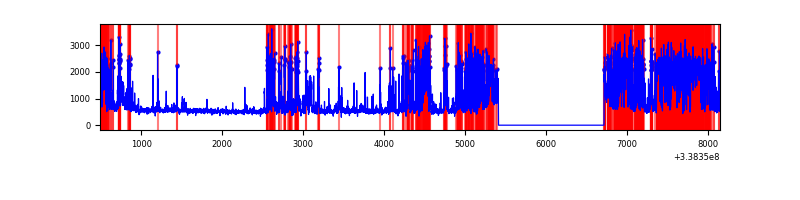 |
| B | 7663 | 6359 | 116 | 116 | 1.51% | 1.82% | 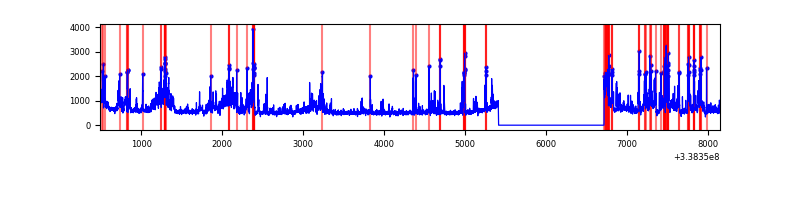 |
| C | 7663 | 6359 | 9 | 9 | 0.12% | 0.14% | 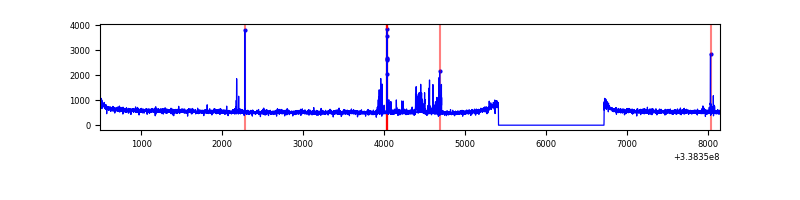 |
| D | 7662 | 6358 | 340 | 340 | 4.44% | 5.35% | 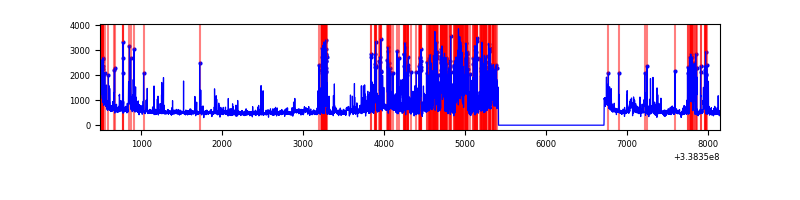 |
Top three noisy pixels from each quadrant. If the there are fewer than three noisy pixels in the level2.evt file, extra rows are filled as -1
| Pixel properties | Quadrant properties | ||||||
|---|---|---|---|---|---|---|---|
| Quadrant | DetID | PixID | Counts | Sigma | Mean | Median | Sigma |
| A | 14 | 235 | 3370504 | 21894.21 | 779 | 768 | 153.9 |
| A | 0 | 13 | 38204 | 243.23 | 779 | 768 | 153.9 |
| A | 8 | 192 | 34741 | 220.73 | 779 | 768 | 153.9 |
| B | 0 | 189 | 1283940 | 8052.75 | 861 | 839 | 159.3 |
| B | 10 | 246 | 37419 | 229.57 | 861 | 839 | 159.3 |
| B | 0 | 219 | 28721 | 174.98 | 861 | 839 | 159.3 |
| C | 14 | 238 | 136028 | 691.89 | 849 | 858 | 195.4 |
| C | 0 | 207 | 116739 | 593.15 | 849 | 858 | 195.4 |
| C | 15 | 208 | 21949 | 107.96 | 849 | 858 | 195.4 |
| D | 1 | 52 | 964281 | 4921.22 | 833 | 813 | 195.8 |
| D | 12 | 33 | 383518 | 1954.79 | 833 | 813 | 195.8 |
| D | 7 | 38 | 244962 | 1247.07 | 833 | 813 | 195.8 |
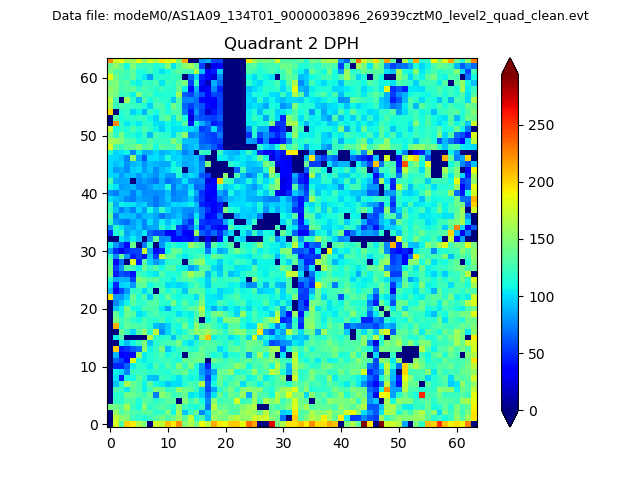
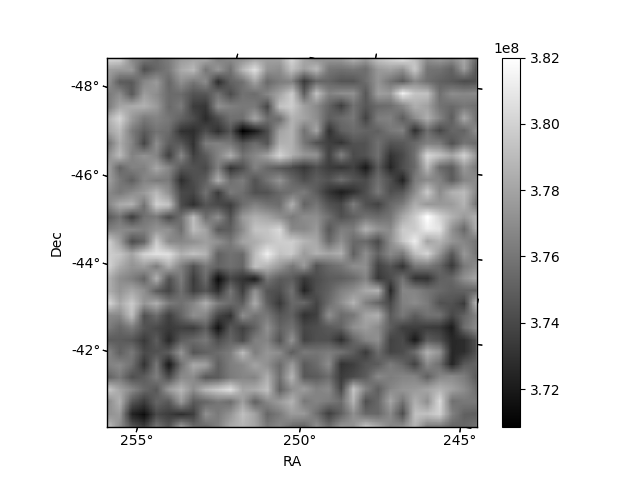
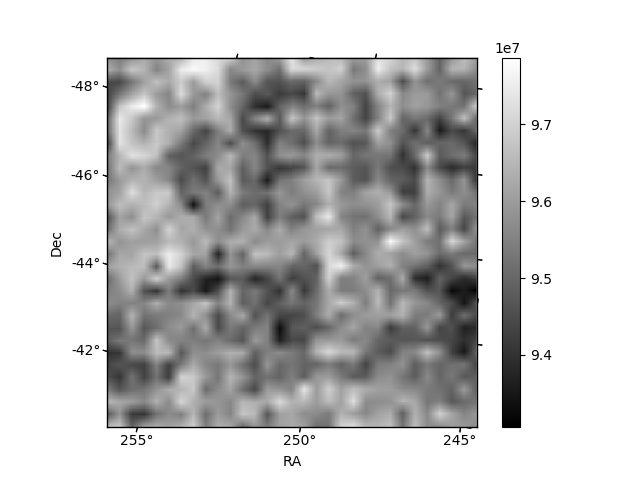
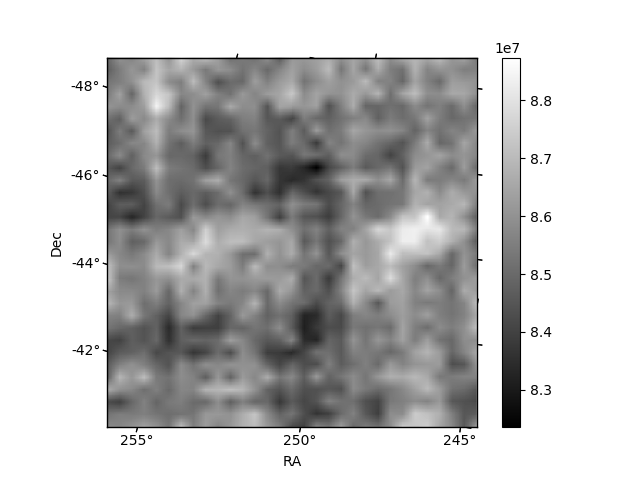
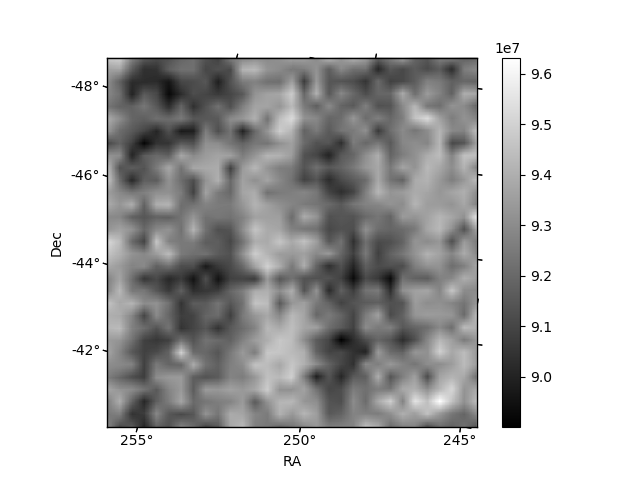
Histogram calculated using DETX and DETY for each event in the final _common_clean file
| Quadrant A | 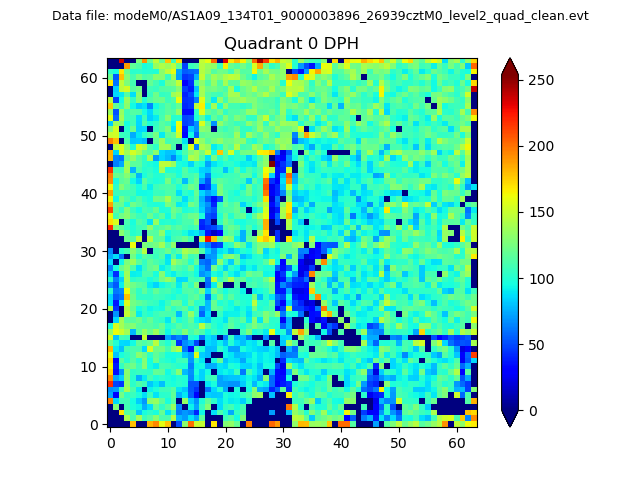 |
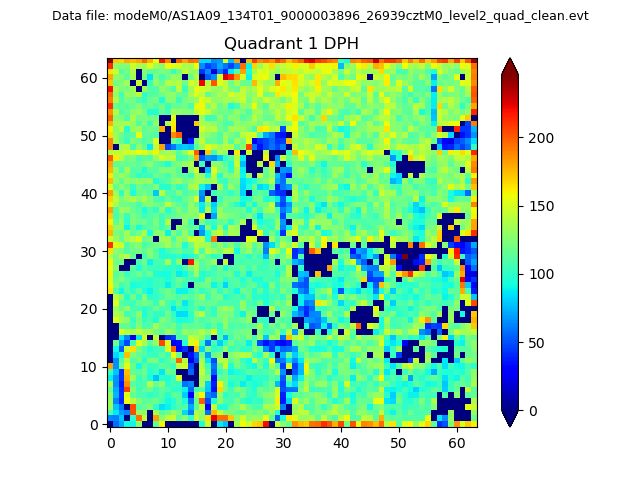 |
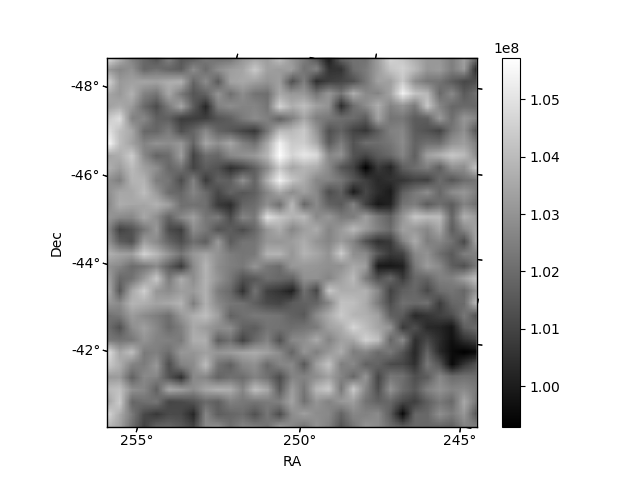
Quadrant B |
|---|---|---|---|
| Quadrant D | 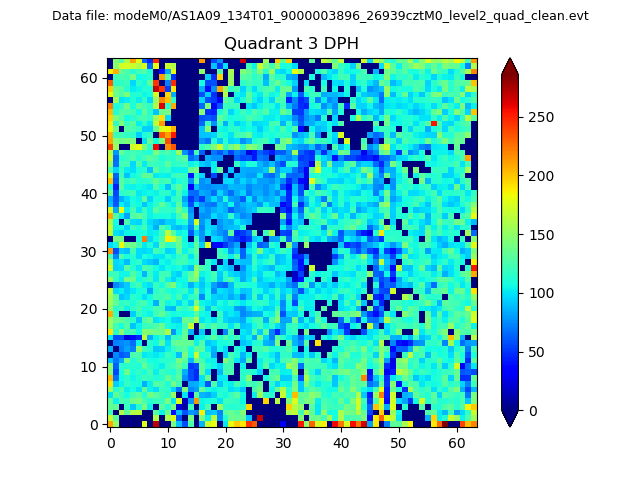 |
 |
Quadrant C |
| Plot type | Count rate plots | Images |
|---|---|---|
| Comparison with Poisson distribution Blue bars denote a histogram of data divided into 1 sec bins. Red curve is a Poisson curve with rate = median count rate of data. |
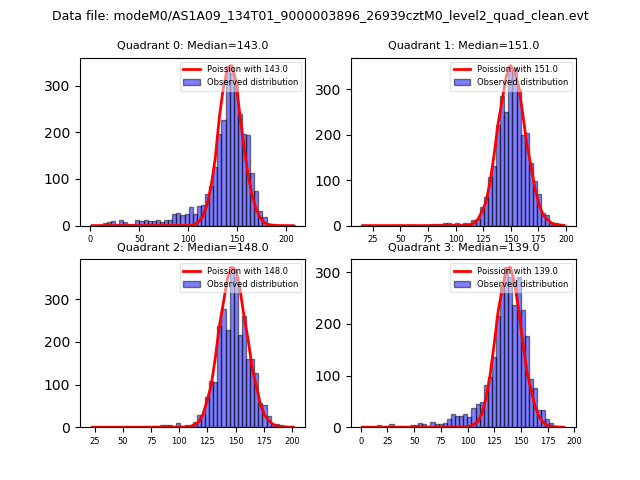 |
 |
| Quadrant-wise count rates Data is divided into 100 sec bins |
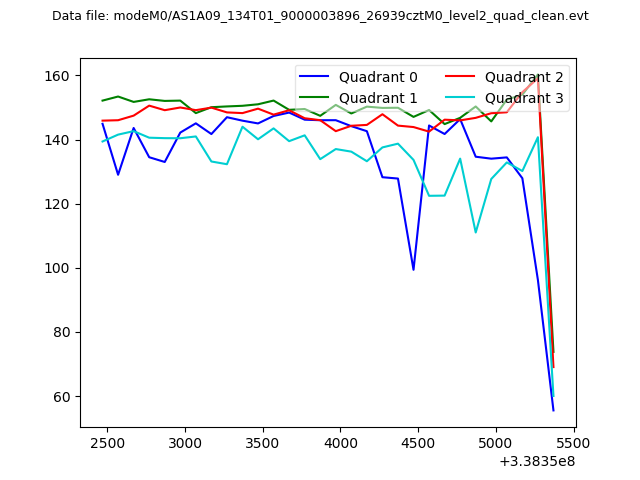 |
|
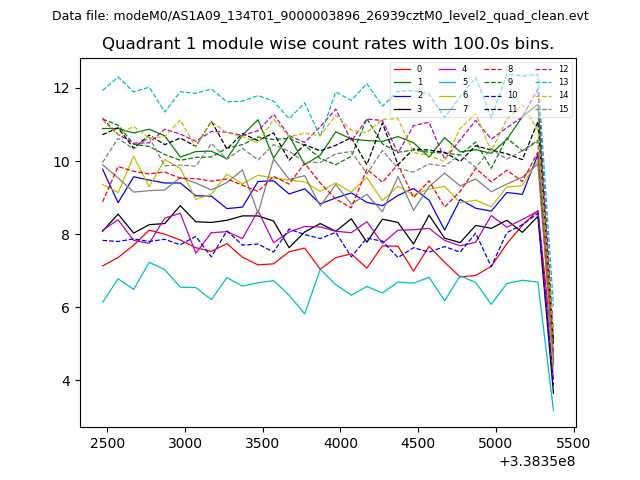
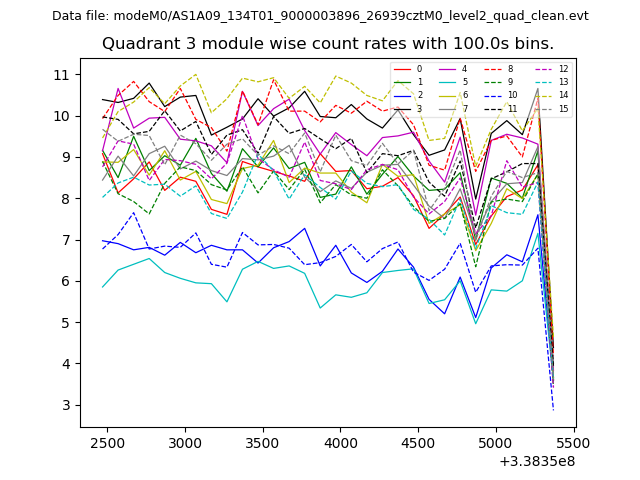
| Module-wise count rates for Quadrant A Data is divided into 100 sec bins |
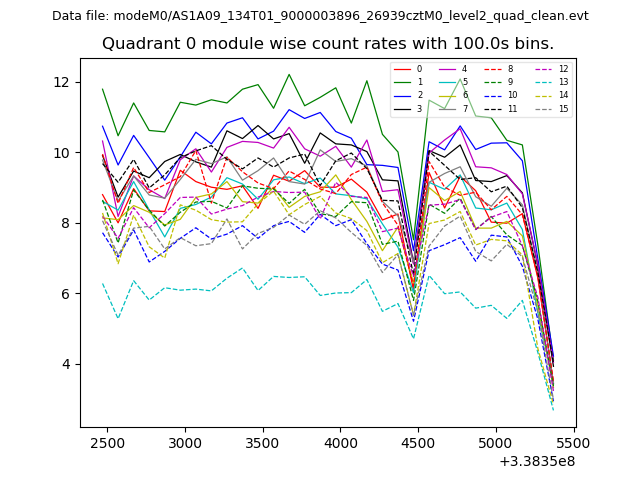 |
 |
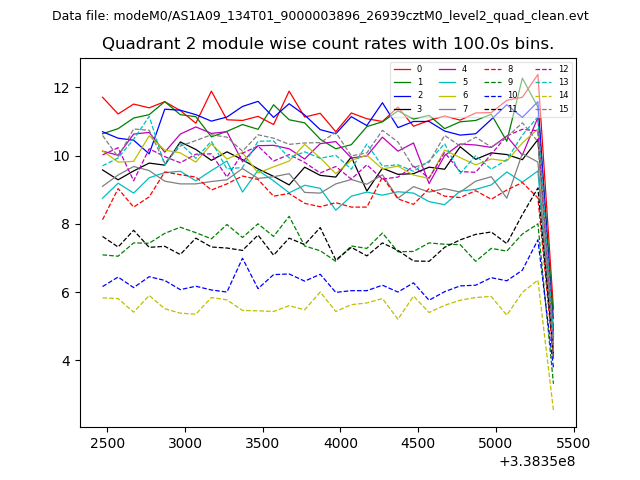
| Module-wise count rates for Quadrant B Data is divided into 100 sec bins |
 |
 |
| Module-wise count rates for Quadrant C Data is divided into 100 sec bins |
 |
 |
| Module-wise count rates for Quadrant D Data is divided into 100 sec bins |
 |
 |
| Parameter | Plot |
|---|---|
| CZT HV Monitor | 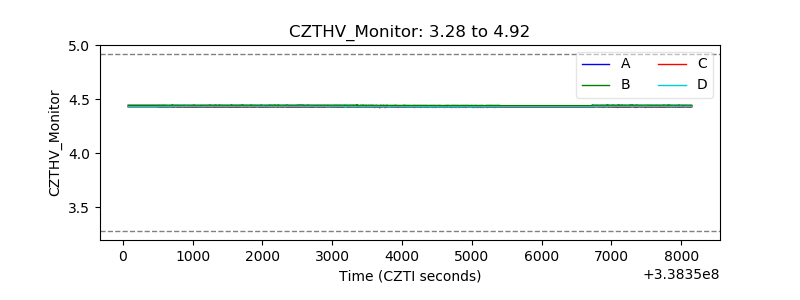 |
| D_VDD | 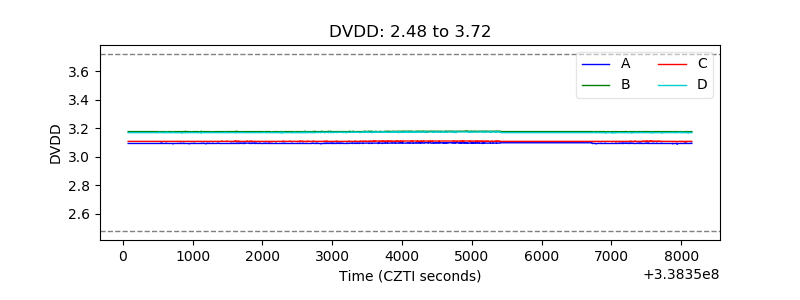 |
| Temperature 1 | 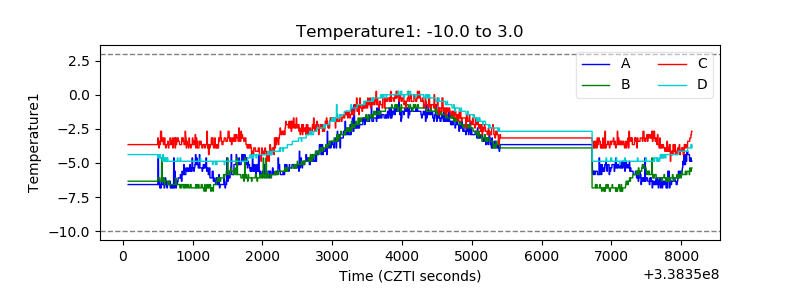 |
| Veto HV Monitor | 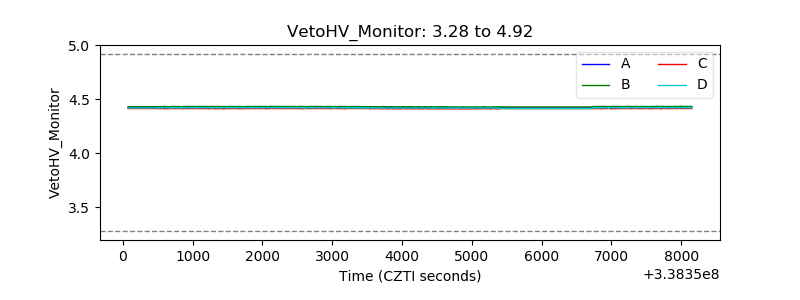 |
| Veto LLD | 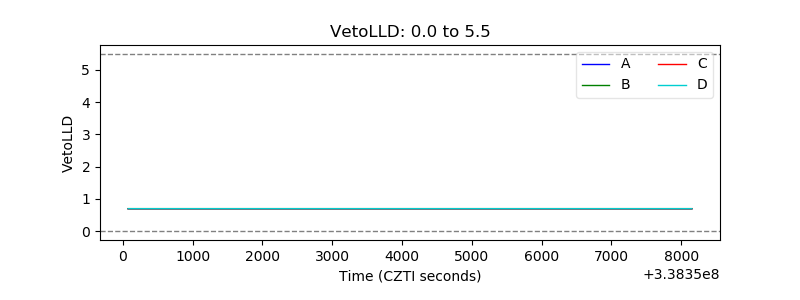 |
| Alpha Counter | 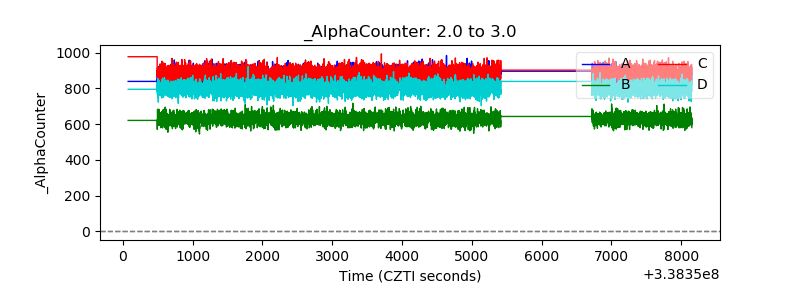 |
| _CPM_Rate | 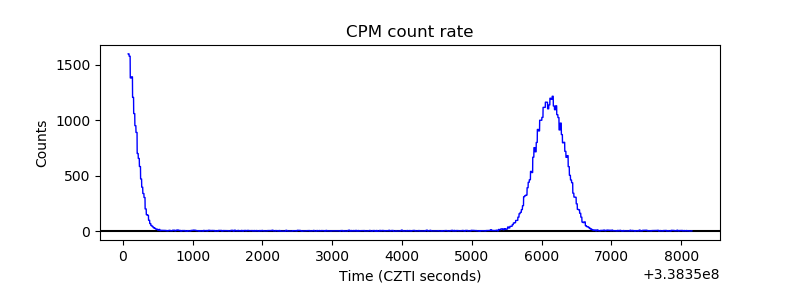 |
| CZT Counter | 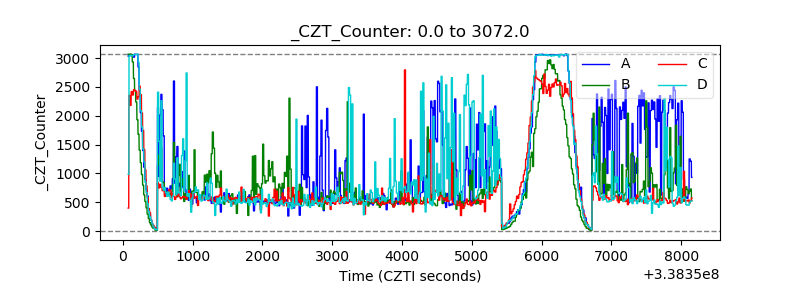 |
| +2.5 Volts monitor |  |
| +5 Volts monitor |  |
| _ROLL_ROT | 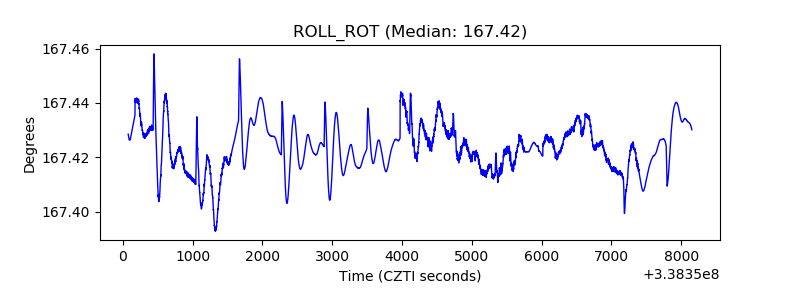 |
| _Roll_DEC | 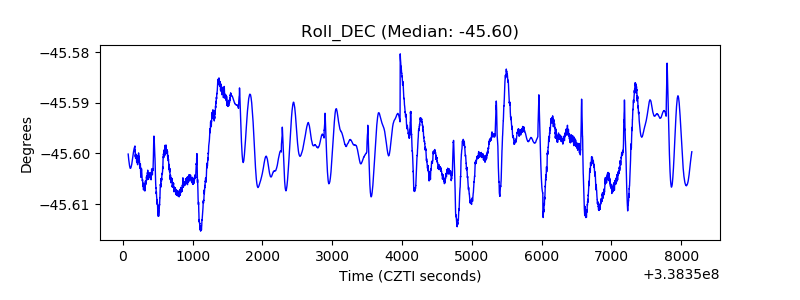 |
| _Roll_RA | 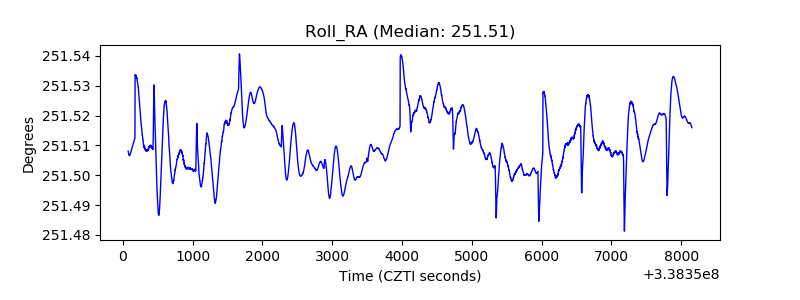 |
| Veto Counter | 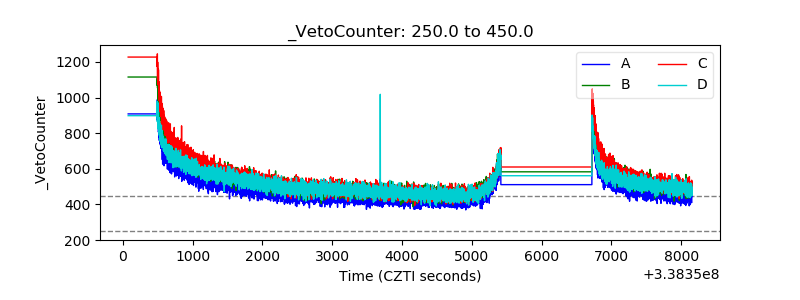 |