| Param | Original file | Final file |
|---|---|---|
| Filename | modeM0/AS1A09_134T01_9000003896_26941cztM0_level2.evt | modeM0/AS1A09_134T01_9000003896_26941cztM0_level2_quad_clean.evt |
| Size (bytes) | 878,688,000 | 84,600,000 |
| Size | 838.0 MB | 80.7 MB |
| Events in quadrant A | 13,245,813 | 319,192 |
| Events in quadrant B | 4,176,160 | 597,812 |
| Events in quadrant C | 3,608,605 | 588,145 |
| Events in quadrant D | 5,096,084 | 556,437 |
| Mode M9 | |||
|---|---|---|---|
| Quadrant | BADHDUFLAG | Total packets | Discarded packets |
| A | 0 | 10 | 0 |
| B | 0 | 11 | 0 |
| C | 0 | 11 | 0 |
| D | 0 | 11 | 0 |
| Mode M0 | |||
|---|---|---|---|
| Quadrant | BADHDUFLAG | Total packets | Discarded packets |
| A | 0 | 44193 | 0 |
| B | 0 | 16774 | 0 |
| C | 0 | 14958 | 0 |
| D | 0 | 19810 | 0 |
| Quadrant | Total seconds | Saturated seconds | Saturation percentage |
|---|---|---|---|
| A | 7158 | 5095 | 71.179100% |
| B | 7158 | 287 | 4.009500% |
| C | 7158 | 215 | 3.003632% |
| D | 7158 | 328 | 4.582286% |
Noise dominated data is calculated using 1-second bins in cleaned event files. If a bin has >2000 counts, and if more than 50% of those come from <1% of pixels, then it is considered to be noise-dominated and hence unusable.
| Quadrant | # 1 sec bins | Bins with >0 counts | Bins with >2000 counts | High rate bins dominated by noise | Noise dominated (total time) | Noise dominated (detector-on time) | Marked lightcurve |
|---|---|---|---|---|---|---|---|
| A | 7713 | 7158 | 4223 | 4223 | 54.75% | 59.00% | 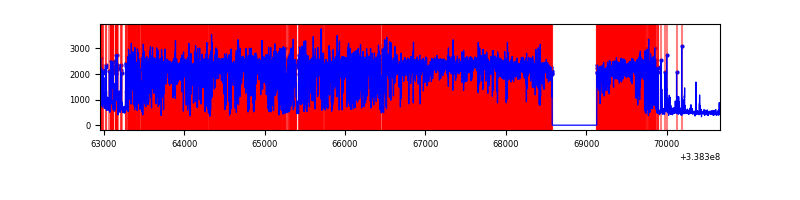 |
| B | 7713 | 7158 | 75 | 75 | 0.97% | 1.05% | 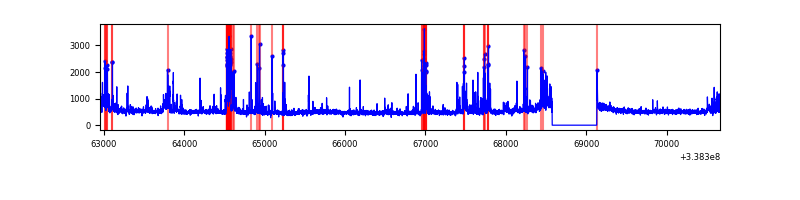 |
| C | 7713 | 7158 | 4 | 4 | 0.05% | 0.06% | 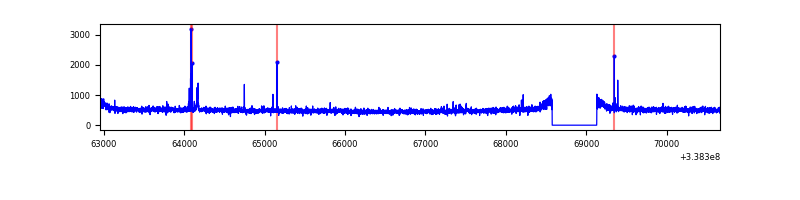 |
| D | 7713 | 7158 | 198 | 198 | 2.57% | 2.77% | 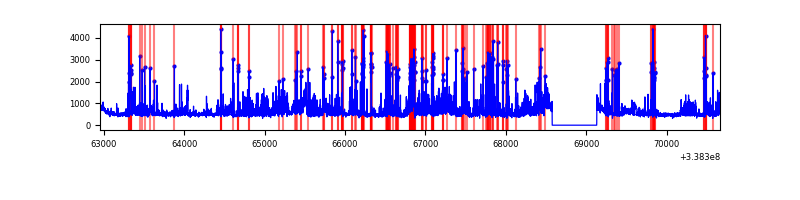 |
Top three noisy pixels from each quadrant. If the there are fewer than three noisy pixels in the level2.evt file, extra rows are filled as -1
| Pixel properties | Quadrant properties | ||||||
|---|---|---|---|---|---|---|---|
| Quadrant | DetID | PixID | Counts | Sigma | Mean | Median | Sigma |
| A | 14 | 235 | 11195165 | 109495.28 | 508 | 498 | 102.2 |
| A | 8 | 192 | 36791 | 354.98 | 508 | 498 | 102.2 |
| A | 5 | 168 | 17964 | 170.84 | 508 | 498 | 102.2 |
| B | 0 | 189 | 503737 | 2946.26 | 895 | 872 | 170.7 |
| B | 15 | 33 | 48402 | 278.48 | 895 | 872 | 170.7 |
| B | 3 | 64 | 40265 | 230.8 | 895 | 872 | 170.7 |
| C | 14 | 238 | 139888 | 683.98 | 873 | 878 | 203.2 |
| C | 15 | 208 | 48103 | 232.36 | 873 | 878 | 203.2 |
| C | 3 | 233 | 14672 | 67.87 | 873 | 878 | 203.2 |
| D | 1 | 52 | 1227434 | 5950.79 | 869 | 846 | 206.1 |
| D | 2 | 250 | 208668 | 1008.25 | 869 | 846 | 206.1 |
| D | 7 | 80 | 188518 | 910.49 | 869 | 846 | 206.1 |
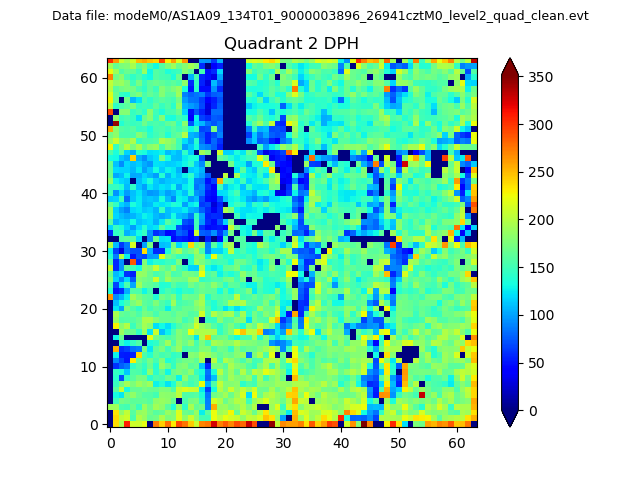
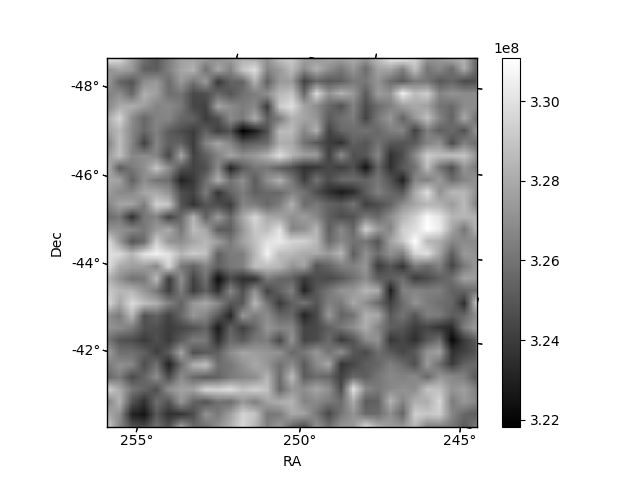
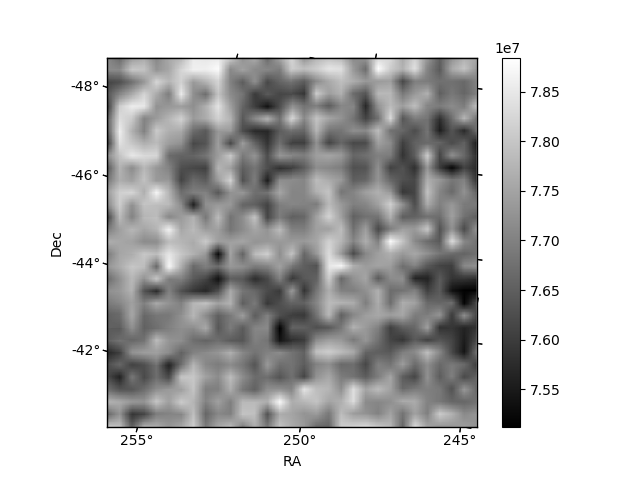
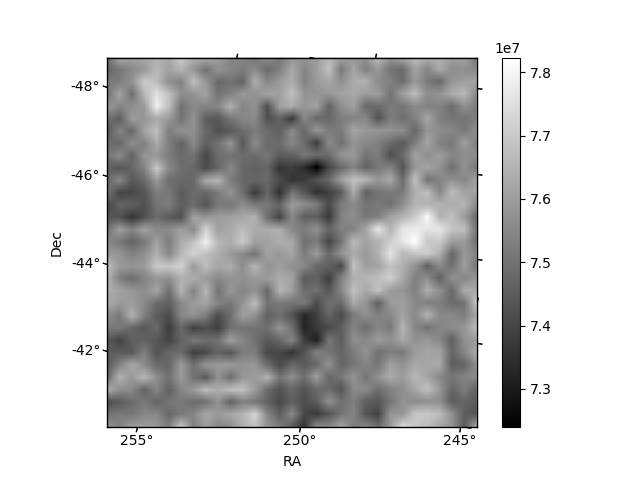
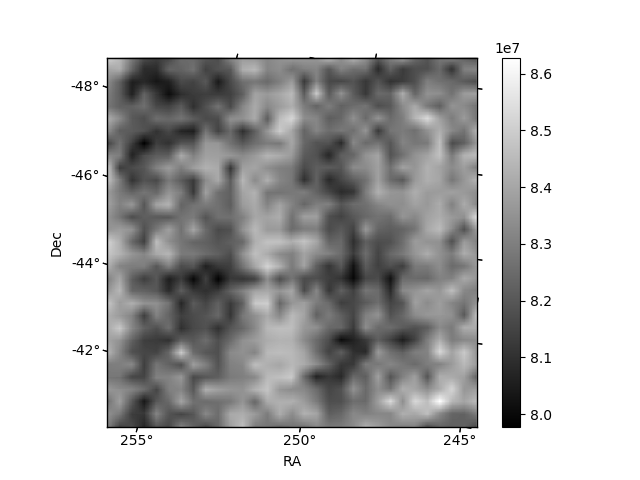
Histogram calculated using DETX and DETY for each event in the final _common_clean file
| Quadrant A | 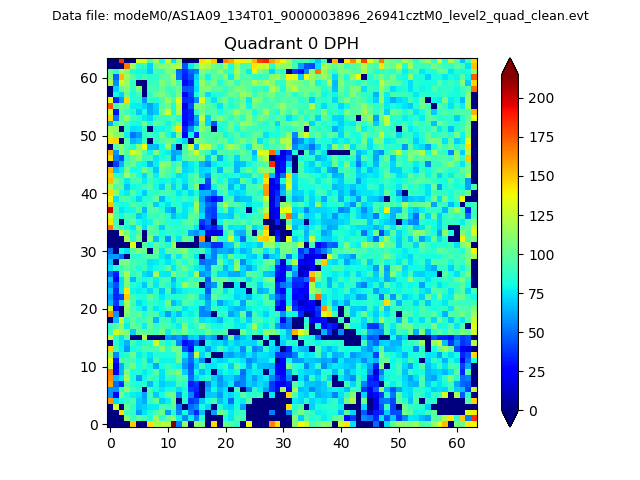 |
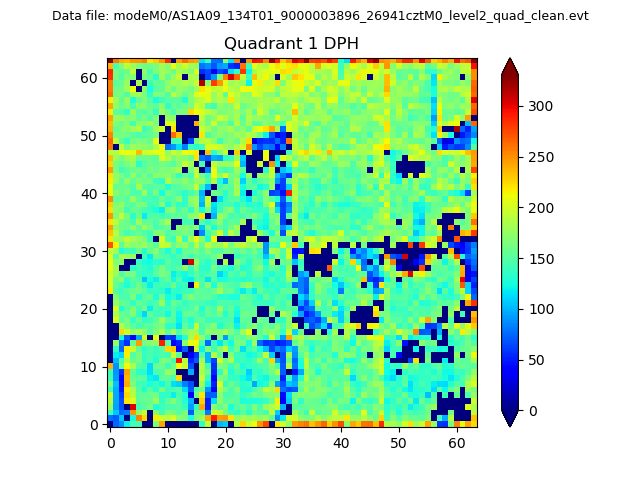 |
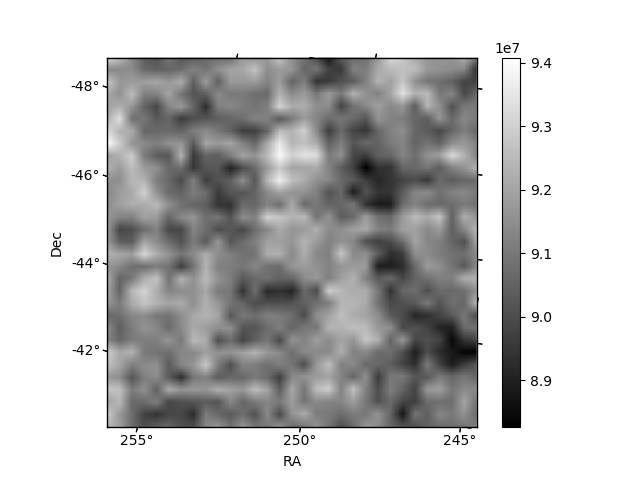
Quadrant B |
|---|---|---|---|
| Quadrant D | 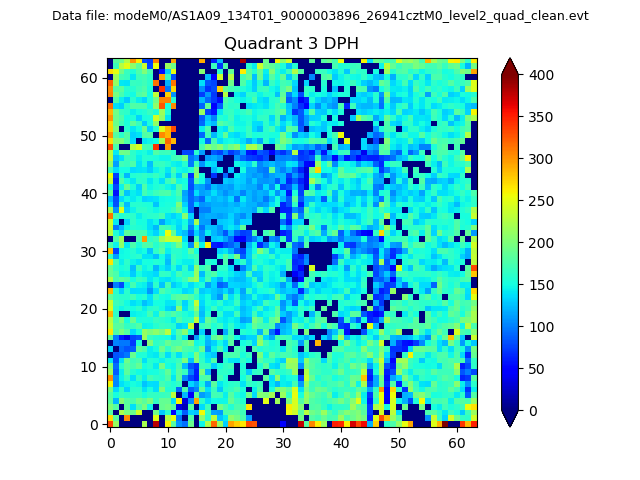 |
 |
Quadrant C |
| Plot type | Count rate plots | Images |
|---|---|---|
| Comparison with Poisson distribution Blue bars denote a histogram of data divided into 1 sec bins. Red curve is a Poisson curve with rate = median count rate of data. |
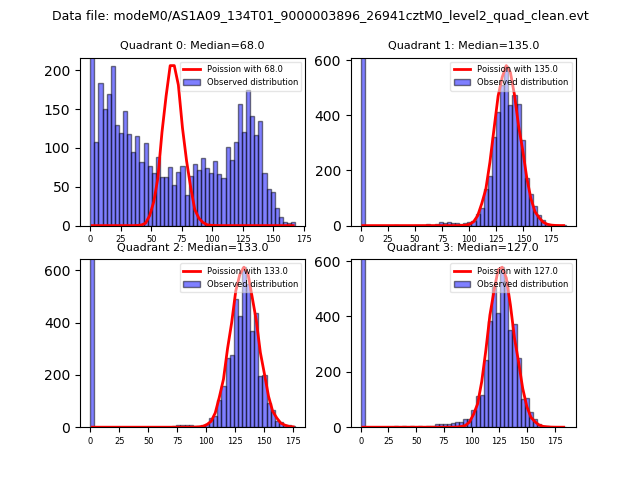 |
 |
| Quadrant-wise count rates Data is divided into 100 sec bins |
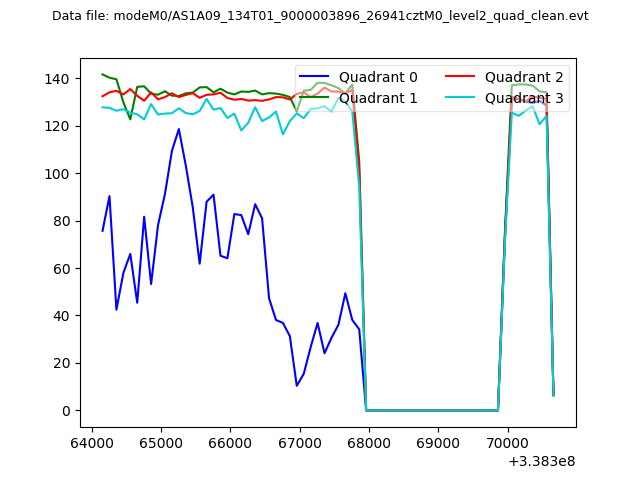 |
|
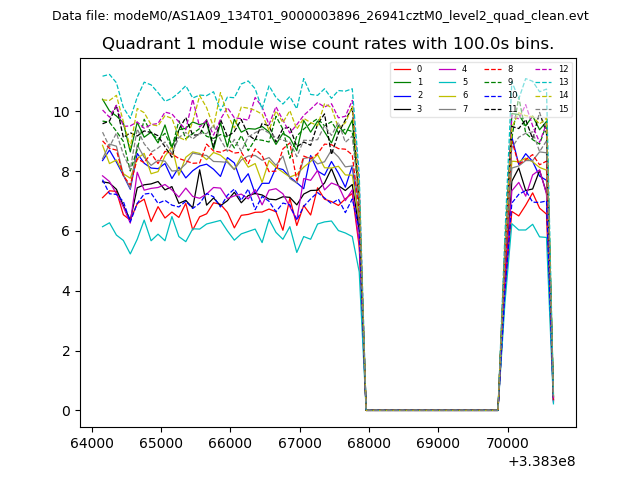
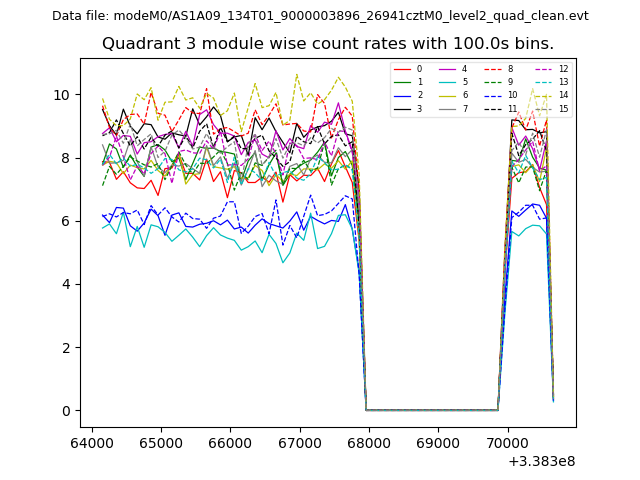
| Module-wise count rates for Quadrant A Data is divided into 100 sec bins |
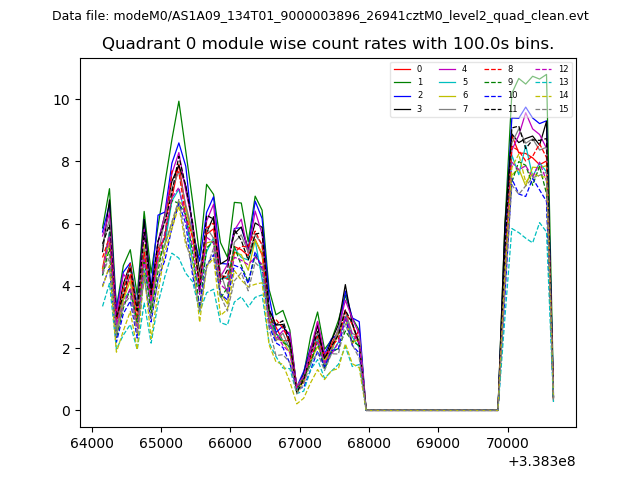 |
 |
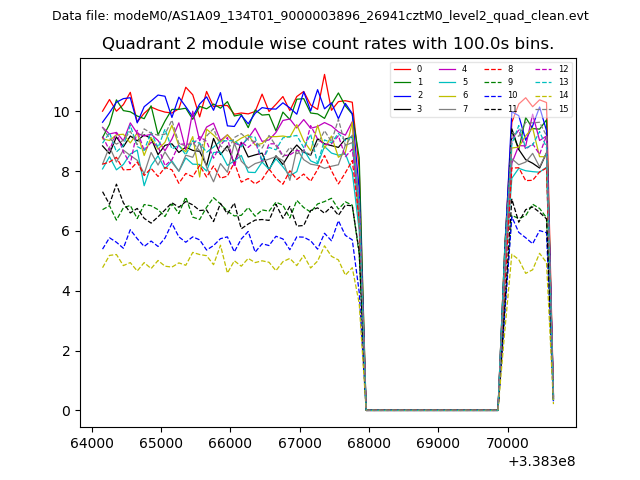
| Module-wise count rates for Quadrant B Data is divided into 100 sec bins |
 |
 |
| Module-wise count rates for Quadrant C Data is divided into 100 sec bins |
 |
 |
| Module-wise count rates for Quadrant D Data is divided into 100 sec bins |
 |
 |
| Parameter | Plot |
|---|---|
| CZT HV Monitor | 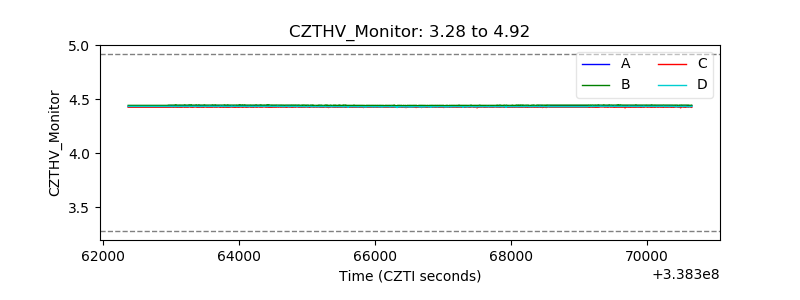 |
| D_VDD | 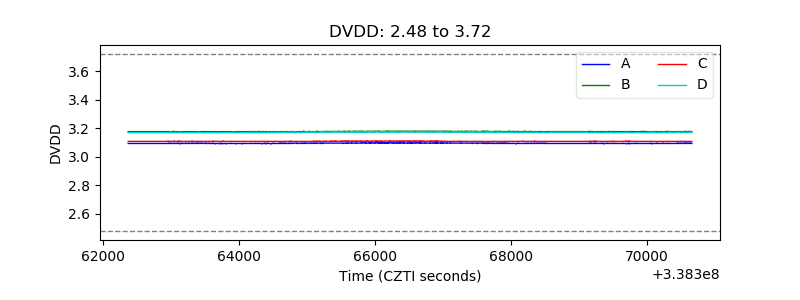 |
| Temperature 1 | 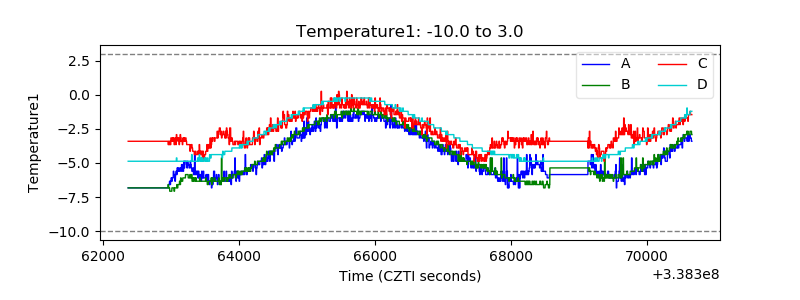 |
| Veto HV Monitor | 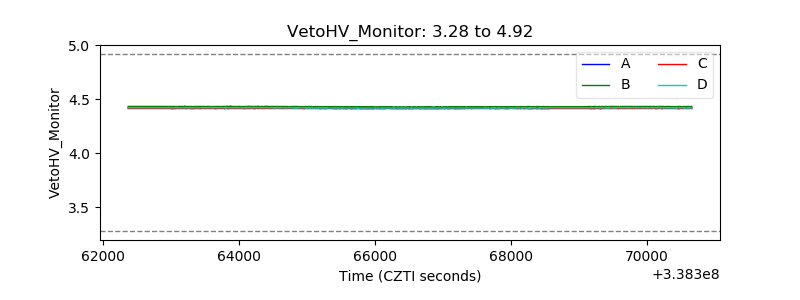 |
| Veto LLD | 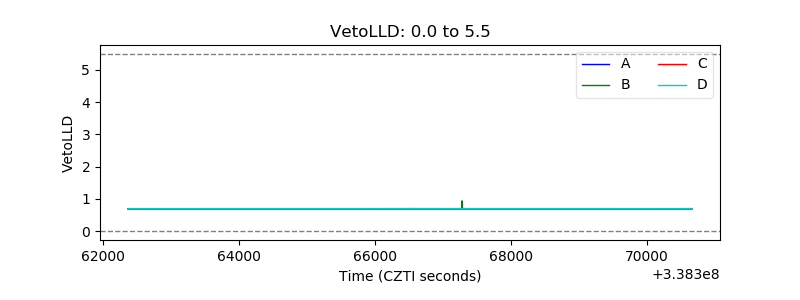 |
| Alpha Counter | 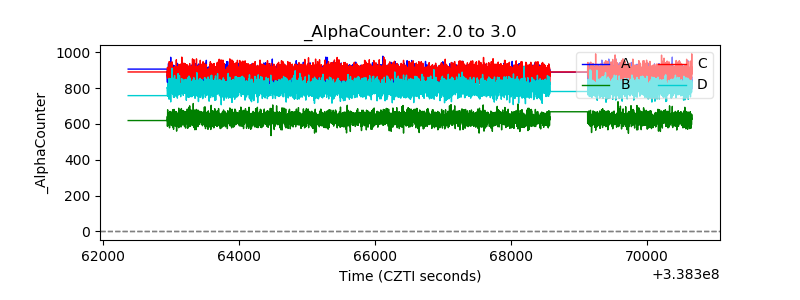 |
| _CPM_Rate | 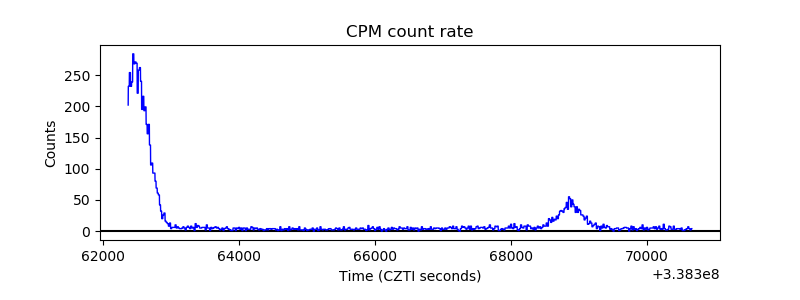 |
| CZT Counter | 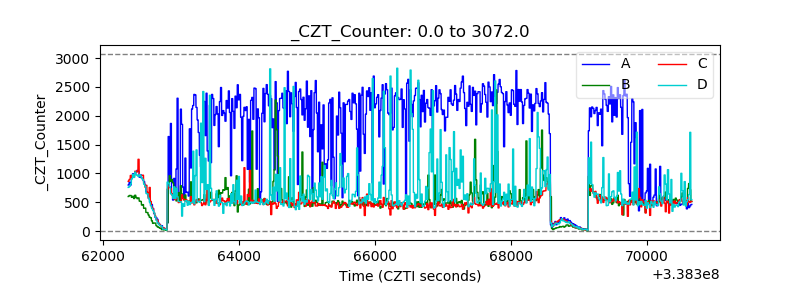 |
| +2.5 Volts monitor |  |
| +5 Volts monitor |  |
| _ROLL_ROT | 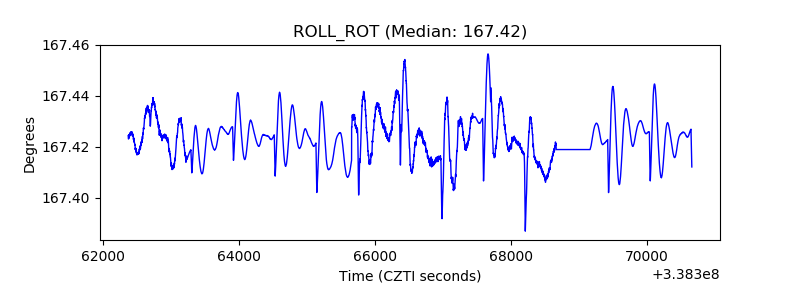 |
| _Roll_DEC | 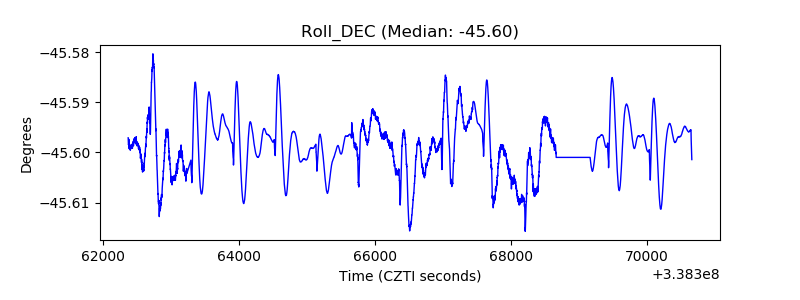 |
| _Roll_RA | 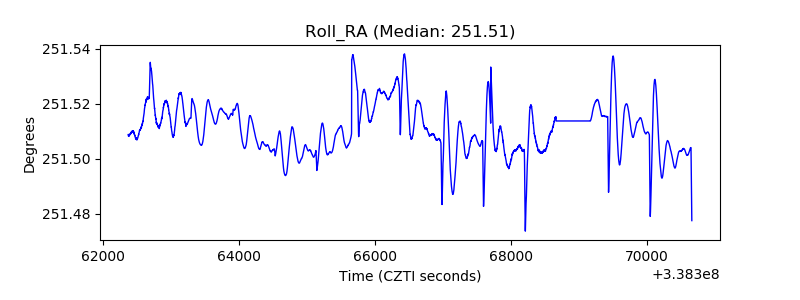 |
| Veto Counter | 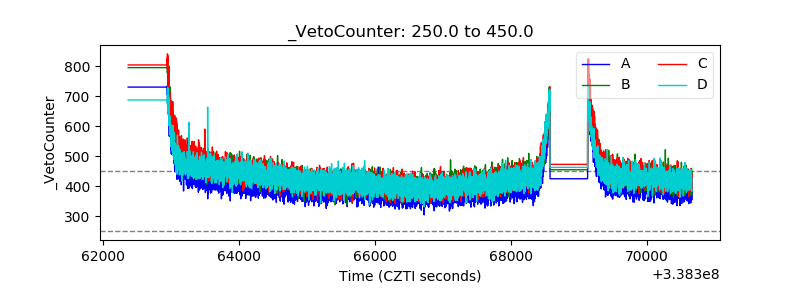 |