| Param | Original file | Final file |
|---|---|---|
| Filename | modeM0/AS1A09_134T01_9000003896_26942cztM0_level2.evt | modeM0/AS1A09_134T01_9000003896_26942cztM0_level2_quad_clean.evt |
| Size (bytes) | 795,689,280 | 95,814,720 |
| Size | 758.8 MB | 91.4 MB |
| Events in quadrant A | 9,935,615 | 526,502 |
| Events in quadrant B | 4,117,074 | 642,017 |
| Events in quadrant C | 3,713,356 | 626,766 |
| Events in quadrant D | 5,821,835 | 581,378 |
| Mode M9 | |||
|---|---|---|---|
| Quadrant | BADHDUFLAG | Total packets | Discarded packets |
| A | 0 | 3 | 0 |
| B | 0 | 3 | 0 |
| C | 0 | 3 | 0 |
| D | 0 | 3 | 0 |
| Mode M0 | |||
|---|---|---|---|
| Quadrant | BADHDUFLAG | Total packets | Discarded packets |
| A | 0 | 34592 | 0 |
| B | 0 | 16915 | 0 |
| C | 0 | 15689 | 0 |
| D | 0 | 22213 | 0 |
| Quadrant | Total seconds | Saturated seconds | Saturation percentage |
|---|---|---|---|
| A | 7536 | 2901 | 38.495223% |
| B | 7535 | 265 | 3.516921% |
| C | 7536 | 201 | 2.667197% |
| D | 7536 | 544 | 7.218684% |
Noise dominated data is calculated using 1-second bins in cleaned event files. If a bin has >2000 counts, and if more than 50% of those come from <1% of pixels, then it is considered to be noise-dominated and hence unusable.
| Quadrant | # 1 sec bins | Bins with >0 counts | Bins with >2000 counts | High rate bins dominated by noise | Noise dominated (total time) | Noise dominated (detector-on time) | Marked lightcurve |
|---|---|---|---|---|---|---|---|
| A | 7780 | 7535 | 2100 | 2100 | 26.99% | 27.87% | 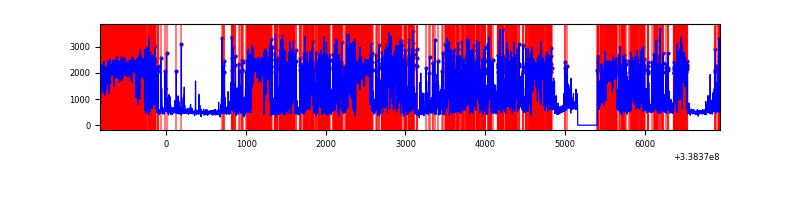 |
| B | 7780 | 7535 | 46 | 46 | 0.59% | 0.61% | 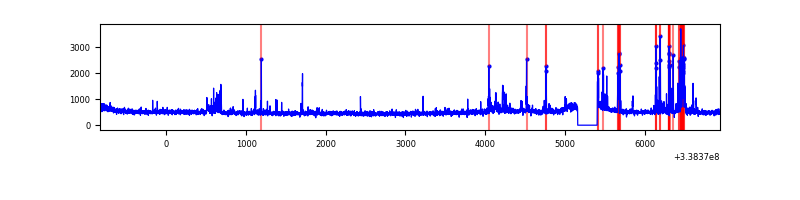 |
| C | 7781 | 7536 | 1 | 1 | 0.01% | 0.01% | 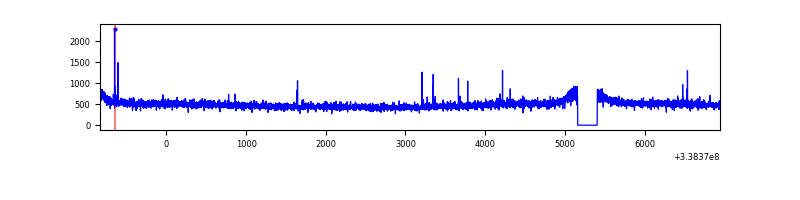 |
| D | 7781 | 7536 | 404 | 404 | 5.19% | 5.36% | 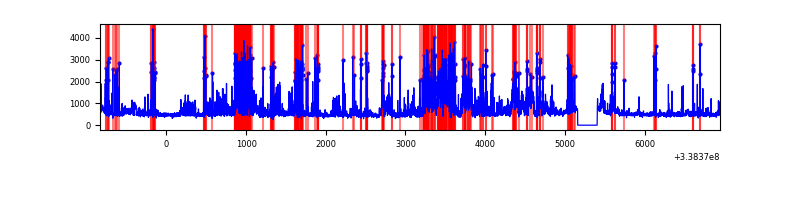 |
Top three noisy pixels from each quadrant. If the there are fewer than three noisy pixels in the level2.evt file, extra rows are filled as -1
| Pixel properties | Quadrant properties | ||||||
|---|---|---|---|---|---|---|---|
| Quadrant | DetID | PixID | Counts | Sigma | Mean | Median | Sigma |
| A | 14 | 235 | 6961954 | 45485.2 | 756 | 739 | 153.0 |
| A | 8 | 192 | 27568 | 175.3 | 756 | 739 | 153.0 |
| A | 5 | 168 | 22522 | 142.33 | 756 | 739 | 153.0 |
| B | 0 | 189 | 270739 | 1521.43 | 930 | 905 | 177.4 |
| B | 15 | 33 | 111673 | 624.55 | 930 | 905 | 177.4 |
| B | 0 | 219 | 40538 | 223.47 | 930 | 905 | 177.4 |
| C | 14 | 238 | 145163 | 677.49 | 907 | 913 | 212.9 |
| C | 15 | 208 | 19919 | 89.26 | 907 | 913 | 212.9 |
| C | 13 | 61 | 6211 | 24.88 | 907 | 913 | 212.9 |
| D | 1 | 52 | 1416921 | 6696.39 | 892 | 867 | 211.5 |
| D | 2 | 250 | 426082 | 2010.8 | 892 | 867 | 211.5 |
| D | 7 | 80 | 379222 | 1789.21 | 892 | 867 | 211.5 |
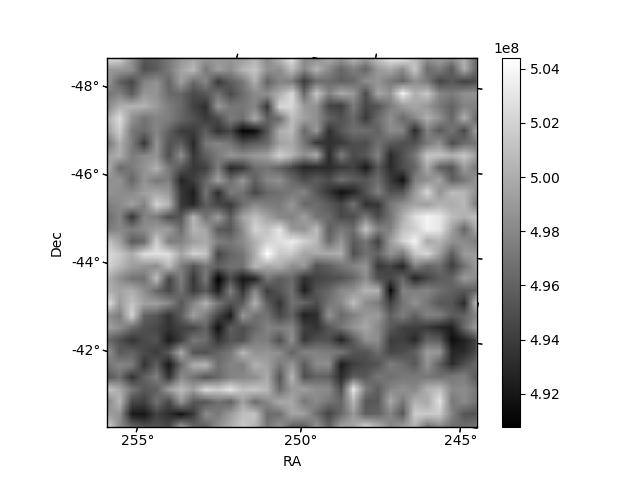
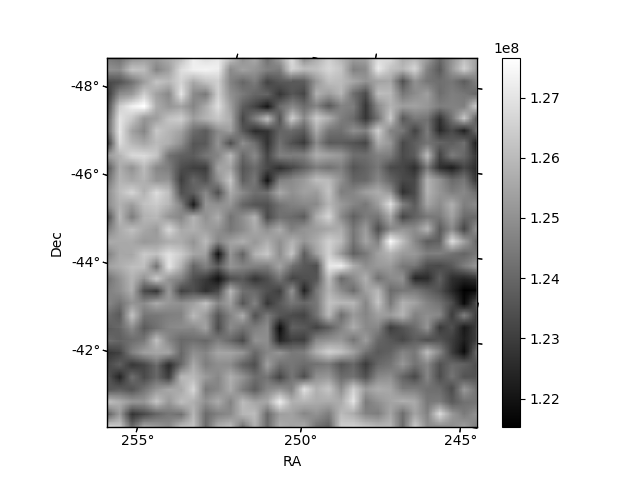
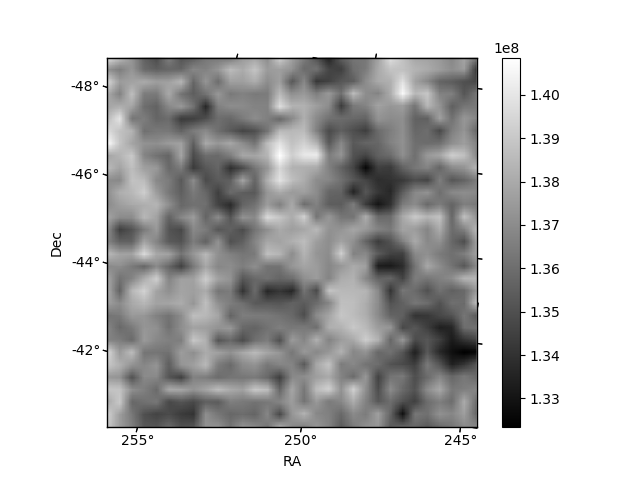
Histogram calculated using DETX and DETY for each event in the final _common_clean file
| Quadrant A | 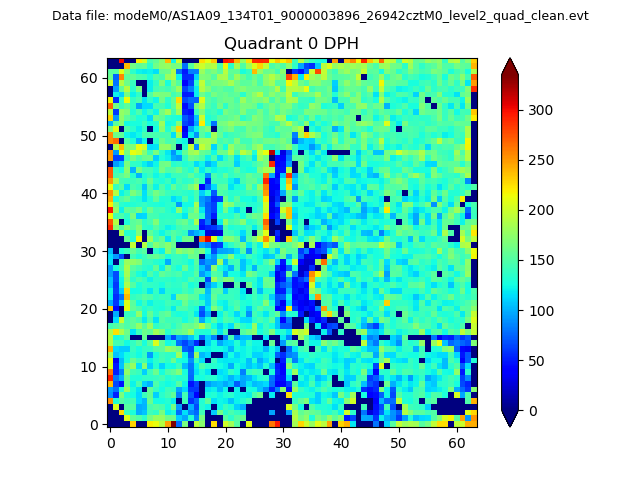 |
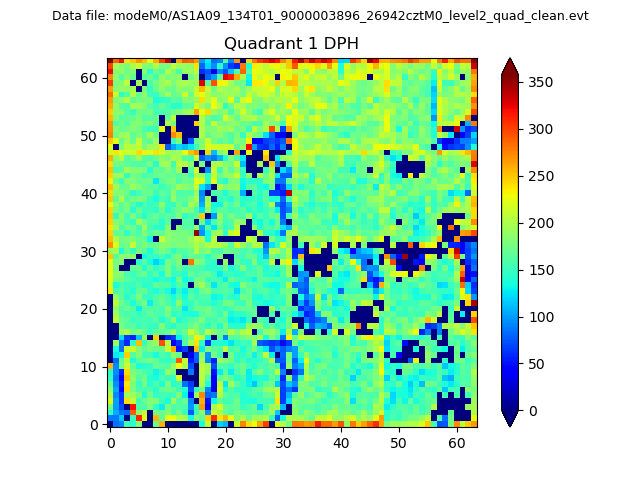 |
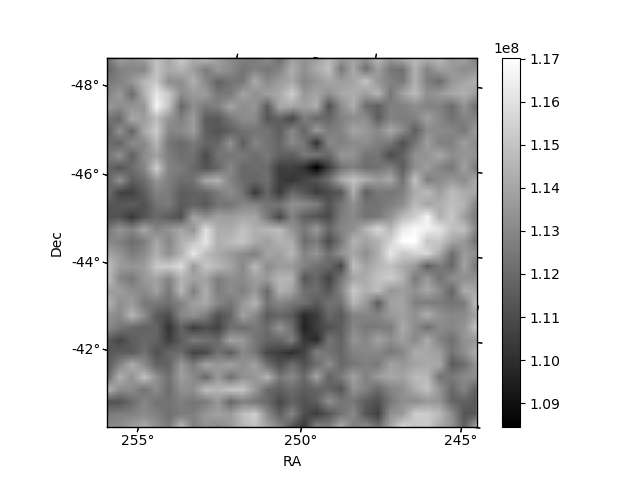
Quadrant B |
|---|---|---|---|
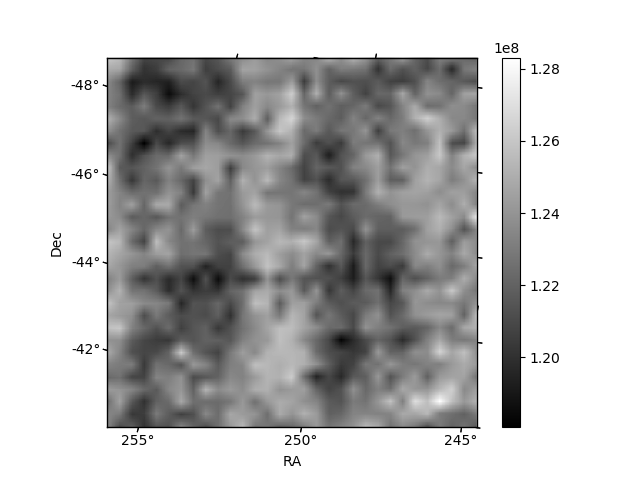
| Quadrant D |  |
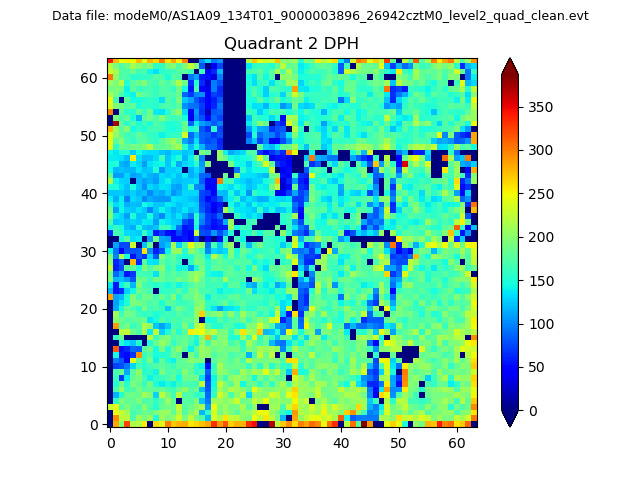 |
Quadrant C |
| Plot type | Count rate plots | Images |
|---|---|---|
| Comparison with Poisson distribution Blue bars denote a histogram of data divided into 1 sec bins. Red curve is a Poisson curve with rate = median count rate of data. |
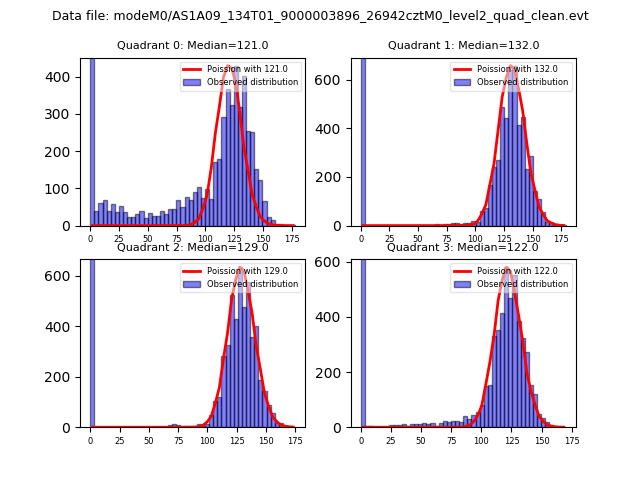 |
 |
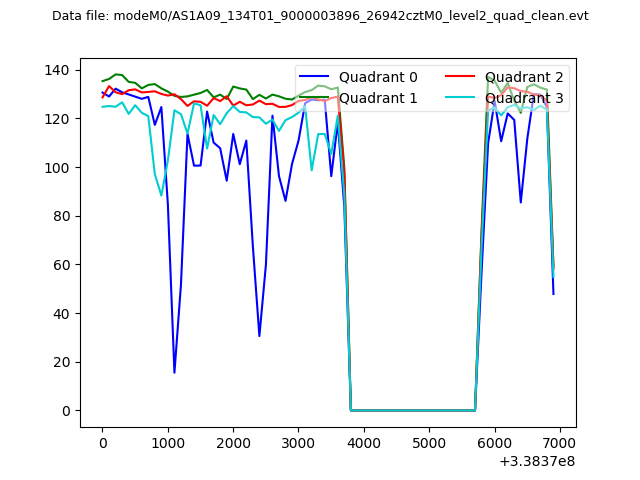
| Quadrant-wise count rates Data is divided into 100 sec bins |
 |
|
| Module-wise count rates for Quadrant A Data is divided into 100 sec bins |
 |
 |
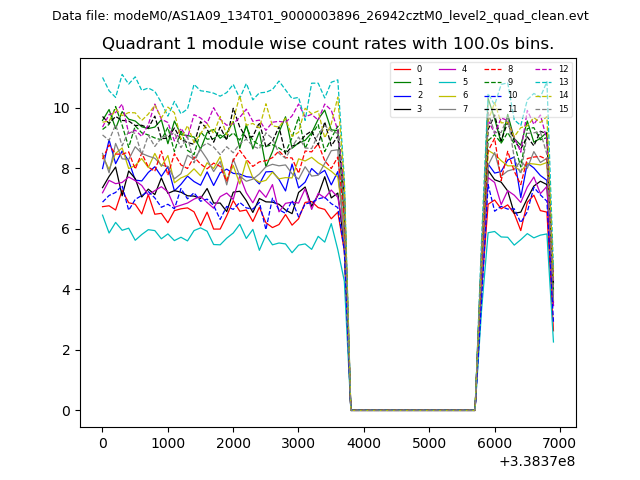
| Module-wise count rates for Quadrant B Data is divided into 100 sec bins |
 |
 |
| Module-wise count rates for Quadrant C Data is divided into 100 sec bins |
 |
 |
| Module-wise count rates for Quadrant D Data is divided into 100 sec bins |
 |
 |
| Parameter | Plot |
|---|---|
| CZT HV Monitor | 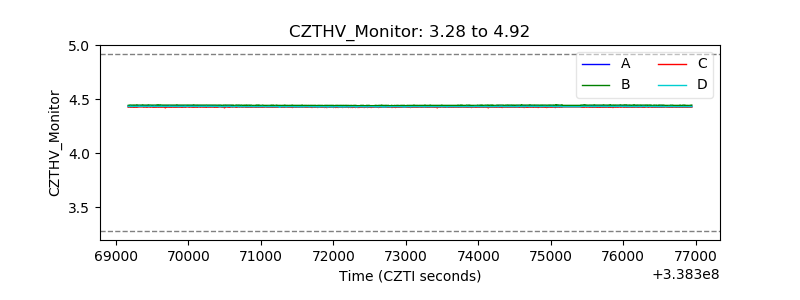 |
| D_VDD | 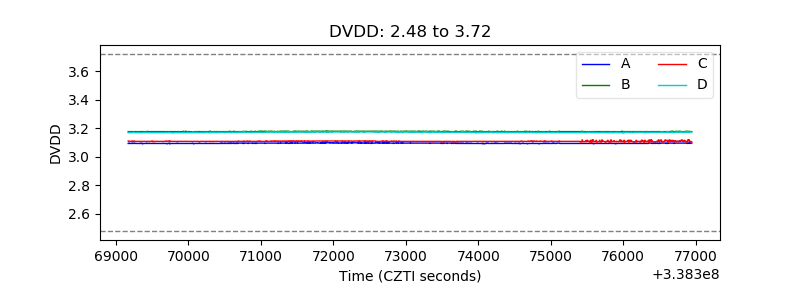 |
| Temperature 1 | 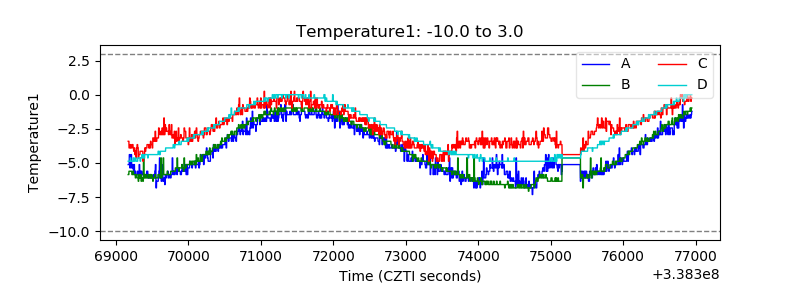 |
| Veto HV Monitor |  |
| Veto LLD | 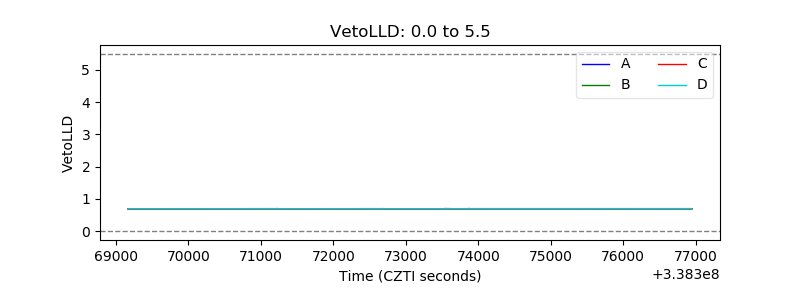 |
| Alpha Counter | 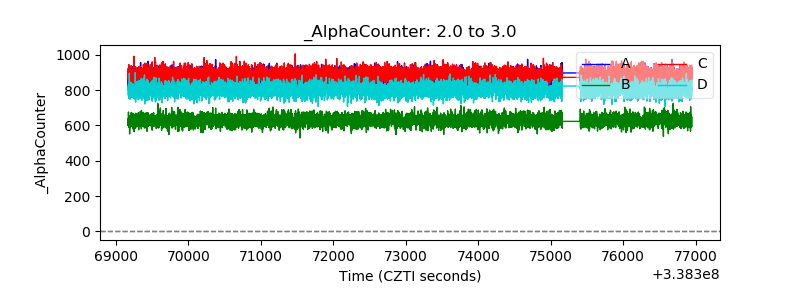 |
| _CPM_Rate | 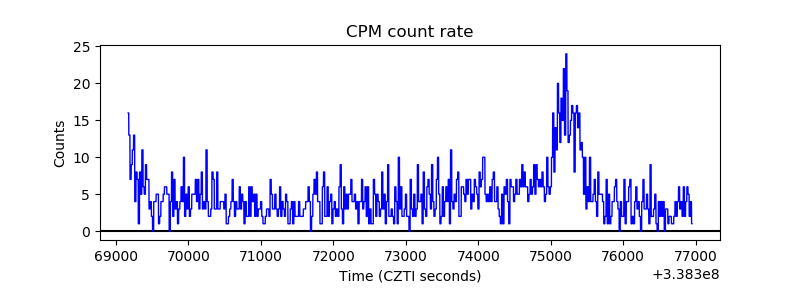 |
| CZT Counter | 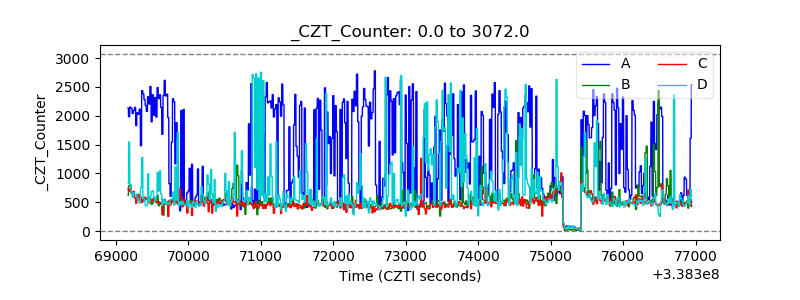 |
| +2.5 Volts monitor | 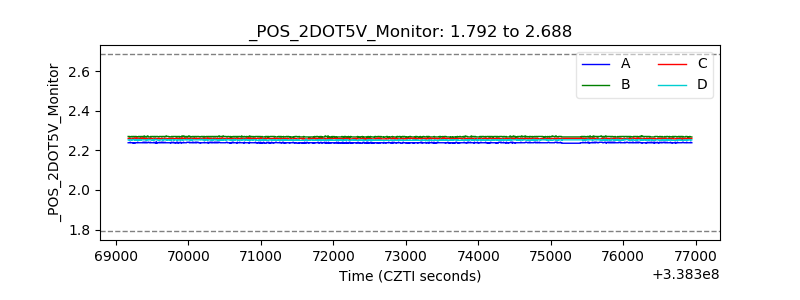 |
| +5 Volts monitor |  |
| _ROLL_ROT | 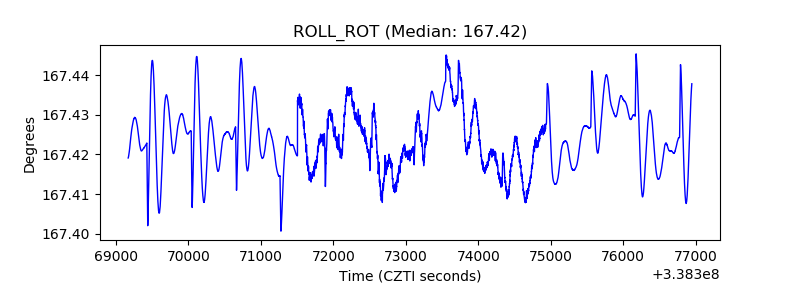 |
| _Roll_DEC |  |
| _Roll_RA | 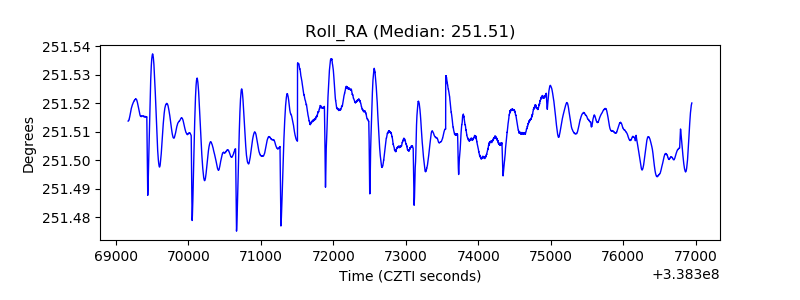 |
| Veto Counter | 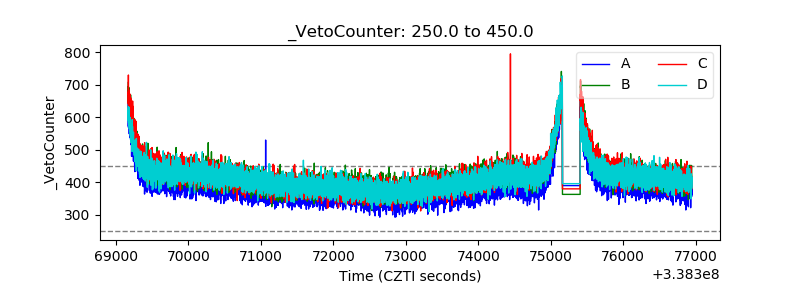 |