| Param | Original file | Final file |
|---|---|---|
| Filename | modeM0/AS1A09_134T01_9000003896_26943cztM0_level2.evt | modeM0/AS1A09_134T01_9000003896_26943cztM0_level2_quad_clean.evt |
| Size (bytes) | 810,455,040 | 95,880,960 |
| Size | 772.9 MB | 91.4 MB |
| Events in quadrant A | 11,043,832 | 470,683 |
| Events in quadrant B | 3,743,381 | 669,117 |
| Events in quadrant C | 3,530,272 | 657,207 |
| Events in quadrant D | 5,752,345 | 616,238 |
| Mode M9 | |||
|---|---|---|---|
| Quadrant | BADHDUFLAG | Total packets | Discarded packets |
| A | 0 | 3 | 0 |
| B | 0 | 3 | 0 |
| C | 0 | 3 | 0 |
| D | 0 | 3 | 0 |
| Mode M0 | |||
|---|---|---|---|
| Quadrant | BADHDUFLAG | Total packets | Discarded packets |
| A | 0 | 37620 | 0 |
| B | 0 | 15461 | 0 |
| C | 0 | 14767 | 0 |
| D | 0 | 21674 | 0 |
| Quadrant | Total seconds | Saturated seconds | Saturation percentage |
|---|---|---|---|
| A | 7022 | 3666 | 52.207348% |
| B | 7022 | 237 | 3.375107% |
| C | 7021 | 151 | 2.150691% |
| D | 7021 | 608 | 8.659735% |
Noise dominated data is calculated using 1-second bins in cleaned event files. If a bin has >2000 counts, and if more than 50% of those come from <1% of pixels, then it is considered to be noise-dominated and hence unusable.
| Quadrant | # 1 sec bins | Bins with >0 counts | Bins with >2000 counts | High rate bins dominated by noise | Noise dominated (total time) | Noise dominated (detector-on time) | Marked lightcurve |
|---|---|---|---|---|---|---|---|
| A | 7266 | 7021 | 2816 | 2816 | 38.76% | 40.11% | 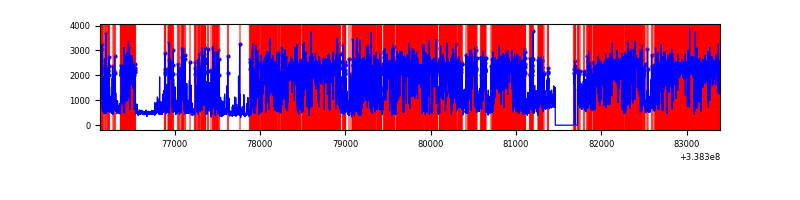 |
| B | 7267 | 7023 | 73 | 73 | 1.00% | 1.04% | 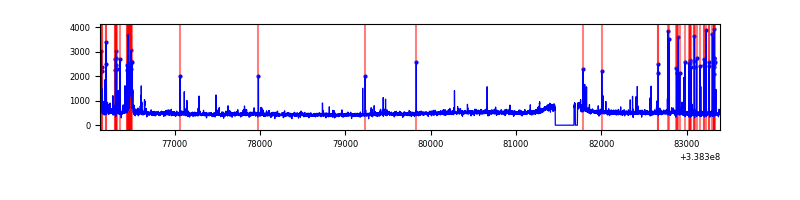 |
| C | 7266 | 7023 | 6 | 6 | 0.08% | 0.09% | 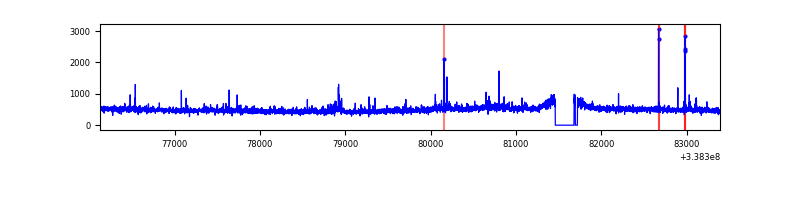 |
| D | 7266 | 7022 | 503 | 503 | 6.92% | 7.16% | 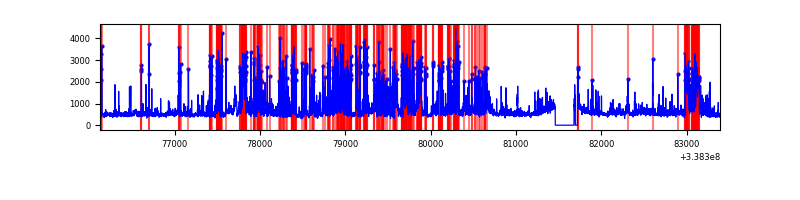 |
Top three noisy pixels from each quadrant. If the there are fewer than three noisy pixels in the level2.evt file, extra rows are filled as -1
| Pixel properties | Quadrant properties | ||||||
|---|---|---|---|---|---|---|---|
| Quadrant | DetID | PixID | Counts | Sigma | Mean | Median | Sigma |
| A | 14 | 235 | 8507611 | 65703.07 | 638 | 624 | 129.5 |
| A | 0 | 13 | 32483 | 246.06 | 638 | 624 | 129.5 |
| A | 8 | 192 | 27870 | 210.43 | 638 | 624 | 129.5 |
| B | 0 | 189 | 263226 | 1597.79 | 854 | 833 | 164.2 |
| B | 15 | 33 | 67191 | 404.07 | 854 | 833 | 164.2 |
| B | 0 | 219 | 32179 | 190.87 | 854 | 833 | 164.2 |
| C | 14 | 238 | 130883 | 668.68 | 829 | 835 | 194.5 |
| C | 2 | 16 | 105982 | 540.65 | 829 | 835 | 194.5 |
| C | 15 | 208 | 31041 | 155.31 | 829 | 835 | 194.5 |
| D | 1 | 52 | 1477972 | 7501.54 | 820 | 798 | 196.9 |
| D | 11 | 176 | 410471 | 2080.45 | 820 | 798 | 196.9 |
| D | 2 | 250 | 347777 | 1762.07 | 820 | 798 | 196.9 |
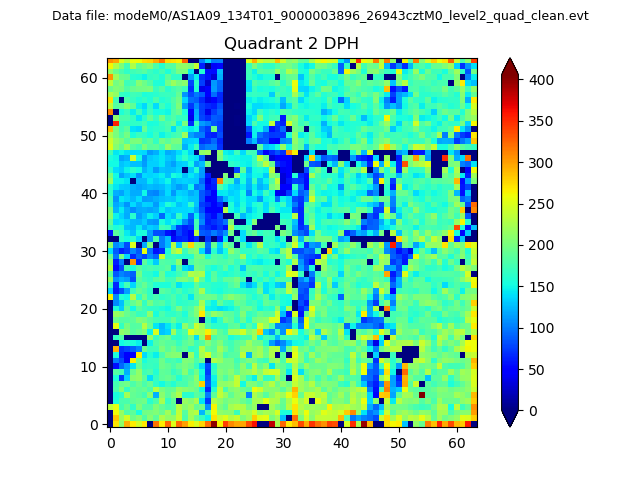
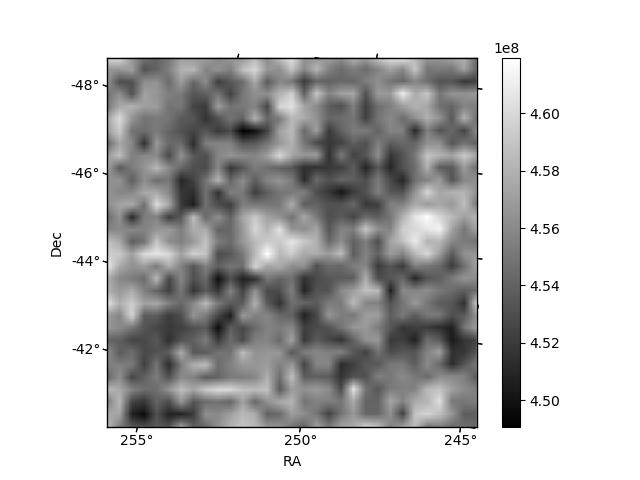
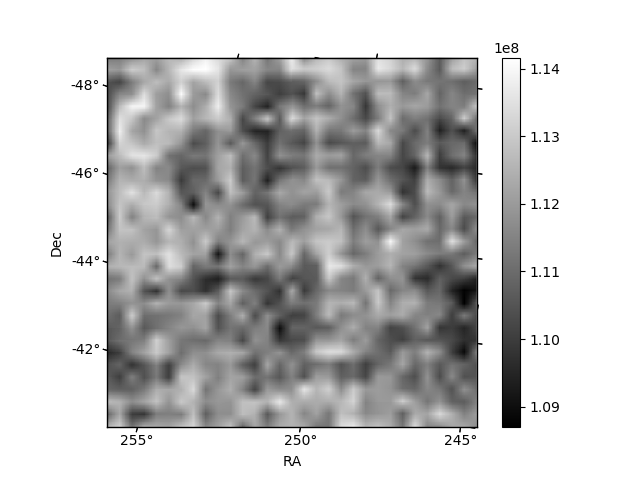
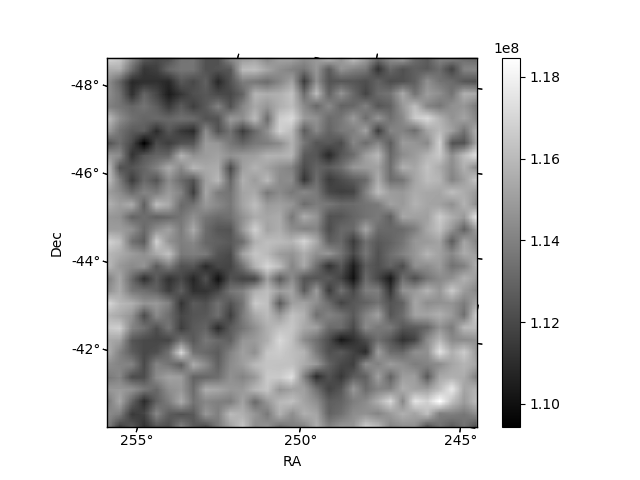
Histogram calculated using DETX and DETY for each event in the final _common_clean file
| Quadrant A | 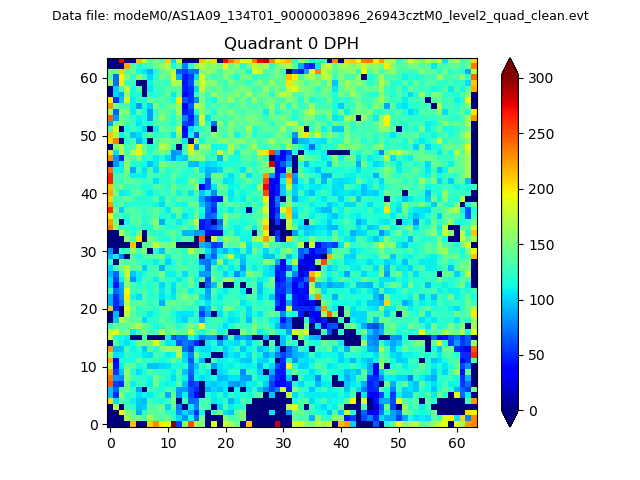 |
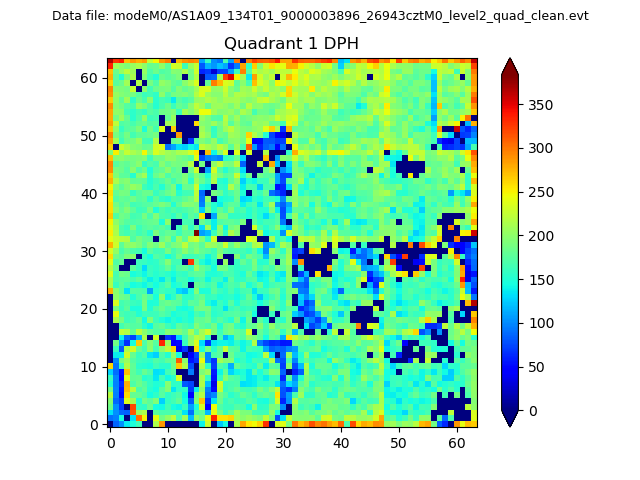 |
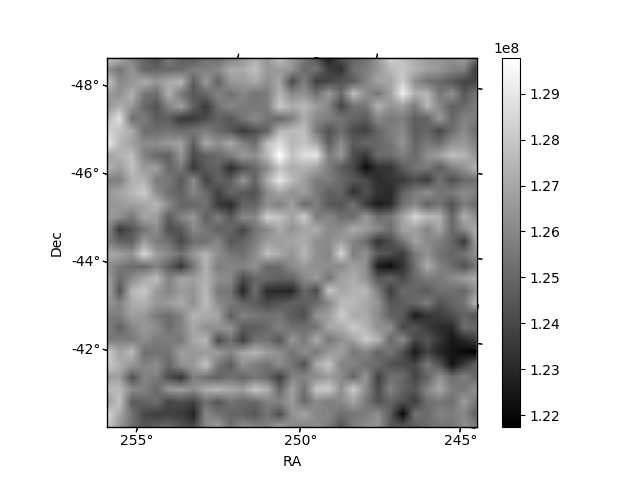
Quadrant B |
|---|---|---|---|
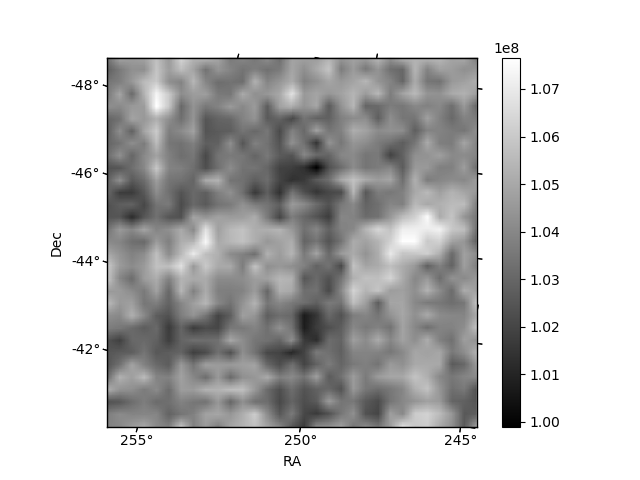
| Quadrant D | 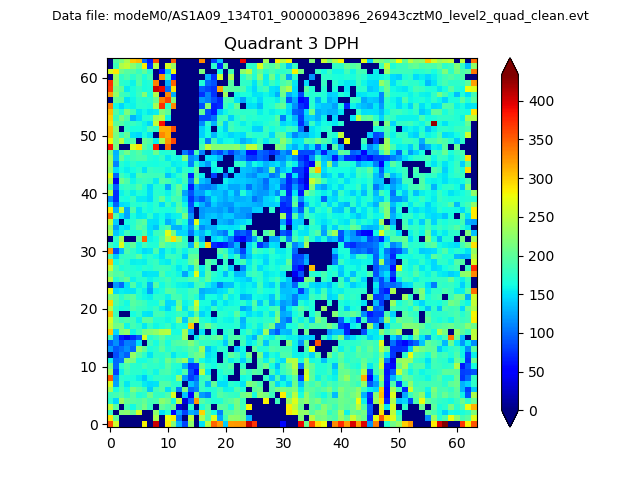 |
 |
Quadrant C |
| Plot type | Count rate plots | Images |
|---|---|---|
| Comparison with Poisson distribution Blue bars denote a histogram of data divided into 1 sec bins. Red curve is a Poisson curve with rate = median count rate of data. |
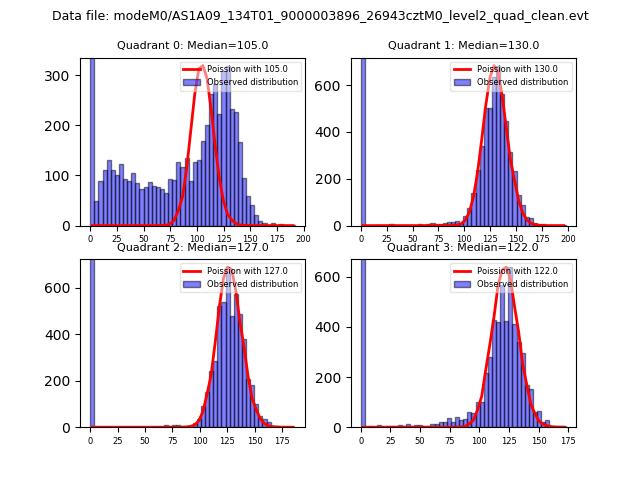 |
 |
| Quadrant-wise count rates Data is divided into 100 sec bins |
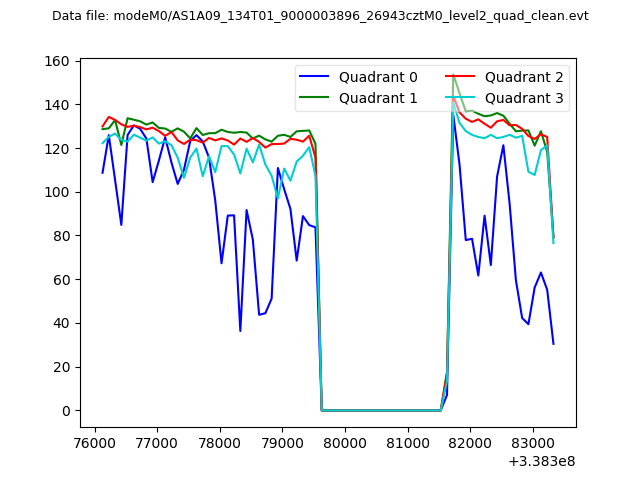 |
|
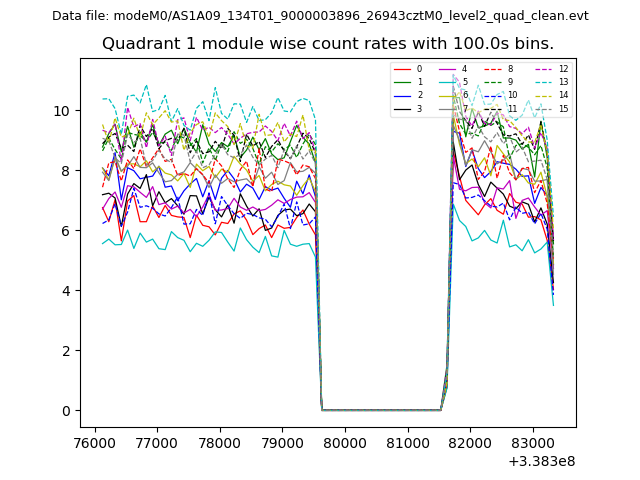
| Module-wise count rates for Quadrant A Data is divided into 100 sec bins |
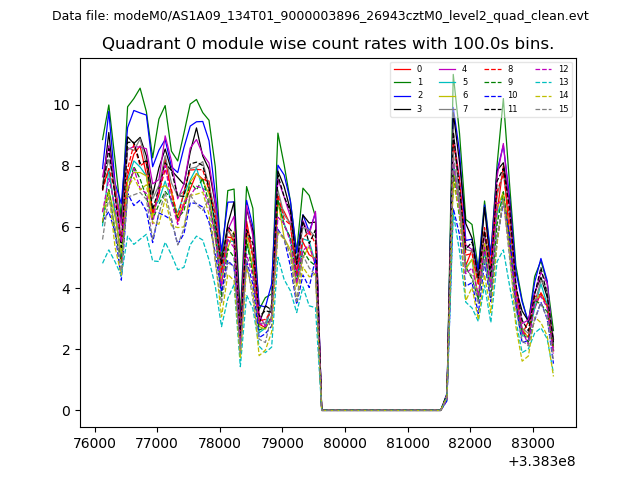 |
 |
| Module-wise count rates for Quadrant B Data is divided into 100 sec bins |
 |
 |
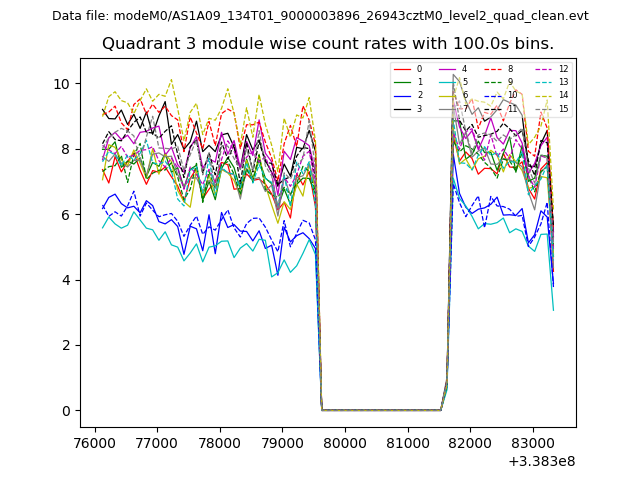
| Module-wise count rates for Quadrant C Data is divided into 100 sec bins |
 |
 |
| Module-wise count rates for Quadrant D Data is divided into 100 sec bins |
 |
 |
| Parameter | Plot |
|---|---|
| CZT HV Monitor | 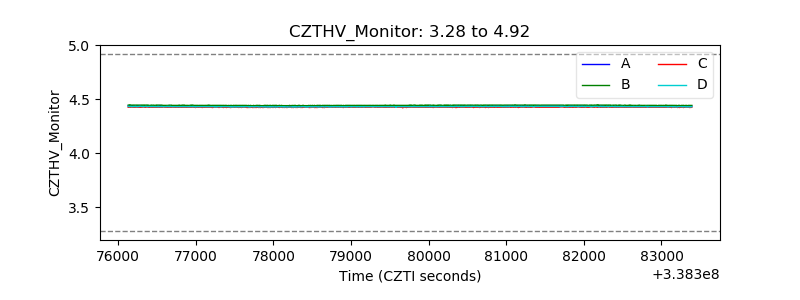 |
| D_VDD | 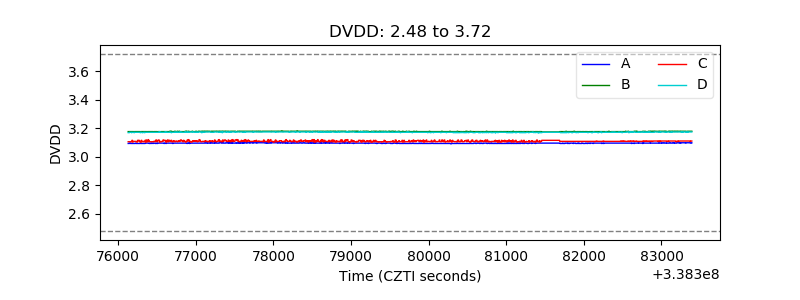 |
| Temperature 1 | 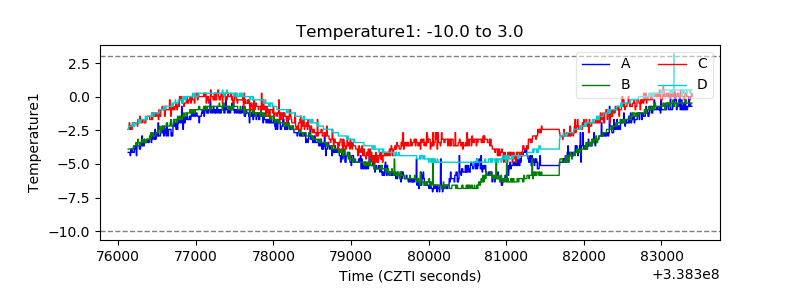 |
| Veto HV Monitor | 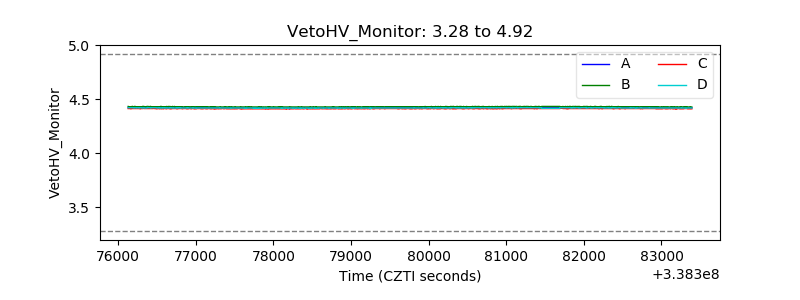 |
| Veto LLD | 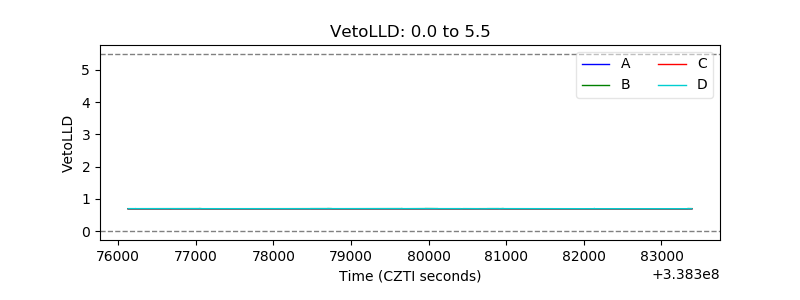 |
| Alpha Counter | 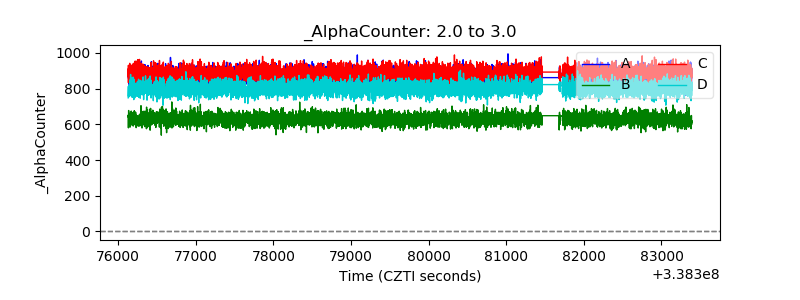 |
| _CPM_Rate | 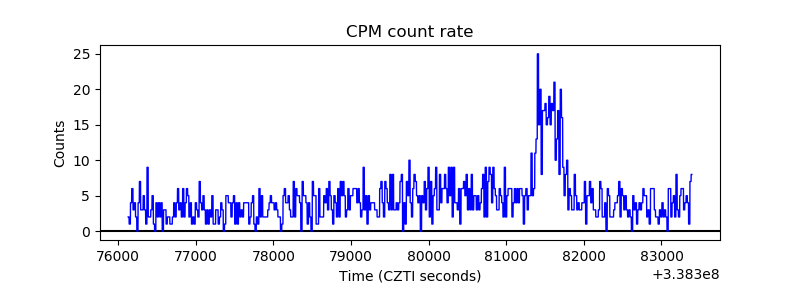 |
| CZT Counter | 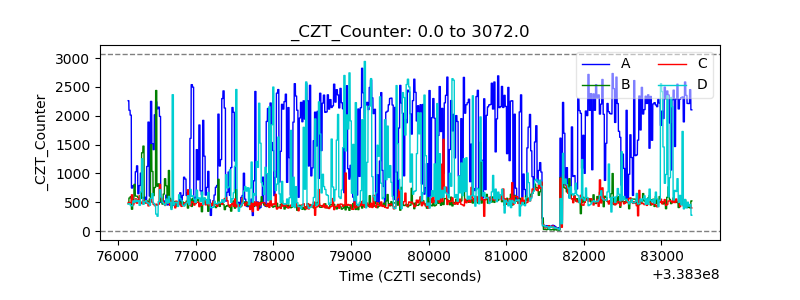 |
| +2.5 Volts monitor | 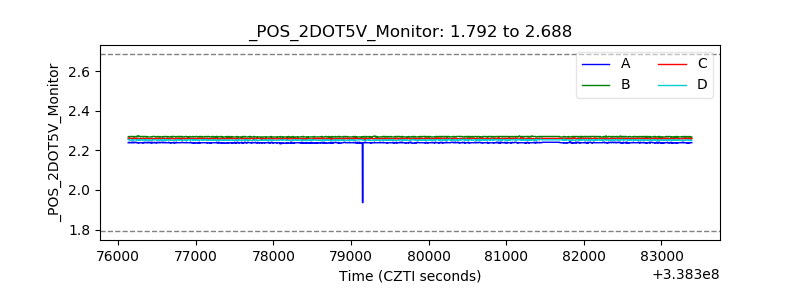 |
| +5 Volts monitor |  |
| _ROLL_ROT | 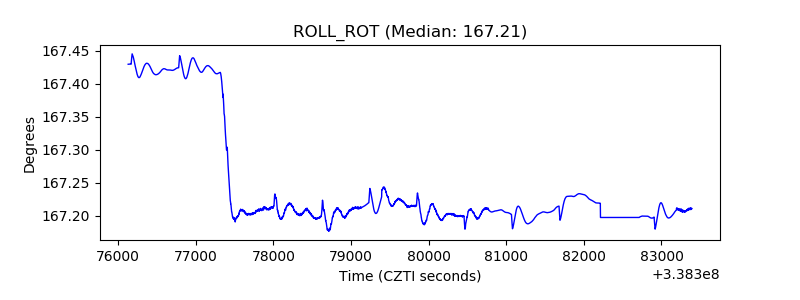 |
| _Roll_DEC | 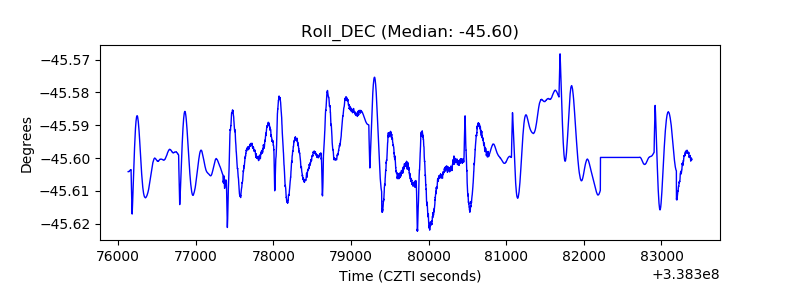 |
| _Roll_RA | 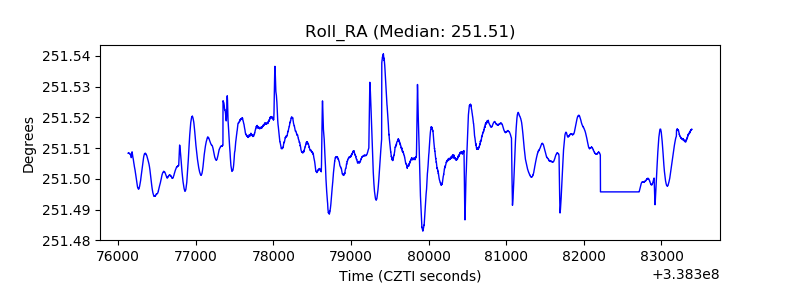 |
| Veto Counter | 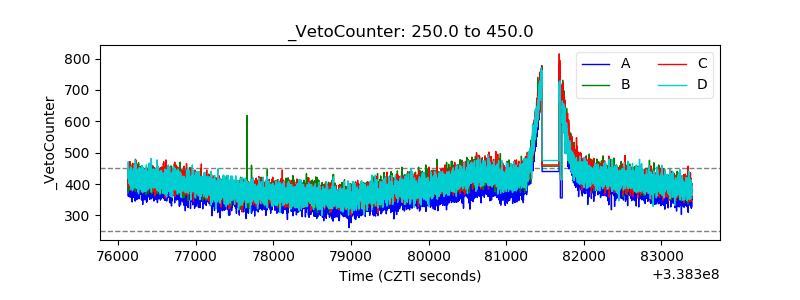 |