| Param | Original file | Final file |
|---|---|---|
| Filename | modeM0/AS1A09_134T01_9000003896_26946cztM0_level2.evt | modeM0/AS1A09_134T01_9000003896_26946cztM0_level2_quad_clean.evt |
| Size (bytes) | 2,355,756,480 | 205,188,480 |
| Size | 2.2 GB | 195.7 MB |
| Events in quadrant A | 28,884,517 | 956,266 |
| Events in quadrant B | 17,522,786 | 1,308,732 |
| Events in quadrant C | 8,469,630 | 1,432,452 |
| Events in quadrant D | 15,287,590 | 1,301,517 |
| Mode M9 | |||
|---|---|---|---|
| Quadrant | BADHDUFLAG | Total packets | Discarded packets |
| A | 0 | 19 | 0 |
| B | 0 | 19 | 0 |
| C | 0 | 19 | 0 |
| D | 0 | 19 | 0 |
| Mode M0 | |||
|---|---|---|---|
| Quadrant | BADHDUFLAG | Total packets | Discarded packets |
| A | 0 | 97795 | 0 |
| B | 0 | 63283 | 0 |
| C | 0 | 36688 | 0 |
| D | 0 | 57092 | 0 |
| Quadrant | Total seconds | Saturated seconds | Saturation percentage |
|---|---|---|---|
| A | 17566 | 9932 | 56.541045% |
| B | 17567 | 4107 | 23.379063% |
| C | 17567 | 221 | 1.258041% |
| D | 17567 | 1565 | 8.908749% |
Noise dominated data is calculated using 1-second bins in cleaned event files. If a bin has >2000 counts, and if more than 50% of those come from <1% of pixels, then it is considered to be noise-dominated and hence unusable.
| Quadrant | # 1 sec bins | Bins with >0 counts | Bins with >2000 counts | High rate bins dominated by noise | Noise dominated (total time) | Noise dominated (detector-on time) | Marked lightcurve |
|---|---|---|---|---|---|---|---|
| A | 19461 | 17566 | 7771 | 7771 | 39.93% | 44.24% | 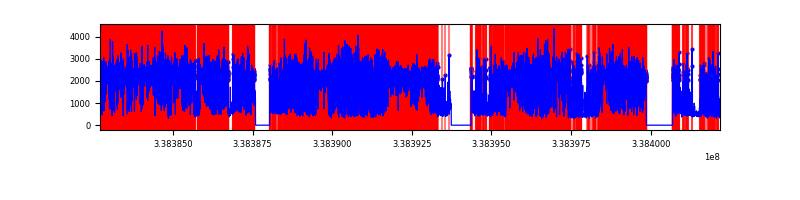 |
| B | 19462 | 17568 | 3357 | 3357 | 17.25% | 19.11% | 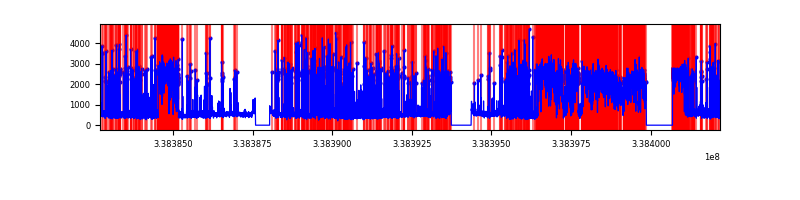 |
| C | 19462 | 17569 | 21 | 21 | 0.11% | 0.12% | 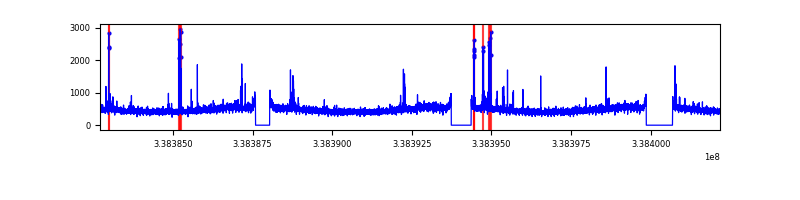 |
| D | 19462 | 17569 | 1477 | 1477 | 7.59% | 8.41% | 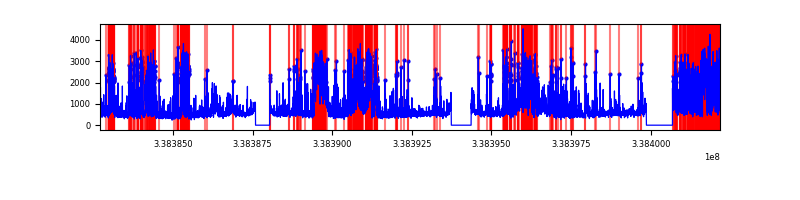 |
Top three noisy pixels from each quadrant. If the there are fewer than three noisy pixels in the level2.evt file, extra rows are filled as -1
| Pixel properties | Quadrant properties | ||||||
|---|---|---|---|---|---|---|---|
| Quadrant | DetID | PixID | Counts | Sigma | Mean | Median | Sigma |
| A | 14 | 235 | 23055291 | 78559.05 | 1463 | 1436 | 293.5 |
| A | 8 | 192 | 73397 | 245.22 | 1463 | 1436 | 293.5 |
| A | 5 | 168 | 46881 | 154.86 | 1463 | 1436 | 293.5 |
| B | 0 | 189 | 9255629 | 25084.76 | 1947 | 1898 | 368.9 |
| B | 10 | 245 | 311326 | 838.79 | 1947 | 1898 | 368.9 |
| B | 0 | 229 | 73246 | 193.41 | 1947 | 1898 | 368.9 |
| C | 14 | 238 | 321955 | 675.97 | 2029 | 2040 | 473.3 |
| C | 0 | 207 | 110326 | 228.8 | 2029 | 2040 | 473.3 |
| C | 15 | 208 | 94211 | 194.75 | 2029 | 2040 | 473.3 |
| D | 1 | 52 | 2699440 | 5670.64 | 1987 | 1936 | 475.7 |
| D | 2 | 250 | 1885494 | 3959.58 | 1987 | 1936 | 475.7 |
| D | 7 | 80 | 1837214 | 3858.08 | 1987 | 1936 | 475.7 |
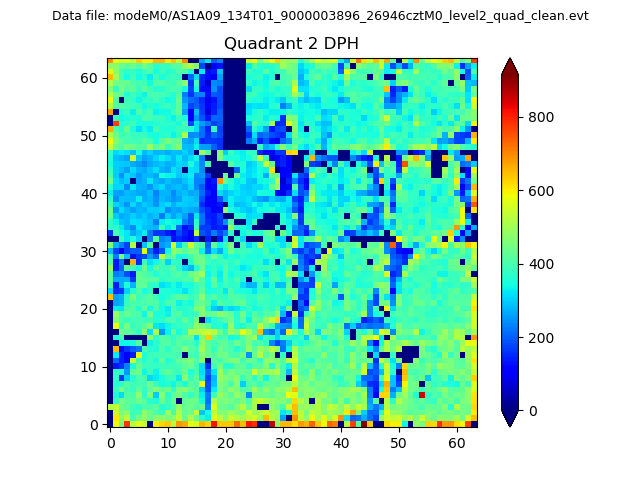
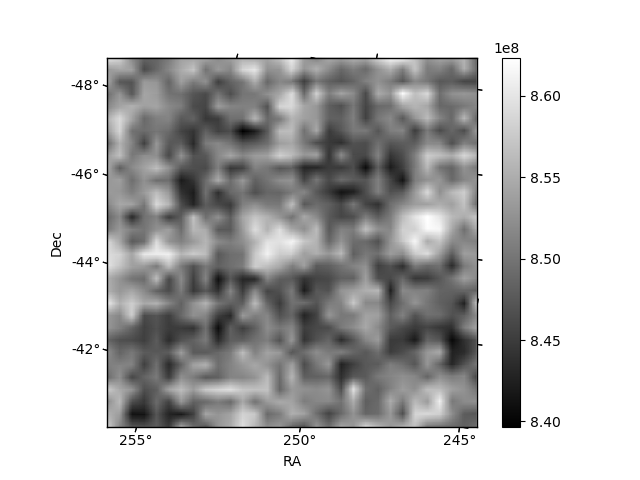
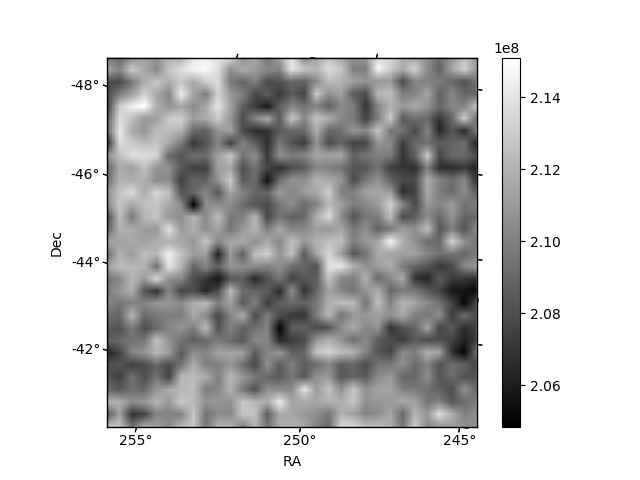
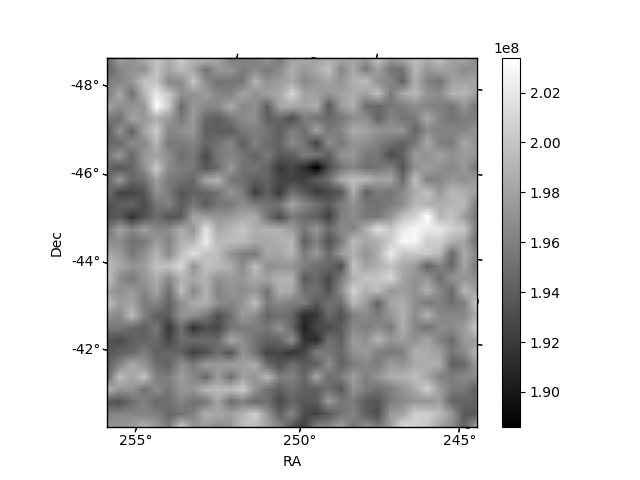
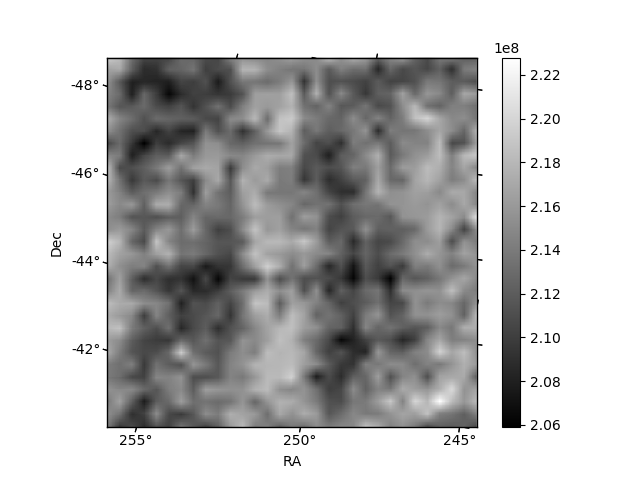
Histogram calculated using DETX and DETY for each event in the final _common_clean file
| Quadrant A | 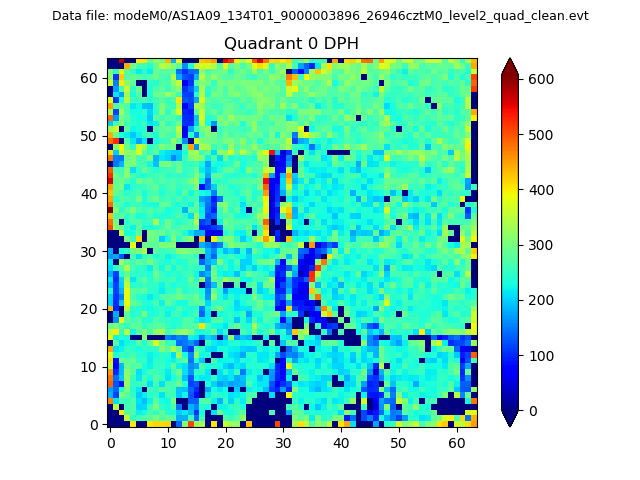 |
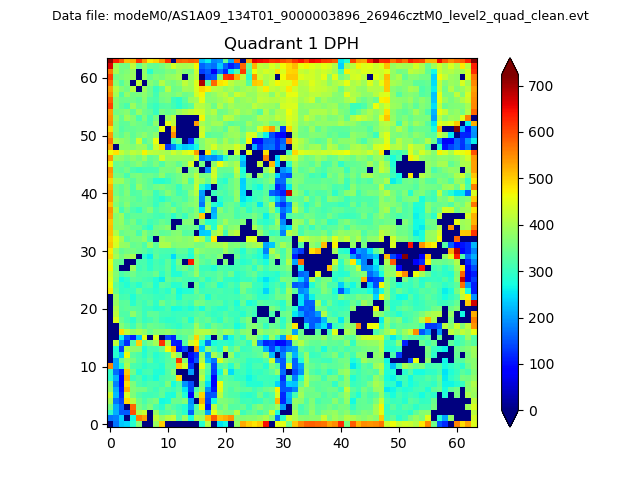 |
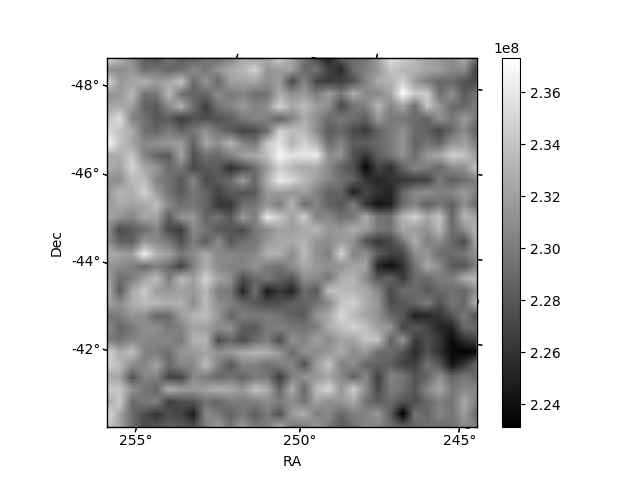
Quadrant B |
|---|---|---|---|
| Quadrant D | 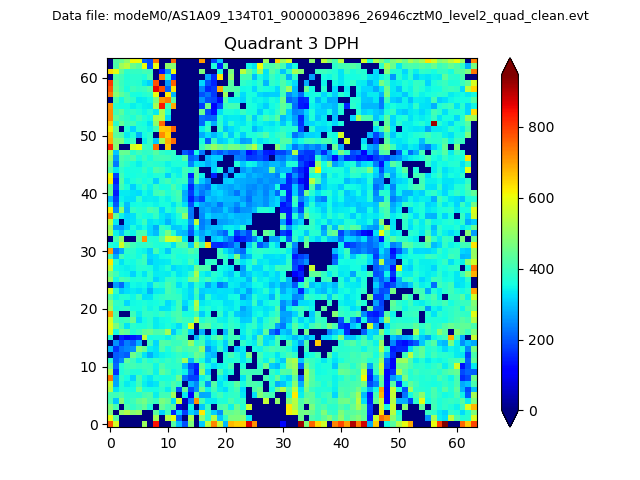 |
 |
Quadrant C |
| Plot type | Count rate plots | Images |
|---|---|---|
| Comparison with Poisson distribution Blue bars denote a histogram of data divided into 1 sec bins. Red curve is a Poisson curve with rate = median count rate of data. |
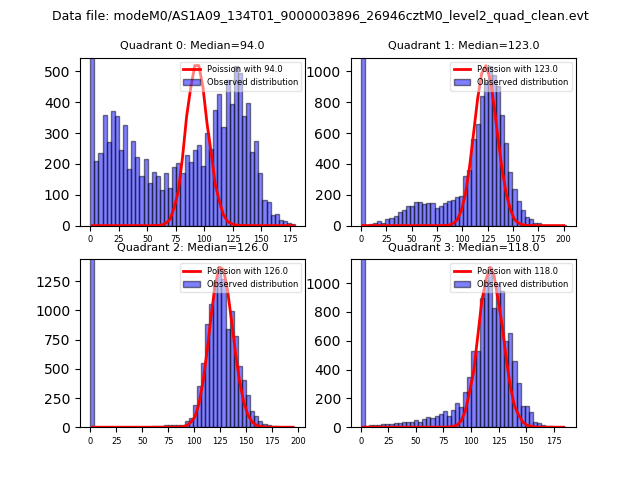 |
 |
| Quadrant-wise count rates Data is divided into 100 sec bins |
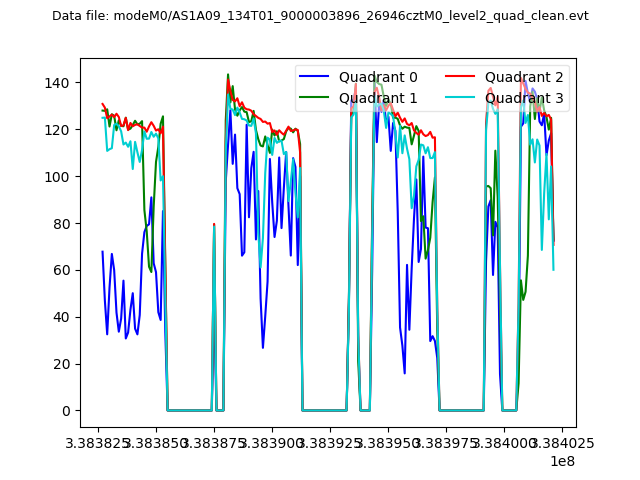 |
|
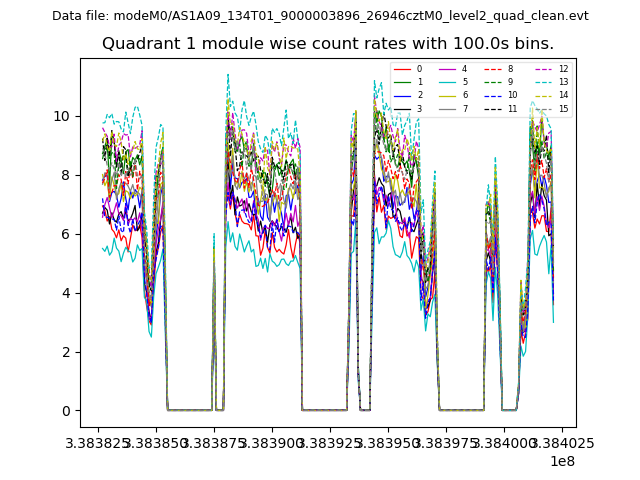
| Module-wise count rates for Quadrant A Data is divided into 100 sec bins |
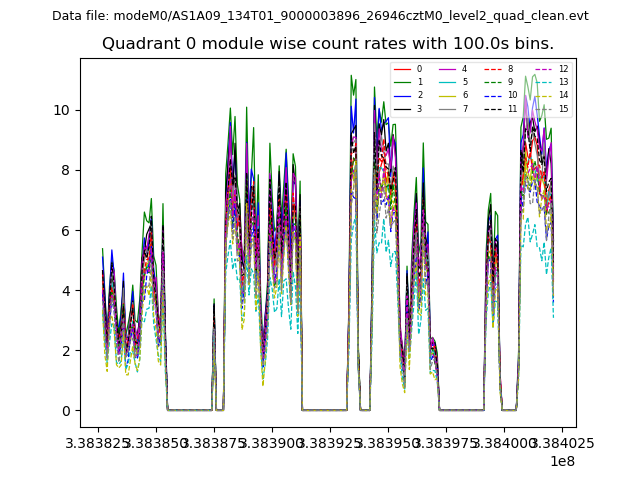 |
 |
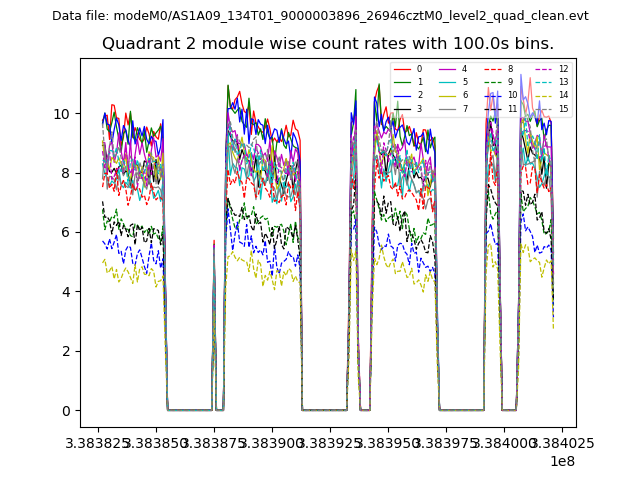
| Module-wise count rates for Quadrant B Data is divided into 100 sec bins |
 |
 |
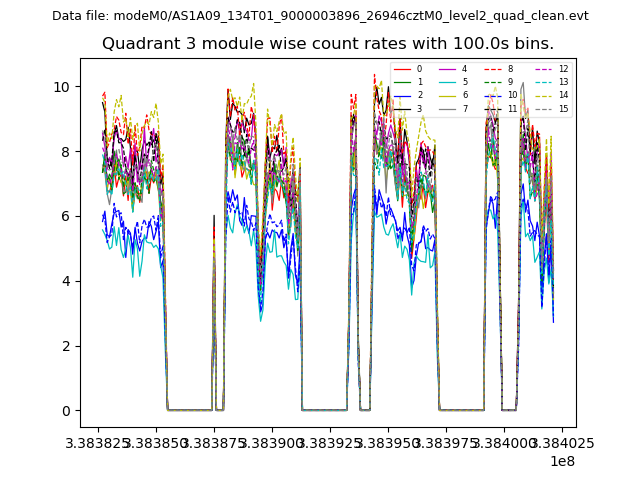
| Module-wise count rates for Quadrant C Data is divided into 100 sec bins |
 |
 |
| Module-wise count rates for Quadrant D Data is divided into 100 sec bins |
 |
 |
| Parameter | Plot |
|---|---|
| CZT HV Monitor | 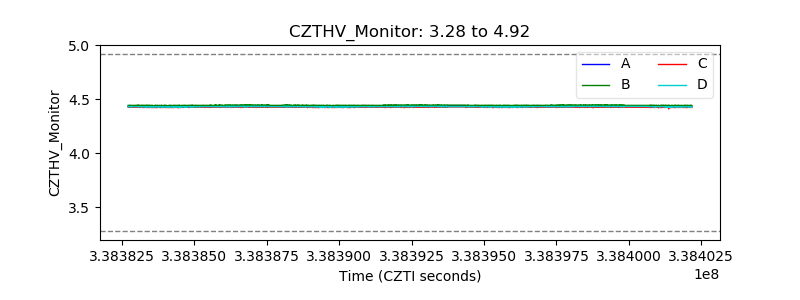 |
| D_VDD | 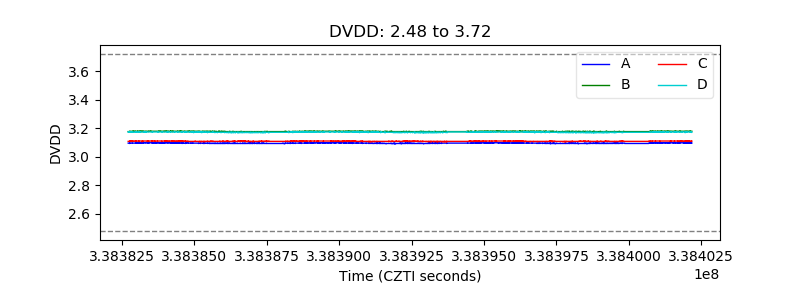 |
| Temperature 1 | 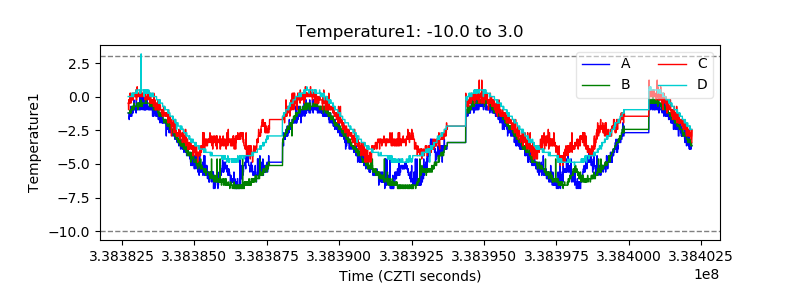 |
| Veto HV Monitor | 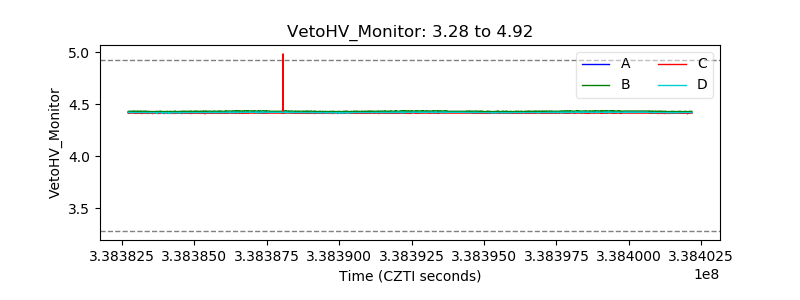 |
| Veto LLD | 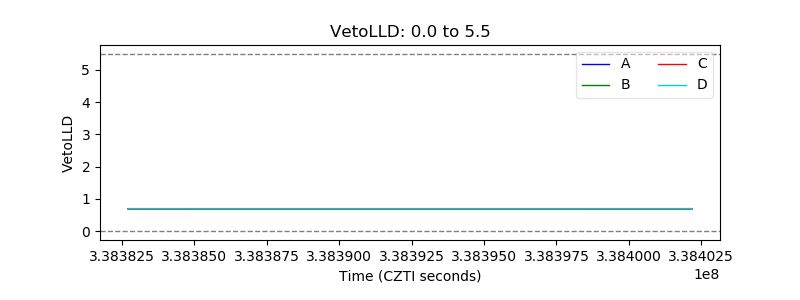 |
| Alpha Counter | 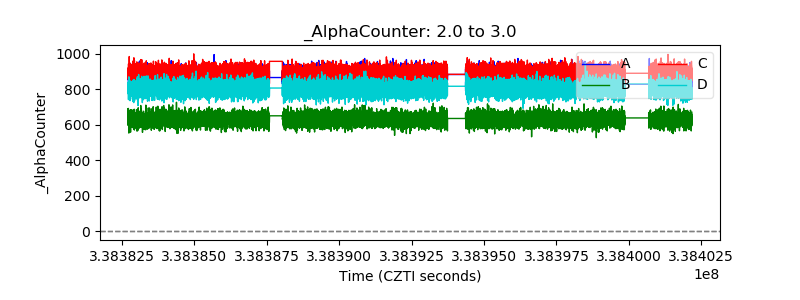 |
| _CPM_Rate | 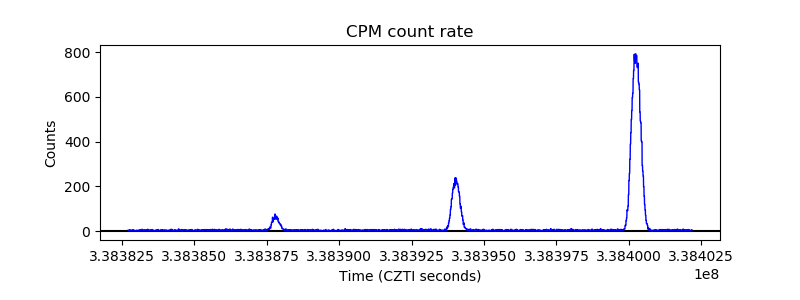 |
| CZT Counter | 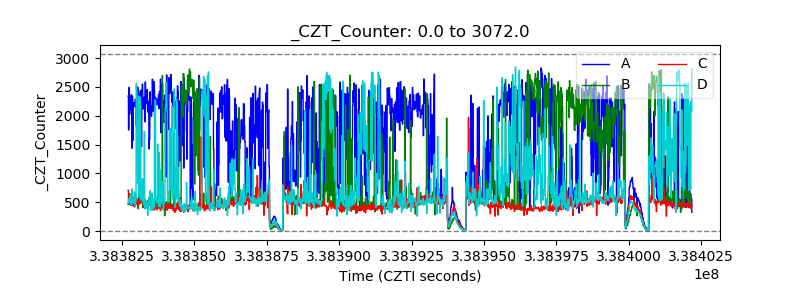 |
| +2.5 Volts monitor | 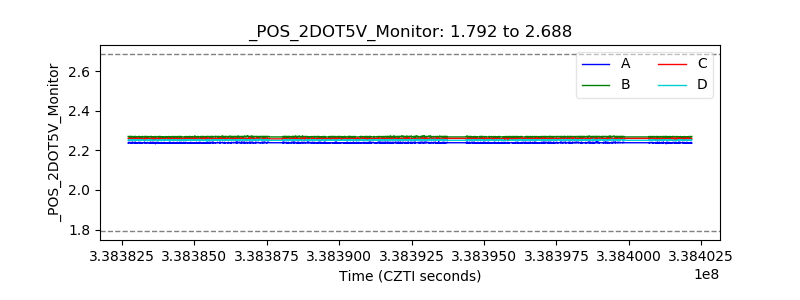 |
| +5 Volts monitor |  |
| _ROLL_ROT | 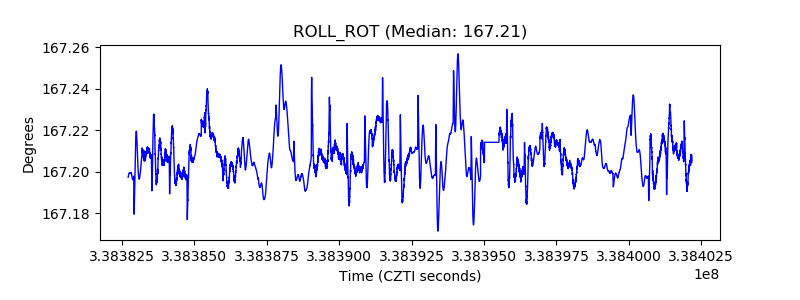 |
| _Roll_DEC | 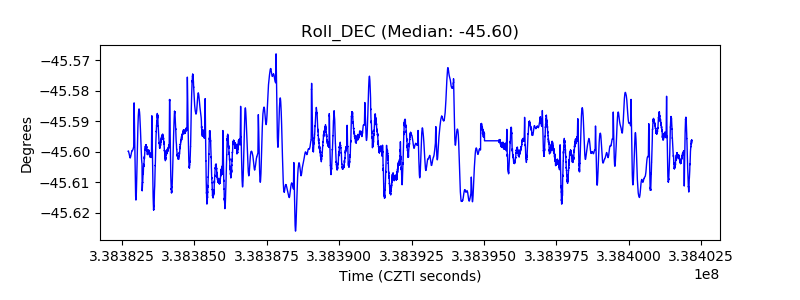 |
| _Roll_RA | 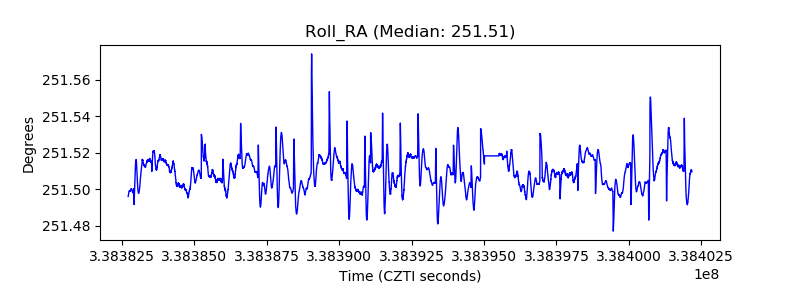 |
| Veto Counter | 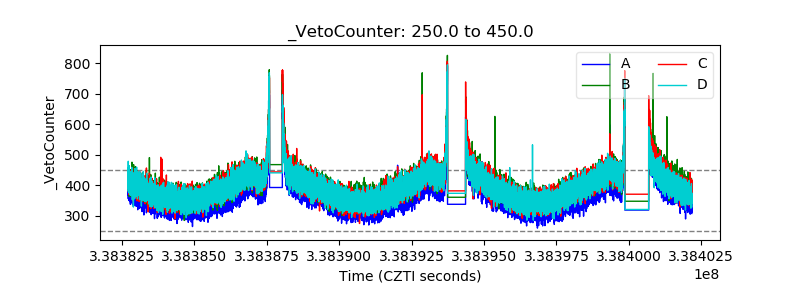 |