| Param | Original file | Final file |
|---|---|---|
| Filename | modeM0/AS1A09_134T01_9000003896_26947cztM0_level2.evt | modeM0/AS1A09_134T01_9000003896_26947cztM0_level2_quad_clean.evt |
| Size (bytes) | 859,593,600 | 77,169,600 |
| Size | 819.8 MB | 73.6 MB |
| Events in quadrant A | 6,248,871 | 494,499 |
| Events in quadrant B | 9,593,403 | 417,323 |
| Events in quadrant C | 2,945,383 | 536,967 |
| Events in quadrant D | 6,828,434 | 454,976 |
| Mode M9 | |||
|---|---|---|---|
| Quadrant | BADHDUFLAG | Total packets | Discarded packets |
| A | 0 | 9 | 0 |
| B | 0 | 9 | 0 |
| C | 0 | 9 | 0 |
| D | 0 | 9 | 0 |
| Mode M0 | |||
|---|---|---|---|
| Quadrant | BADHDUFLAG | Total packets | Discarded packets |
| A | 0 | 22832 | 0 |
| B | 0 | 32685 | 0 |
| C | 0 | 12729 | 0 |
| D | 0 | 24424 | 0 |
| Quadrant | Total seconds | Saturated seconds | Saturation percentage |
|---|---|---|---|
| A | 6168 | 1338 | 21.692607% |
| B | 6168 | 2926 | 47.438392% |
| C | 6168 | 47 | 0.761997% |
| D | 6168 | 1064 | 17.250324% |
Noise dominated data is calculated using 1-second bins in cleaned event files. If a bin has >2000 counts, and if more than 50% of those come from <1% of pixels, then it is considered to be noise-dominated and hence unusable.
| Quadrant | # 1 sec bins | Bins with >0 counts | Bins with >2000 counts | High rate bins dominated by noise | Noise dominated (total time) | Noise dominated (detector-on time) | Marked lightcurve |
|---|---|---|---|---|---|---|---|
| A | 7143 | 6168 | 988 | 988 | 13.83% | 16.02% | 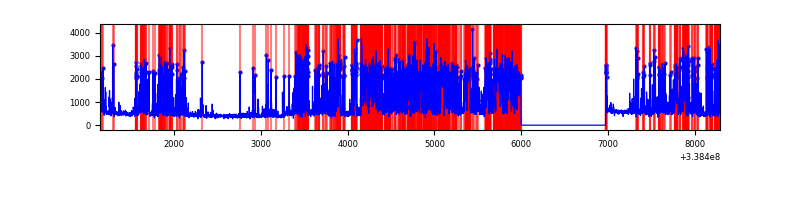 |
| B | 7143 | 6168 | 2408 | 2408 | 33.71% | 39.04% | 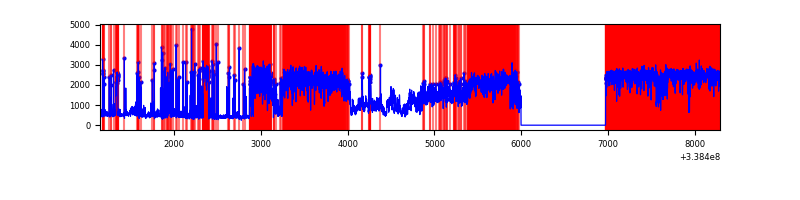 |
| C | 7143 | 6169 | 4 | 4 | 0.06% | 0.06% | 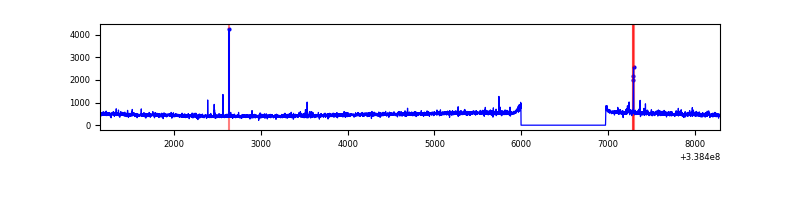 |
| D | 7143 | 6169 | 1040 | 1040 | 14.56% | 16.86% | 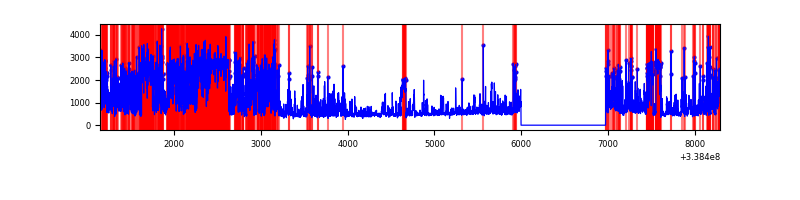 |
Top three noisy pixels from each quadrant. If the there are fewer than three noisy pixels in the level2.evt file, extra rows are filled as -1
| Pixel properties | Quadrant properties | ||||||
|---|---|---|---|---|---|---|---|
| Quadrant | DetID | PixID | Counts | Sigma | Mean | Median | Sigma |
| A | 14 | 235 | 3595679 | 26813.16 | 666 | 654 | 134.1 |
| A | 6 | 16 | 53570 | 394.67 | 666 | 654 | 134.1 |
| A | 8 | 192 | 23241 | 168.46 | 666 | 654 | 134.1 |
| B | 0 | 189 | 6835109 | 57923.5 | 623 | 608 | 118.0 |
| B | 10 | 245 | 212120 | 1792.6 | 623 | 608 | 118.0 |
| B | 3 | 112 | 35973 | 299.72 | 623 | 608 | 118.0 |
| C | 14 | 238 | 113888 | 678.27 | 710 | 716 | 166.9 |
| C | 2 | 16 | 31477 | 184.36 | 710 | 716 | 166.9 |
| C | 0 | 207 | 16778 | 96.26 | 710 | 716 | 166.9 |
| D | 1 | 52 | 2142690 | 13378.49 | 666 | 649 | 160.1 |
| D | 7 | 80 | 1055994 | 6591.34 | 666 | 649 | 160.1 |
| D | 11 | 176 | 489544 | 3053.48 | 666 | 649 | 160.1 |
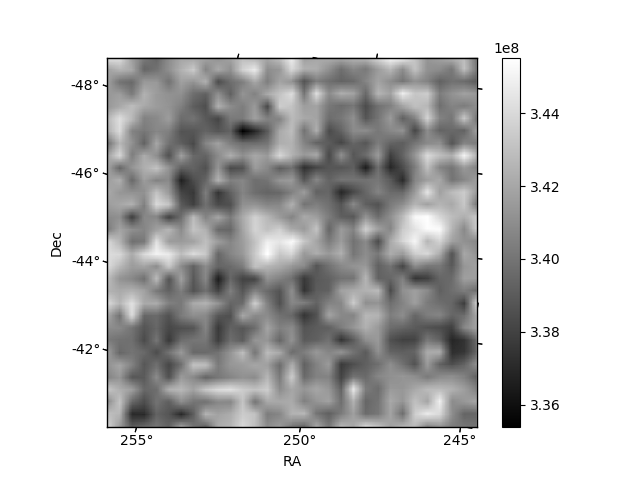
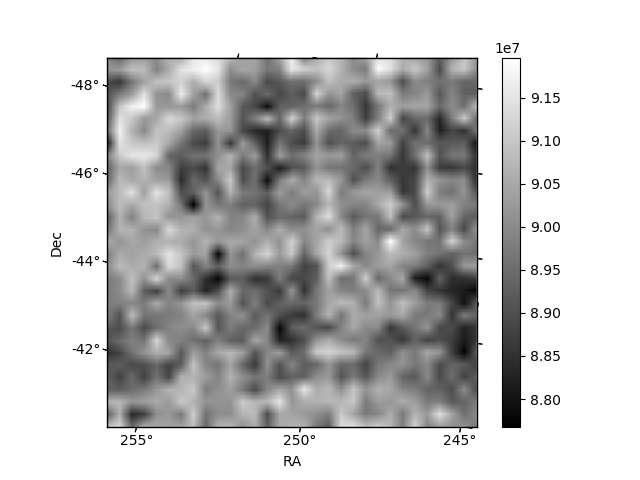
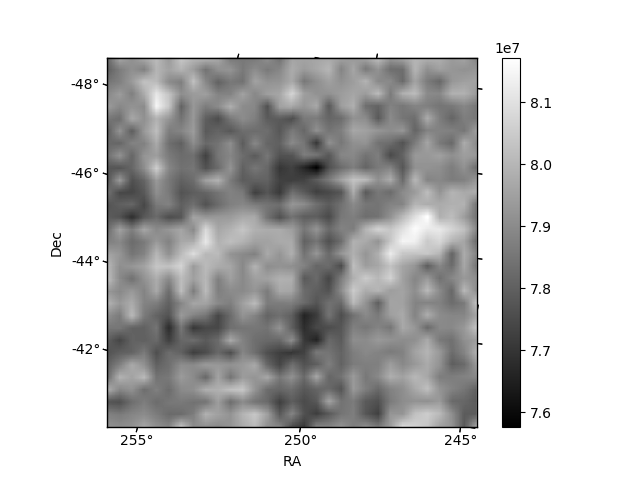
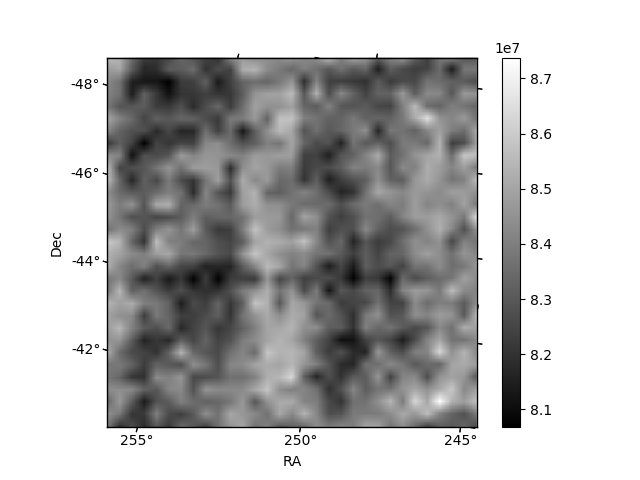
Histogram calculated using DETX and DETY for each event in the final _common_clean file
| Quadrant A | 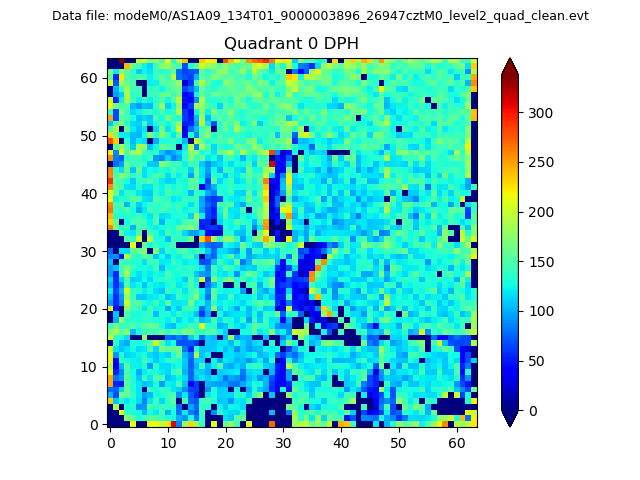 |
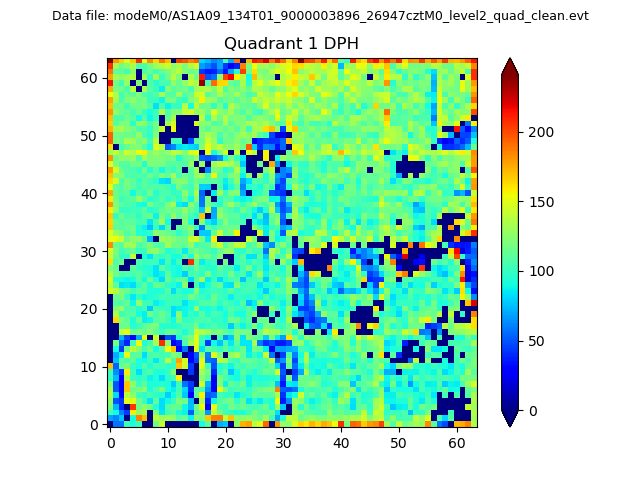 |
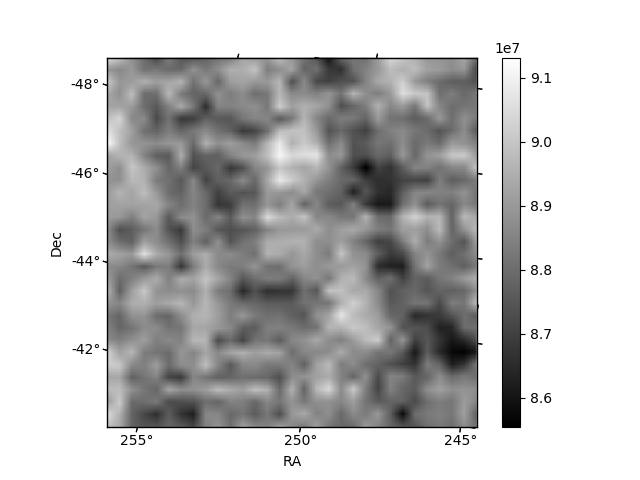
Quadrant B |
|---|---|---|---|
| Quadrant D | 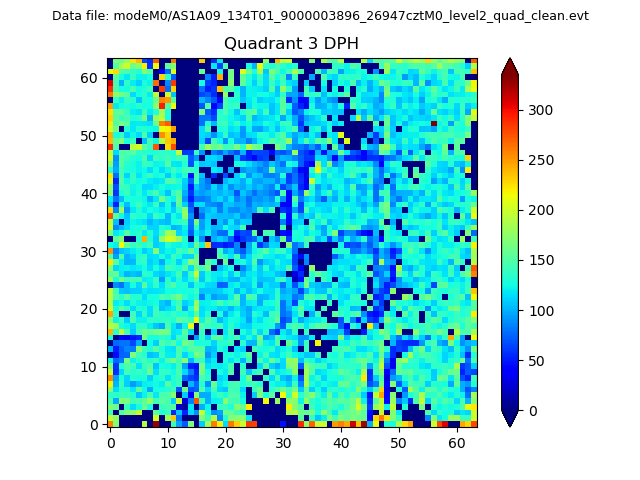 |
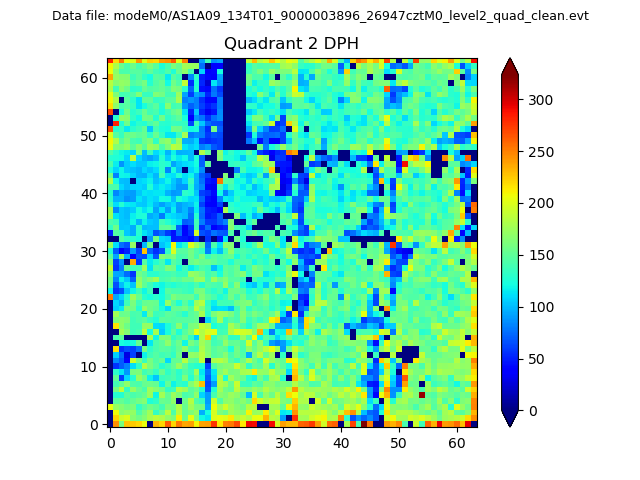 |
Quadrant C |
| Plot type | Count rate plots | Images |
|---|---|---|
| Comparison with Poisson distribution Blue bars denote a histogram of data divided into 1 sec bins. Red curve is a Poisson curve with rate = median count rate of data. |
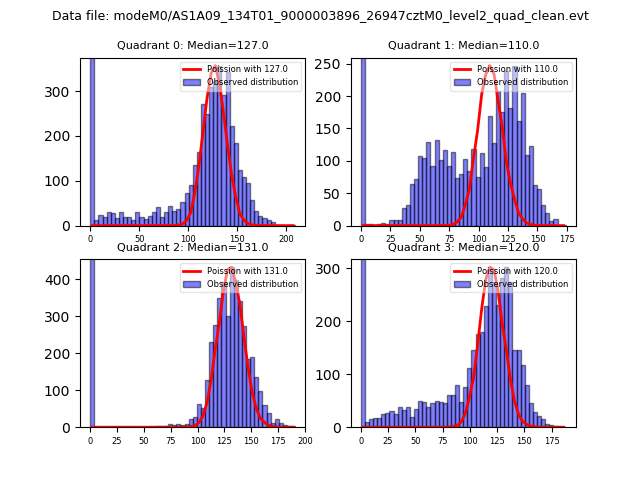 |
 |
| Quadrant-wise count rates Data is divided into 100 sec bins |
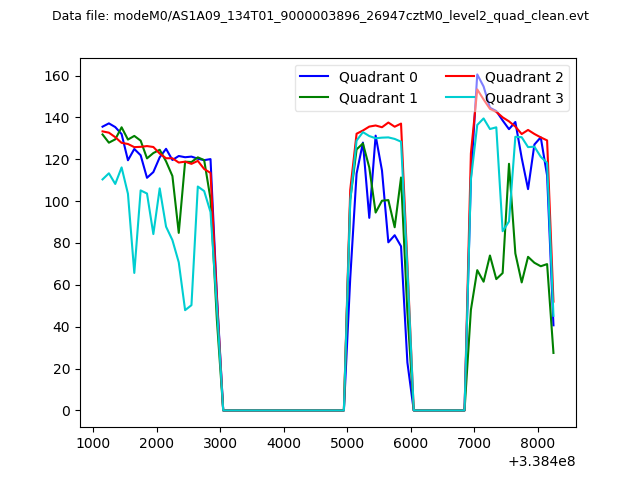 |
|
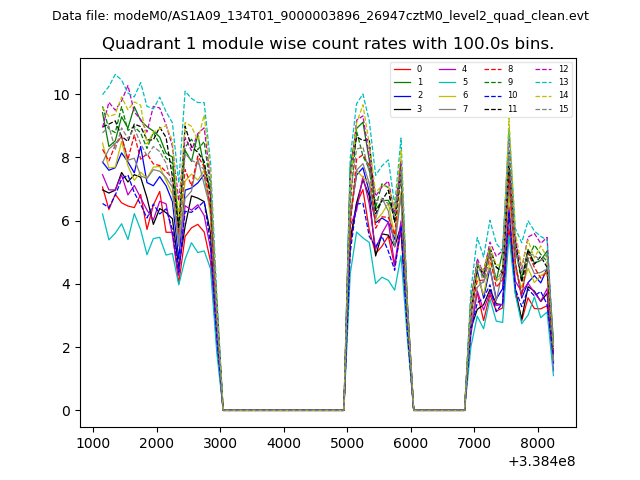
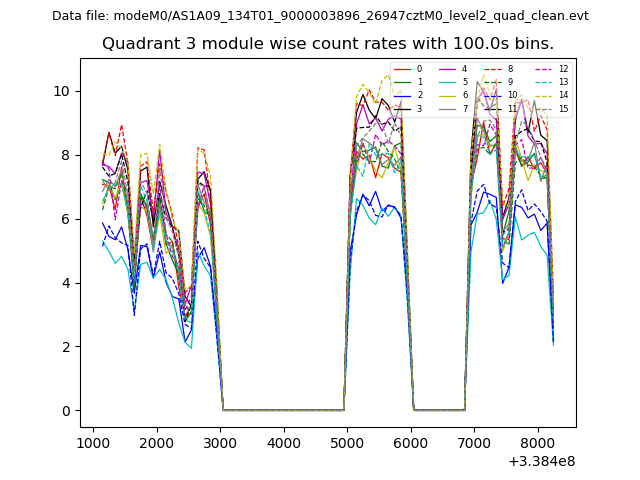
| Module-wise count rates for Quadrant A Data is divided into 100 sec bins |
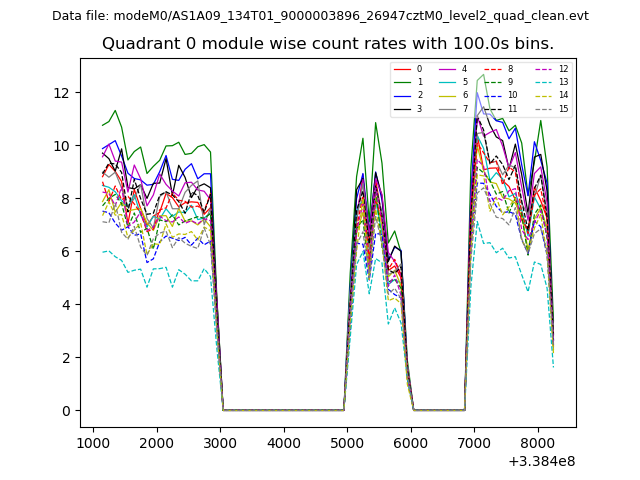 |
 |
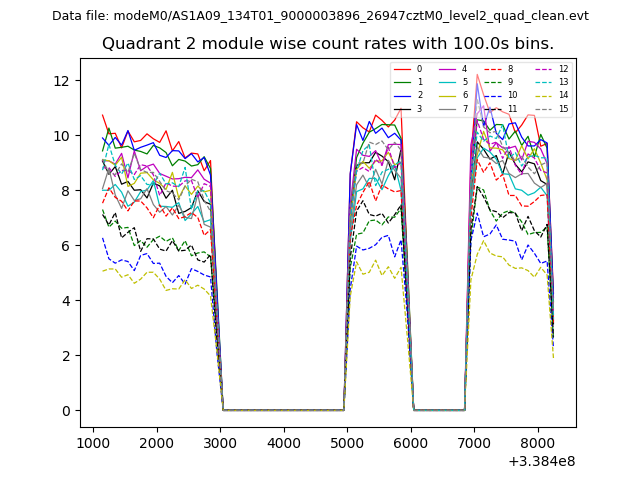
| Module-wise count rates for Quadrant B Data is divided into 100 sec bins |
 |
 |
| Module-wise count rates for Quadrant C Data is divided into 100 sec bins |
 |
 |
| Module-wise count rates for Quadrant D Data is divided into 100 sec bins |
 |
 |
| Parameter | Plot |
|---|---|
| CZT HV Monitor | 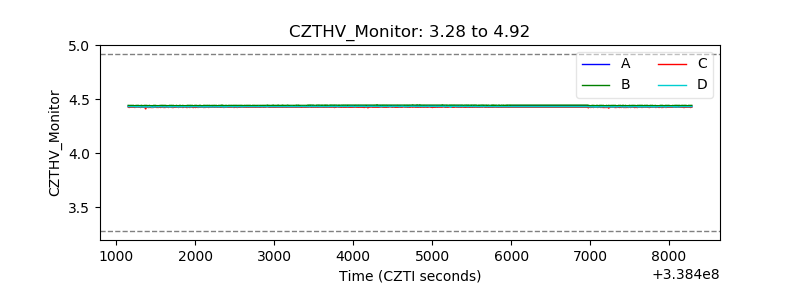 |
| D_VDD | 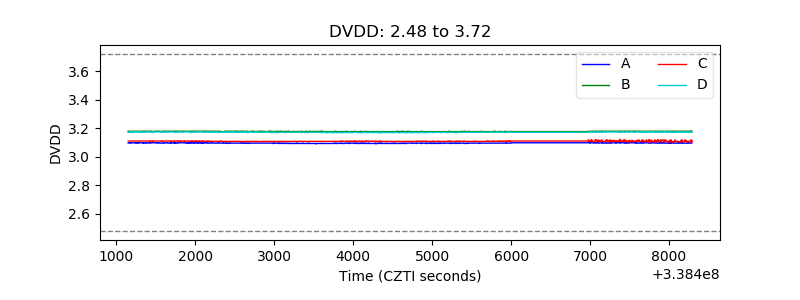 |
| Temperature 1 | 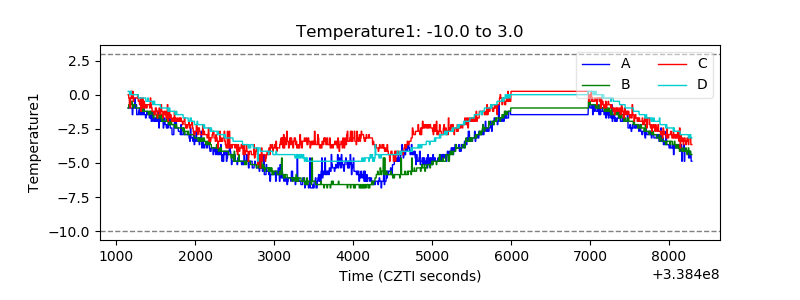 |
| Veto HV Monitor | 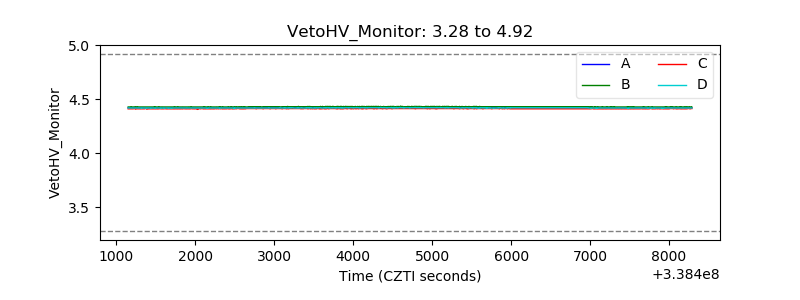 |
| Veto LLD | 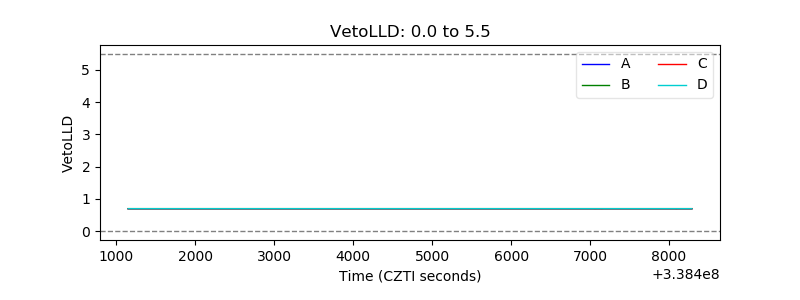 |
| Alpha Counter | 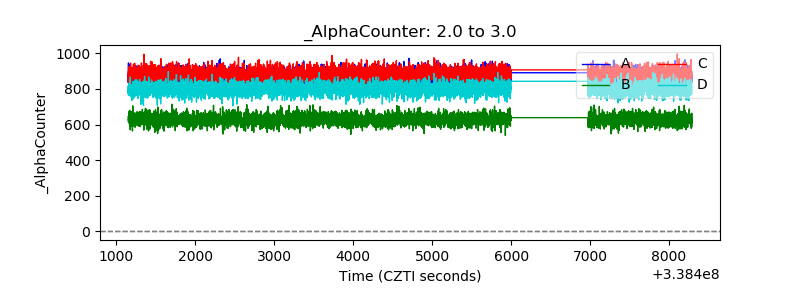 |
| _CPM_Rate | 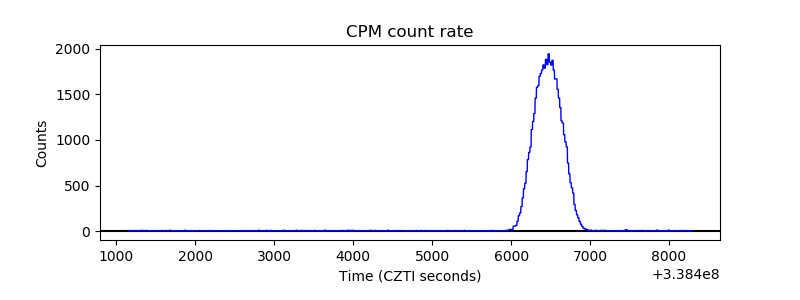 |
| CZT Counter | 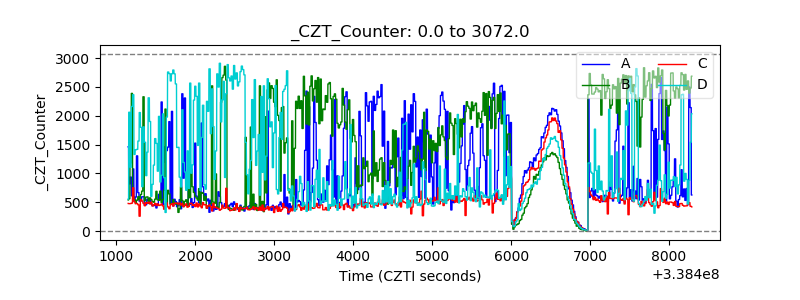 |
| +2.5 Volts monitor |  |
| +5 Volts monitor |  |
| _ROLL_ROT |  |
| _Roll_DEC | 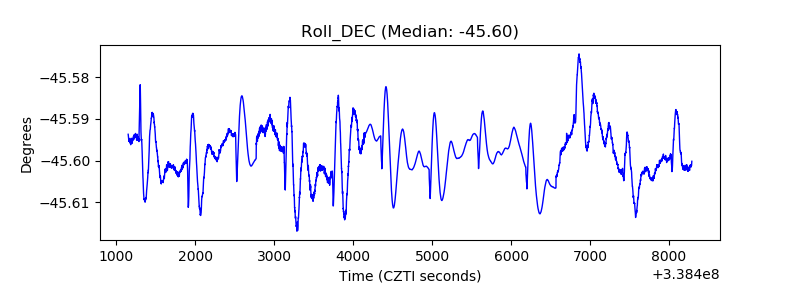 |
| _Roll_RA | 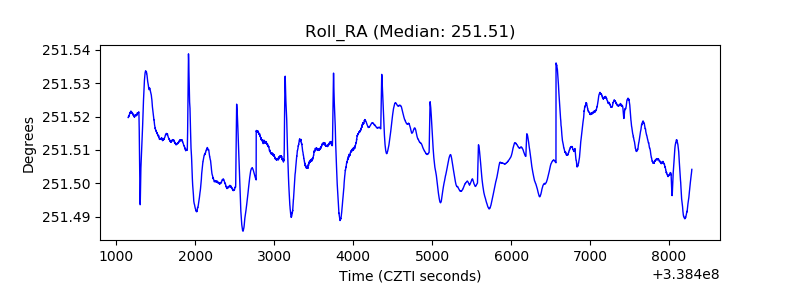 |
| Veto Counter |  |