| Param | Original file | Final file |
|---|---|---|
| Filename | modeM0/AS1A09_134T01_9000003896_26949cztM0_level2.evt | modeM0/AS1A09_134T01_9000003896_26949cztM0_level2_quad_clean.evt |
| Size (bytes) | 972,351,360 | 82,843,200 |
| Size | 927.3 MB | 79.0 MB |
| Events in quadrant A | 5,850,105 | 567,003 |
| Events in quadrant B | 10,908,061 | 467,708 |
| Events in quadrant C | 3,265,695 | 588,675 |
| Events in quadrant D | 9,000,278 | 443,866 |
| Mode M9 | |||
|---|---|---|---|
| Quadrant | BADHDUFLAG | Total packets | Discarded packets |
| A | 0 | 11 | 0 |
| B | 0 | 11 | 0 |
| C | 0 | 11 | 0 |
| D | 0 | 11 | 0 |
| Mode M0 | |||
|---|---|---|---|
| Quadrant | BADHDUFLAG | Total packets | Discarded packets |
| A | 0 | 21377 | 0 |
| B | 0 | 36675 | 0 |
| C | 0 | 13589 | 0 |
| D | 0 | 31094 | 0 |
| Quadrant | Total seconds | Saturated seconds | Saturation percentage |
|---|---|---|---|
| A | 6297 | 1024 | 16.261712% |
| B | 6297 | 3098 | 49.198031% |
| C | 6298 | 93 | 1.476659% |
| D | 6298 | 2165 | 34.375992% |
Noise dominated data is calculated using 1-second bins in cleaned event files. If a bin has >2000 counts, and if more than 50% of those come from <1% of pixels, then it is considered to be noise-dominated and hence unusable.
| Quadrant | # 1 sec bins | Bins with >0 counts | Bins with >2000 counts | High rate bins dominated by noise | Noise dominated (total time) | Noise dominated (detector-on time) | Marked lightcurve |
|---|---|---|---|---|---|---|---|
| A | 7407 | 6298 | 813 | 813 | 10.98% | 12.91% | 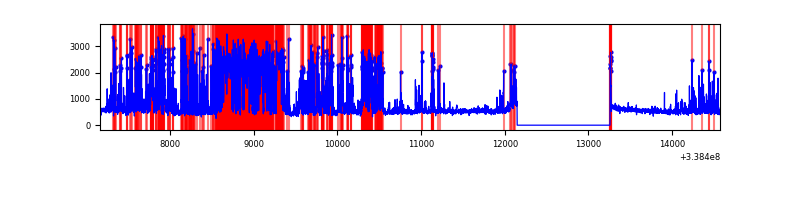 |
| B | 7407 | 6297 | 2569 | 2569 | 34.68% | 40.80% | 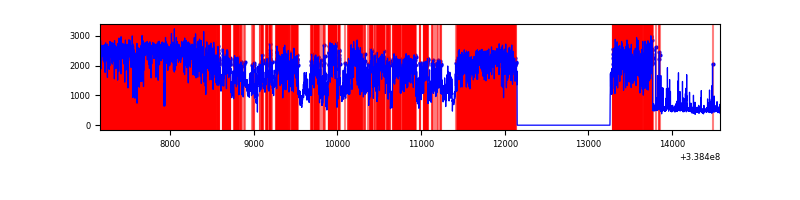 |
| C | 7408 | 6298 | 25 | 25 | 0.34% | 0.40% | 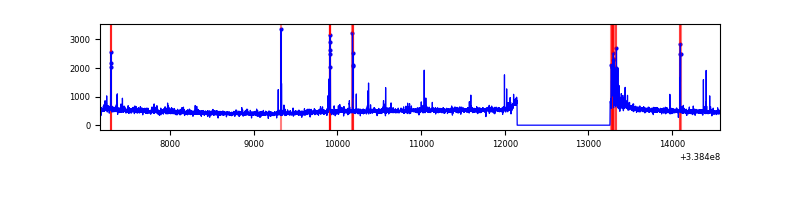 |
| D | 7408 | 6298 | 2052 | 2052 | 27.70% | 32.58% | 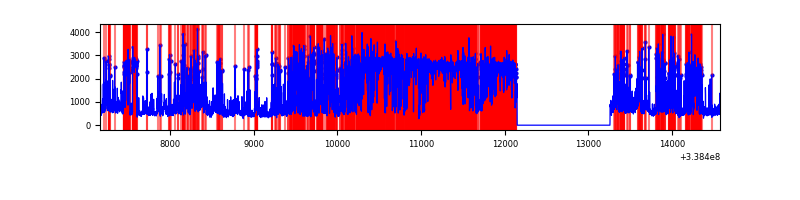 |
Top three noisy pixels from each quadrant. If the there are fewer than three noisy pixels in the level2.evt file, extra rows are filled as -1
| Pixel properties | Quadrant properties | ||||||
|---|---|---|---|---|---|---|---|
| Quadrant | DetID | PixID | Counts | Sigma | Mean | Median | Sigma |
| A | 14 | 235 | 3015067 | 20599.28 | 722 | 708 | 146.3 |
| A | 8 | 192 | 25377 | 168.58 | 722 | 708 | 146.3 |
| A | 5 | 168 | 13266 | 85.82 | 722 | 708 | 146.3 |
| B | 0 | 189 | 8005150 | 63979.61 | 667 | 651 | 125.1 |
| B | 3 | 112 | 128369 | 1020.84 | 667 | 651 | 125.1 |
| B | 10 | 245 | 102108 | 810.94 | 667 | 651 | 125.1 |
| C | 2 | 16 | 124860 | 715.28 | 745 | 749 | 173.5 |
| C | 14 | 238 | 118903 | 680.95 | 745 | 749 | 173.5 |
| C | 15 | 208 | 87892 | 502.22 | 745 | 749 | 173.5 |
| D | 12 | 1 | 2554050 | 18033.55 | 593 | 578 | 141.6 |
| D | 7 | 80 | 2070388 | 14617.75 | 593 | 578 | 141.6 |
| D | 1 | 52 | 1124408 | 7936.9 | 593 | 578 | 141.6 |
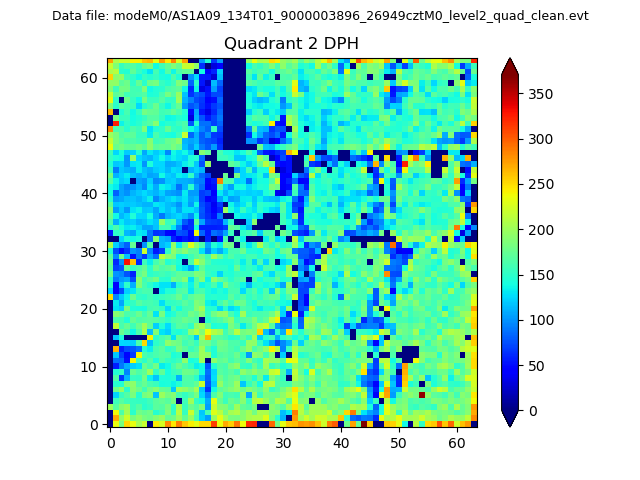
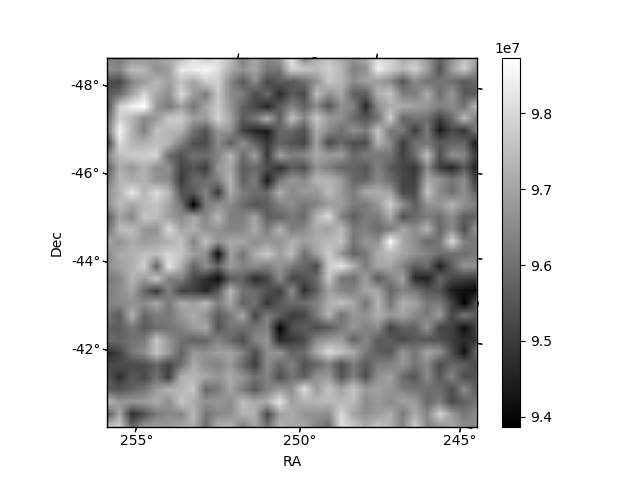
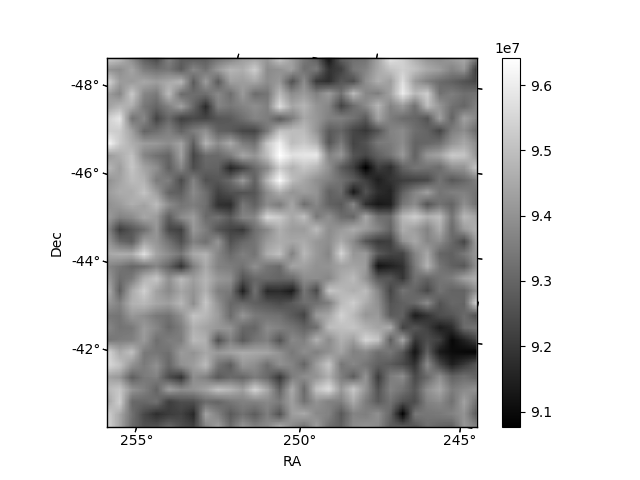
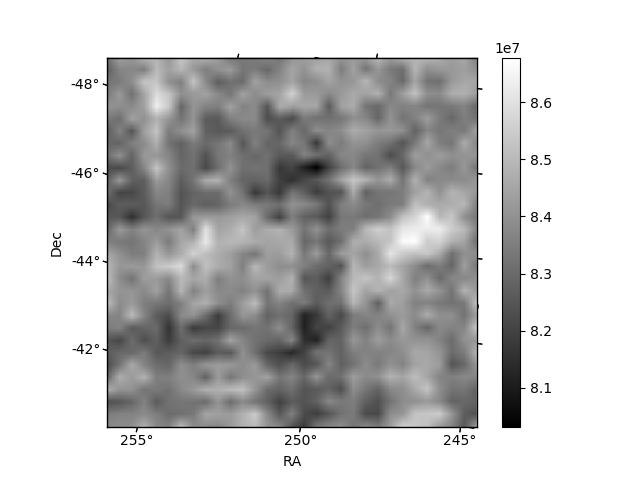
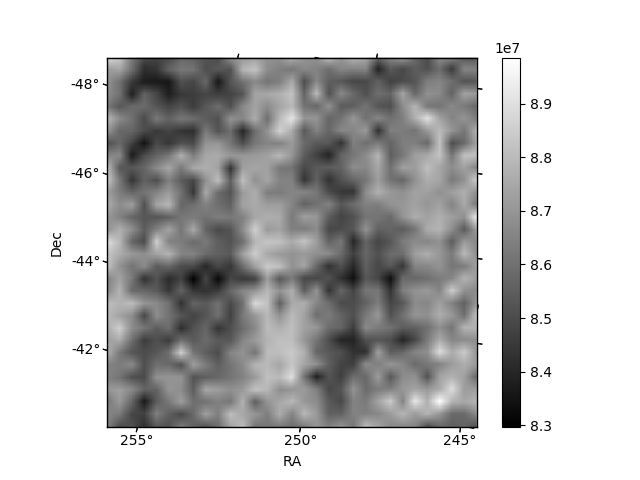
Histogram calculated using DETX and DETY for each event in the final _common_clean file
| Quadrant A | 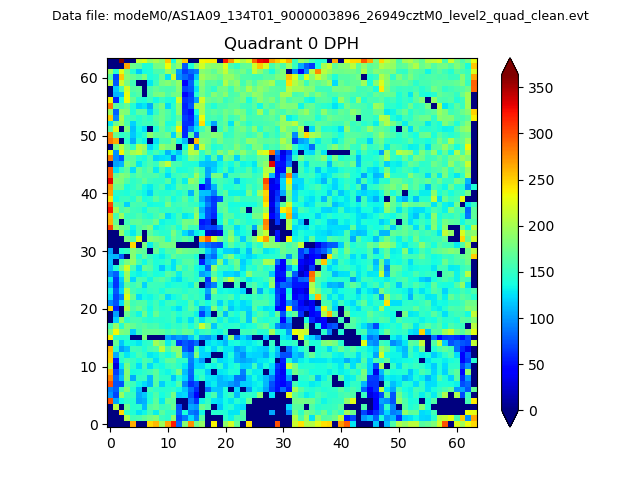 |
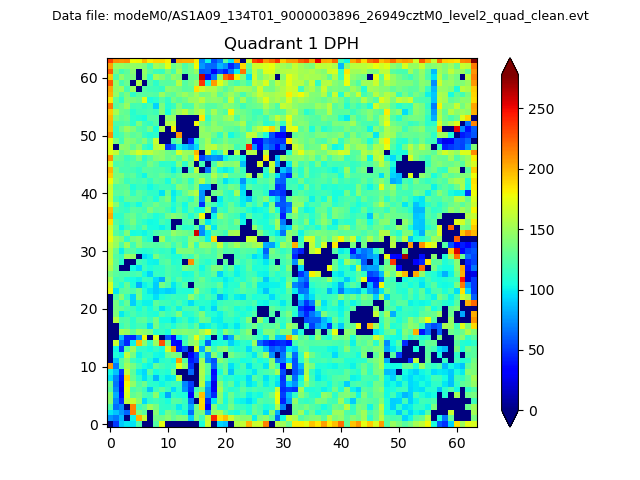 |
Quadrant B |
|---|---|---|---|
| Quadrant D | 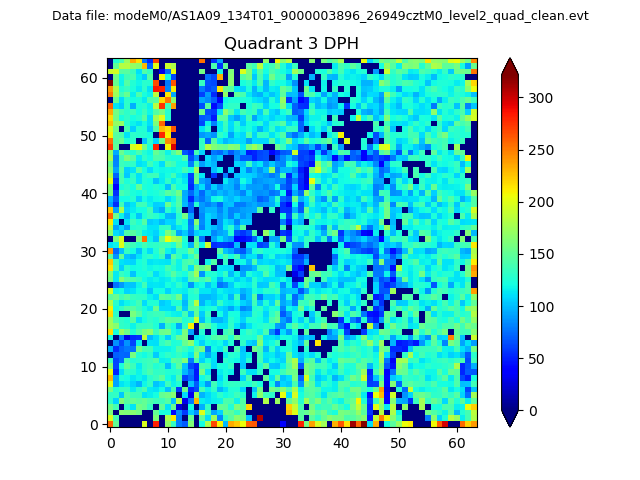 |
 |
Quadrant C |
| Plot type | Count rate plots | Images |
|---|---|---|
| Comparison with Poisson distribution Blue bars denote a histogram of data divided into 1 sec bins. Red curve is a Poisson curve with rate = median count rate of data. |
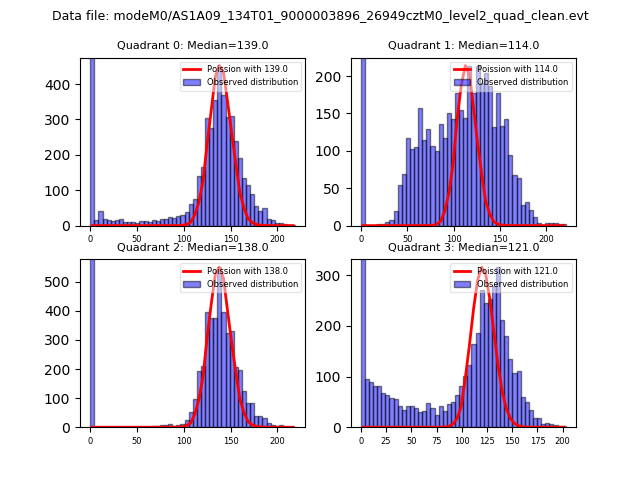 |
 |
| Quadrant-wise count rates Data is divided into 100 sec bins |
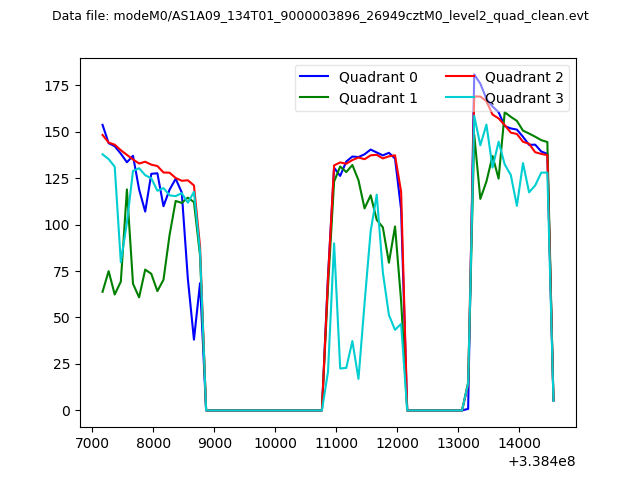 |
|
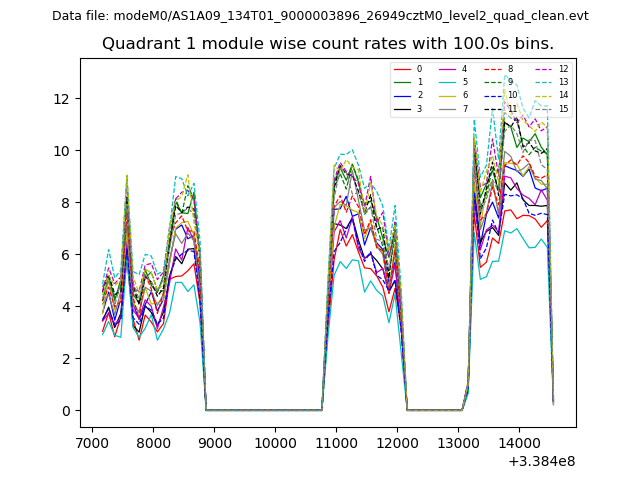
| Module-wise count rates for Quadrant A Data is divided into 100 sec bins |
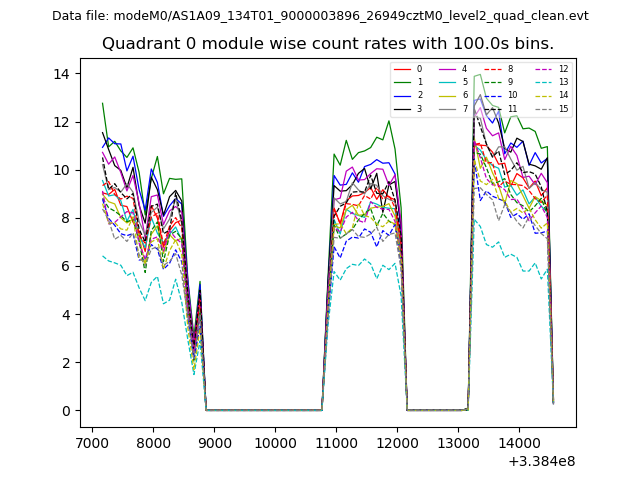 |
 |
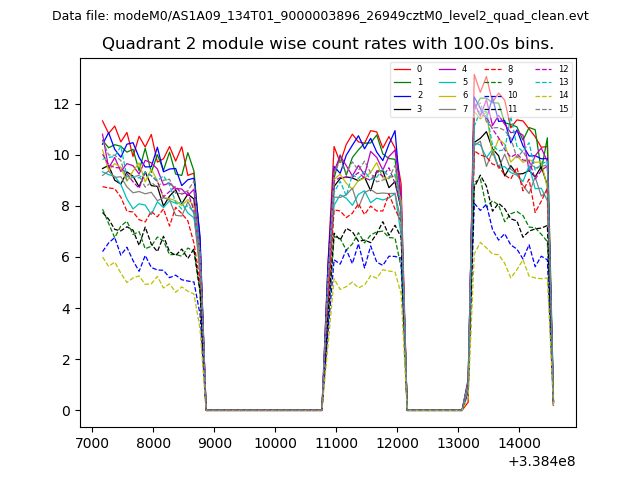
| Module-wise count rates for Quadrant B Data is divided into 100 sec bins |
 |
 |
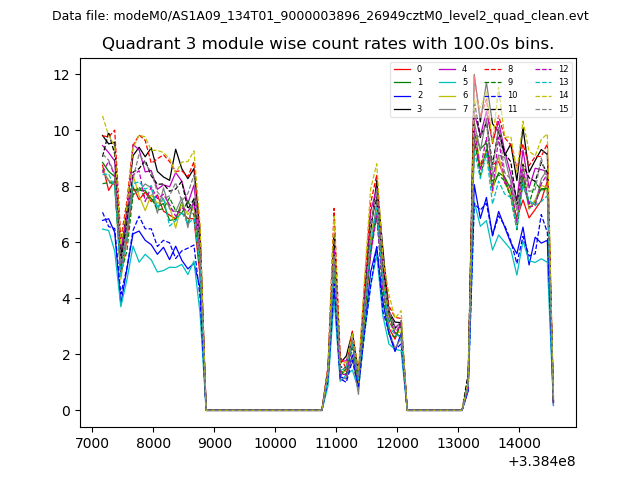
| Module-wise count rates for Quadrant C Data is divided into 100 sec bins |
 |
 |
| Module-wise count rates for Quadrant D Data is divided into 100 sec bins |
 |
 |
| Parameter | Plot |
|---|---|
| CZT HV Monitor | 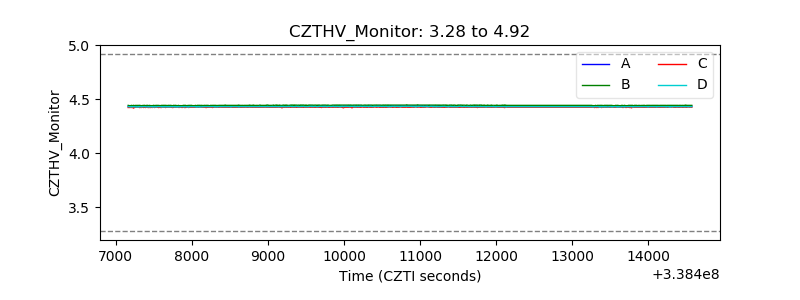 |
| D_VDD | 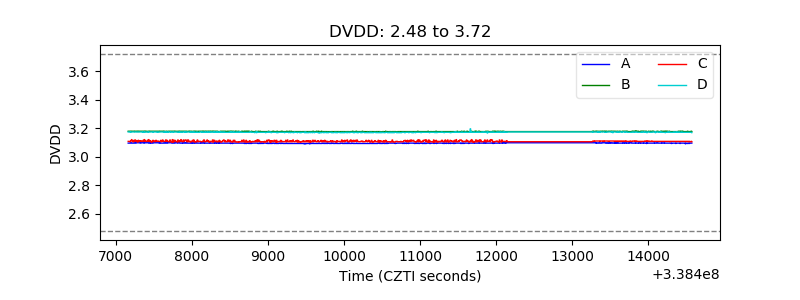 |
| Temperature 1 | 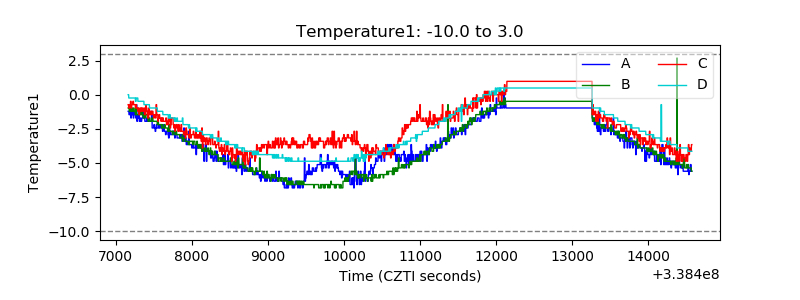 |
| Veto HV Monitor | 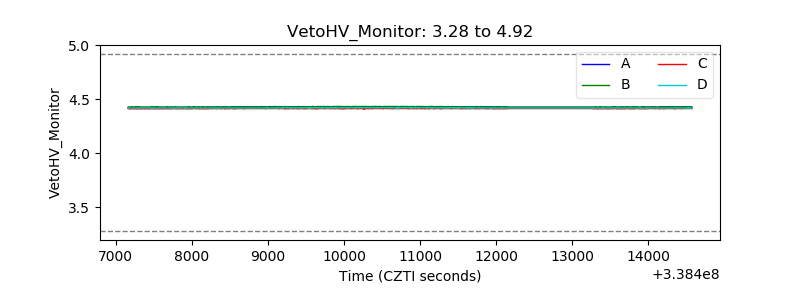 |
| Veto LLD | 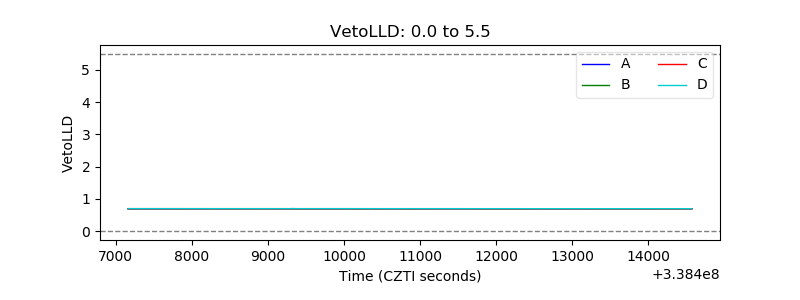 |
| Alpha Counter | 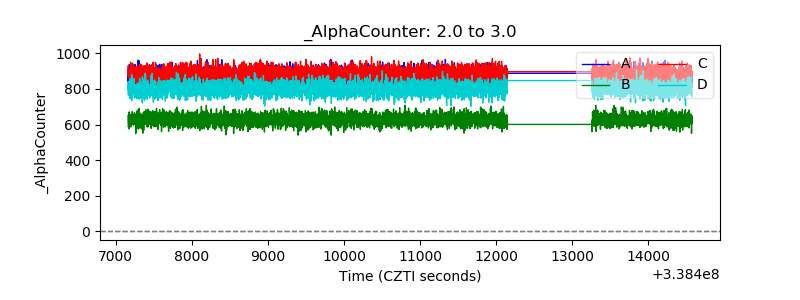 |
| _CPM_Rate | 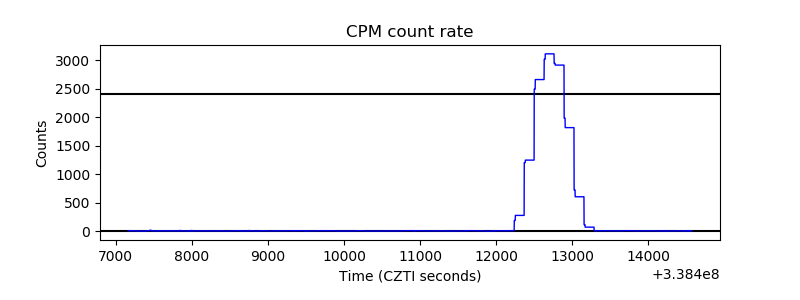 |
| CZT Counter | 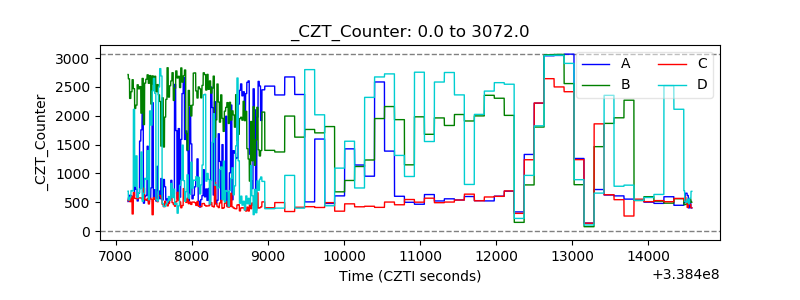 |
| +2.5 Volts monitor |  |
| +5 Volts monitor |  |
| _ROLL_ROT | 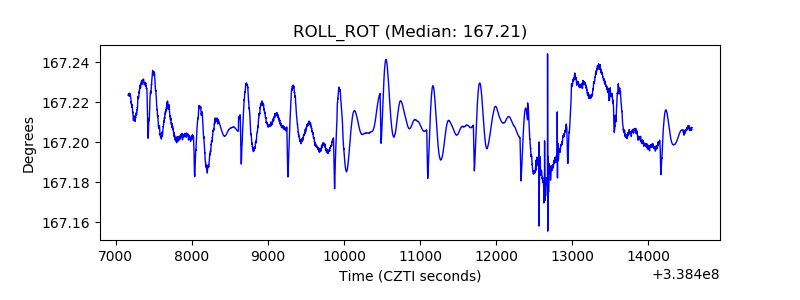 |
| _Roll_DEC |  |
| _Roll_RA |  |
| Veto Counter | 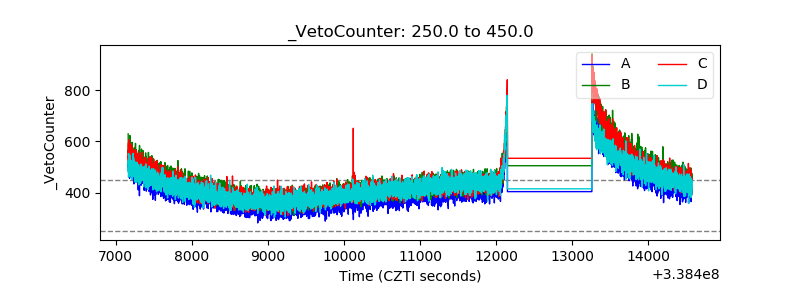 |