| Param | Original file | Final file |
|---|---|---|
| Filename | modeM0/AS1A09_134T01_9000003896_26950cztM0_level2.evt | modeM0/AS1A09_134T01_9000003896_26950cztM0_level2_quad_clean.evt |
| Size (bytes) | 957,254,400 | 86,238,720 |
| Size | 912.9 MB | 82.2 MB |
| Events in quadrant A | 6,445,976 | 565,629 |
| Events in quadrant B | 10,637,617 | 504,198 |
| Events in quadrant C | 3,403,642 | 599,946 |
| Events in quadrant D | 8,078,172 | 498,736 |
| Mode M9 | |||
|---|---|---|---|
| Quadrant | BADHDUFLAG | Total packets | Discarded packets |
| A | 0 | 16 | 0 |
| B | 0 | 17 | 0 |
| C | 0 | 17 | 0 |
| D | 0 | 17 | 0 |
| Mode M0 | |||
|---|---|---|---|
| Quadrant | BADHDUFLAG | Total packets | Discarded packets |
| A | 0 | 23288 | 0 |
| B | 0 | 35869 | 0 |
| C | 0 | 13928 | 0 |
| D | 0 | 28289 | 0 |
| Quadrant | Total seconds | Saturated seconds | Saturation percentage |
|---|---|---|---|
| A | 6317 | 1206 | 19.091341% |
| B | 6316 | 3081 | 48.780874% |
| C | 6316 | 84 | 1.329956% |
| D | 6316 | 1609 | 25.474984% |
Noise dominated data is calculated using 1-second bins in cleaned event files. If a bin has >2000 counts, and if more than 50% of those come from <1% of pixels, then it is considered to be noise-dominated and hence unusable.
| Quadrant | # 1 sec bins | Bins with >0 counts | Bins with >2000 counts | High rate bins dominated by noise | Noise dominated (total time) | Noise dominated (detector-on time) | Marked lightcurve |
|---|---|---|---|---|---|---|---|
| A | 7556 | 6316 | 915 | 915 | 12.11% | 14.49% | 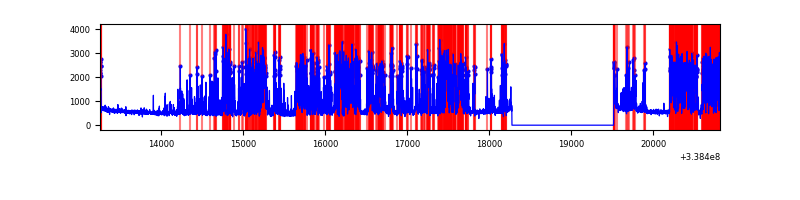 |
| B | 7556 | 6316 | 2525 | 2525 | 33.42% | 39.98% | 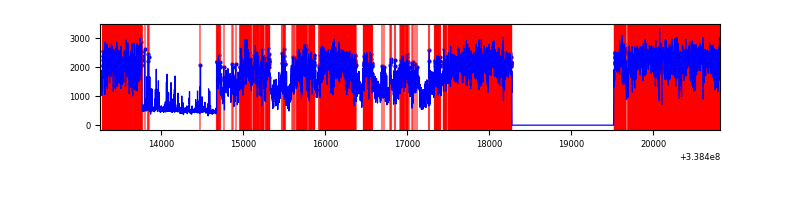 |
| C | 7556 | 6317 | 35 | 35 | 0.46% | 0.55% | 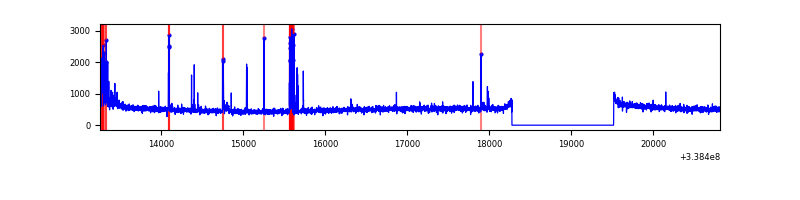 |
| D | 7556 | 6316 | 1560 | 1560 | 20.65% | 24.70% | 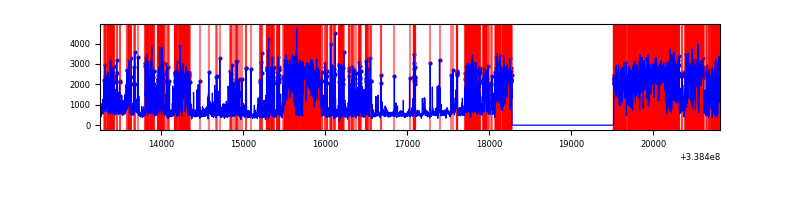 |
Top three noisy pixels from each quadrant. If the there are fewer than three noisy pixels in the level2.evt file, extra rows are filled as -1
| Pixel properties | Quadrant properties | ||||||
|---|---|---|---|---|---|---|---|
| Quadrant | DetID | PixID | Counts | Sigma | Mean | Median | Sigma |
| A | 14 | 235 | 3469870 | 23251.25 | 750 | 737 | 149.2 |
| A | 8 | 192 | 48943 | 323.09 | 750 | 737 | 149.2 |
| A | 5 | 168 | 26133 | 170.21 | 750 | 737 | 149.2 |
| B | 0 | 189 | 7649761 | 57495.72 | 717 | 702 | 133.0 |
| B | 10 | 245 | 97540 | 727.9 | 717 | 702 | 133.0 |
| B | 3 | 112 | 42695 | 315.65 | 717 | 702 | 133.0 |
| C | 14 | 238 | 127050 | 693.6 | 784 | 789 | 182.0 |
| C | 15 | 208 | 110013 | 600.01 | 784 | 789 | 182.0 |
| C | 2 | 16 | 104318 | 568.72 | 784 | 789 | 182.0 |
| D | 1 | 52 | 3061291 | 18142.58 | 707 | 687 | 168.7 |
| D | 12 | 1 | 1593959 | 9444.56 | 707 | 687 | 168.7 |
| D | 2 | 250 | 411988 | 2438.1 | 707 | 687 | 168.7 |
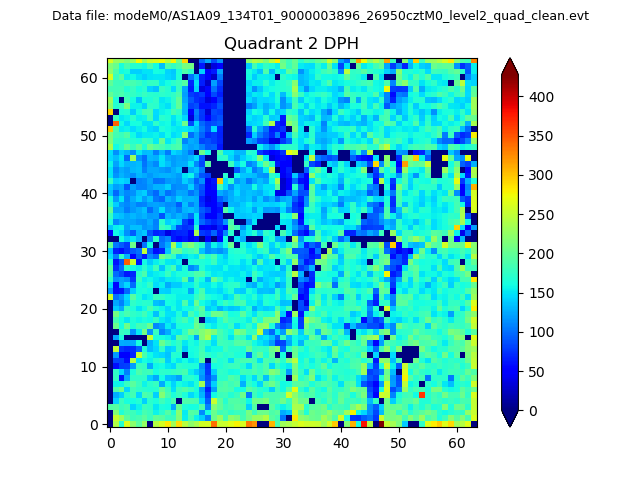
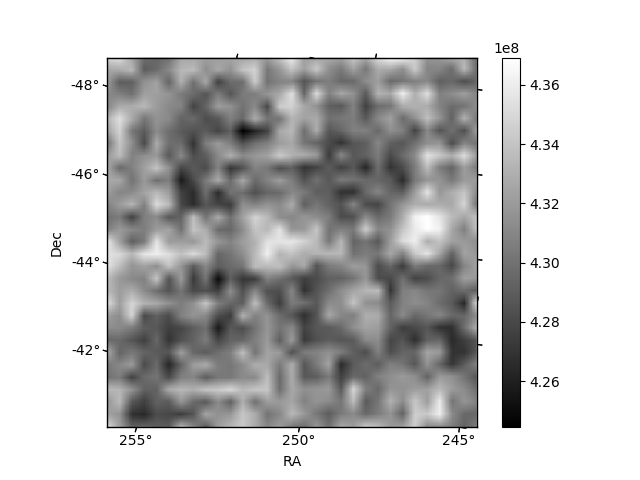
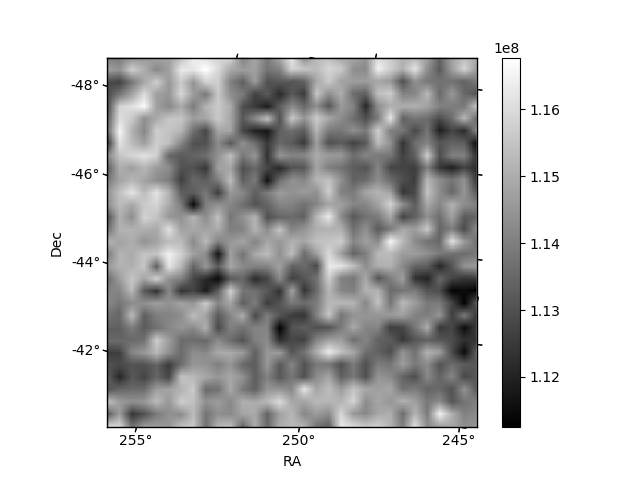
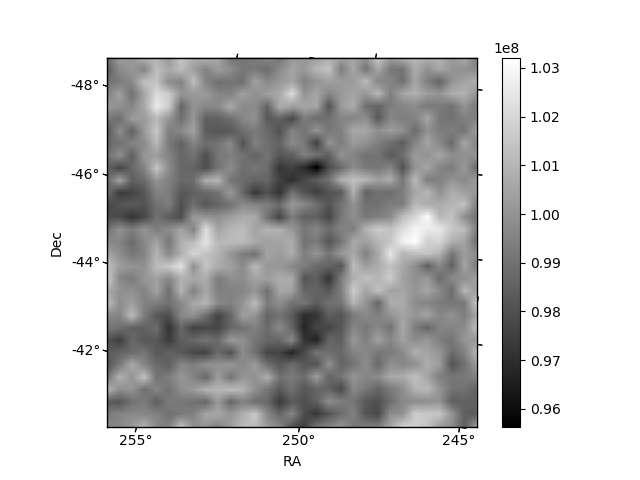
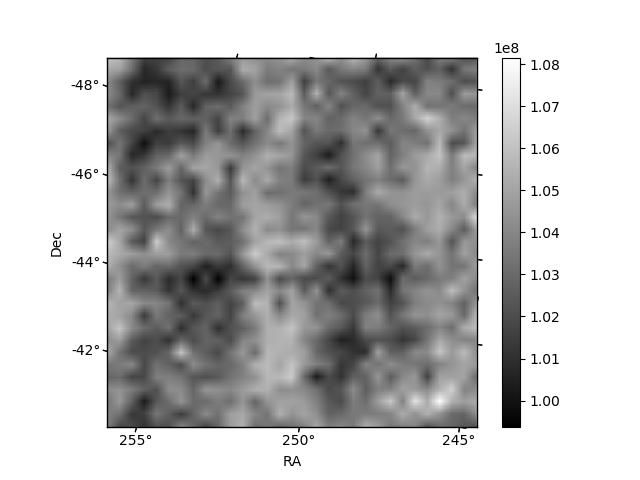
Histogram calculated using DETX and DETY for each event in the final _common_clean file
| Quadrant A | 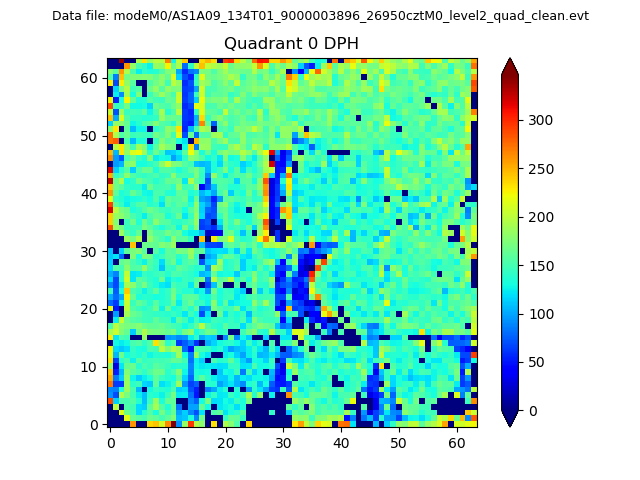 |
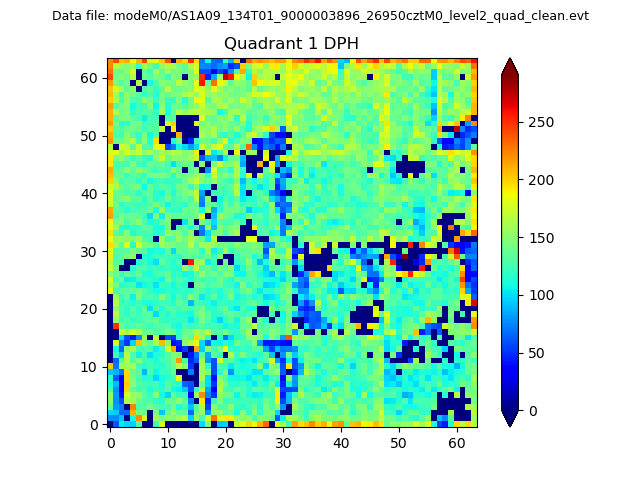 |
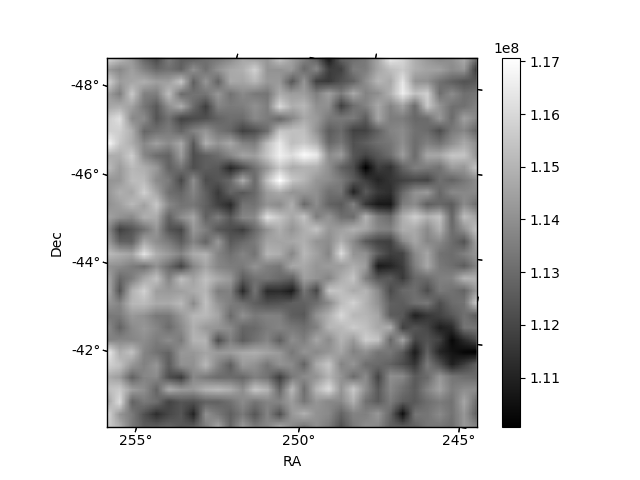
Quadrant B |
|---|---|---|---|
| Quadrant D | 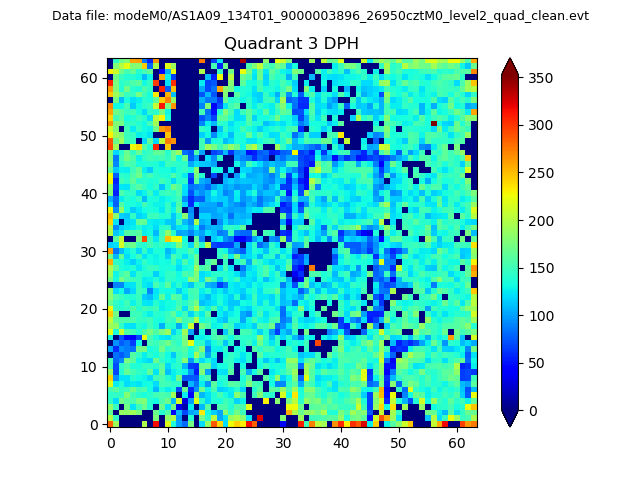 |
 |
Quadrant C |
| Plot type | Count rate plots | Images |
|---|---|---|
| Comparison with Poisson distribution Blue bars denote a histogram of data divided into 1 sec bins. Red curve is a Poisson curve with rate = median count rate of data. |
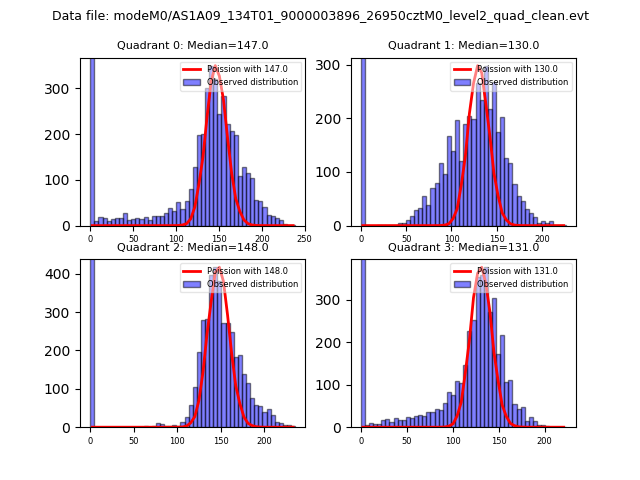 |
 |
| Quadrant-wise count rates Data is divided into 100 sec bins |
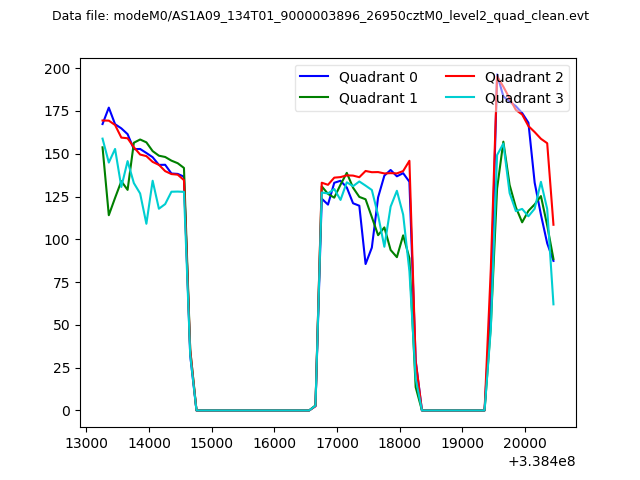 |
|
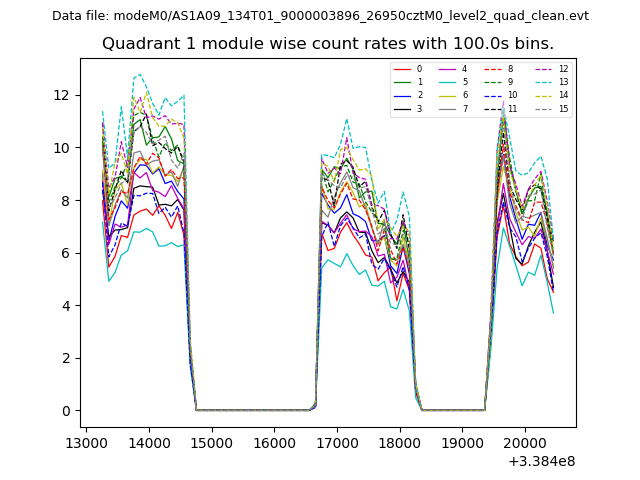
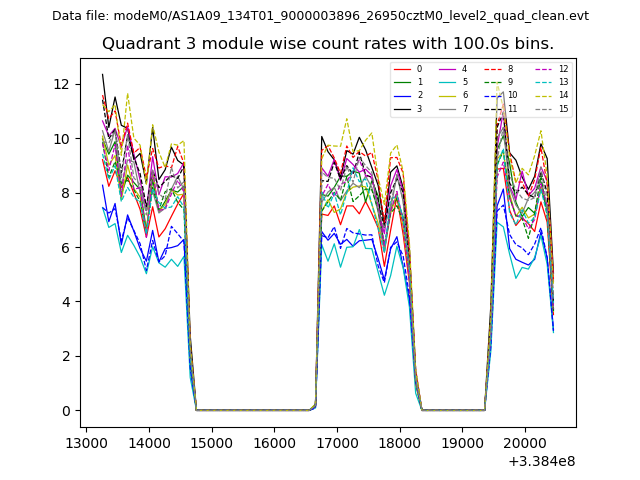
| Module-wise count rates for Quadrant A Data is divided into 100 sec bins |
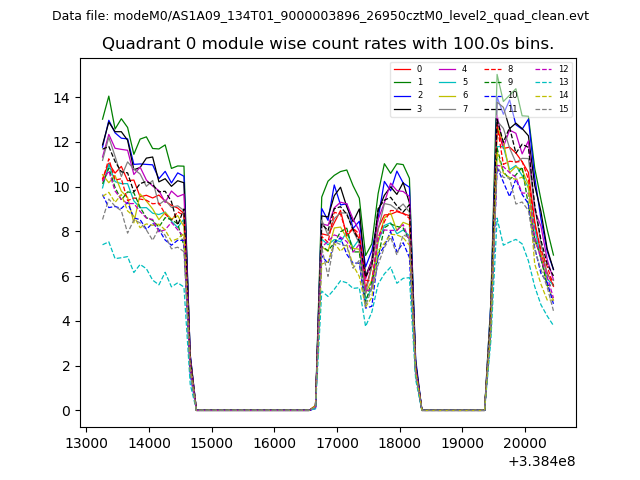 |
 |
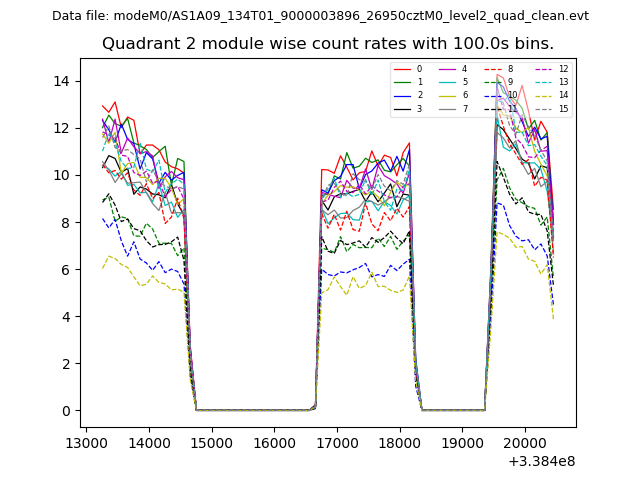
| Module-wise count rates for Quadrant B Data is divided into 100 sec bins |
 |
 |
| Module-wise count rates for Quadrant C Data is divided into 100 sec bins |
 |
 |
| Module-wise count rates for Quadrant D Data is divided into 100 sec bins |
 |
 |
| Parameter | Plot |
|---|---|
| CZT HV Monitor | 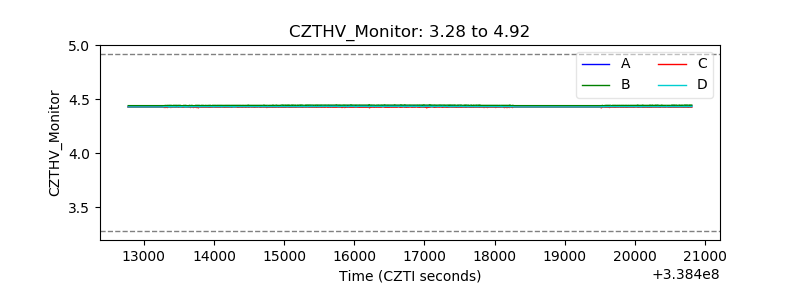 |
| D_VDD | 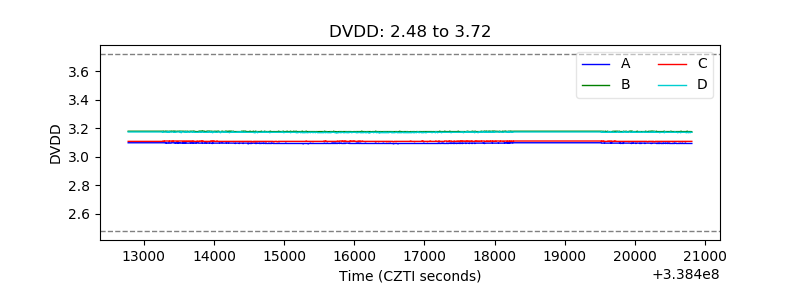 |
| Temperature 1 | 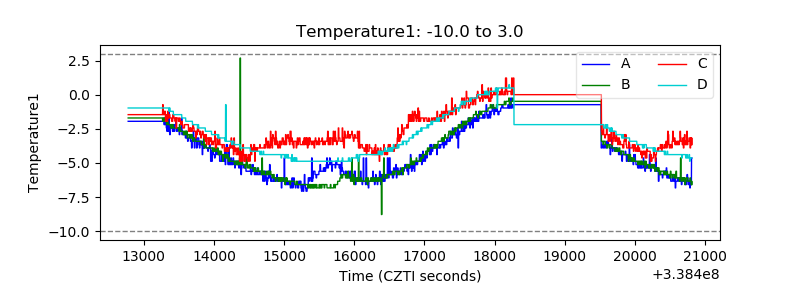 |
| Veto HV Monitor | 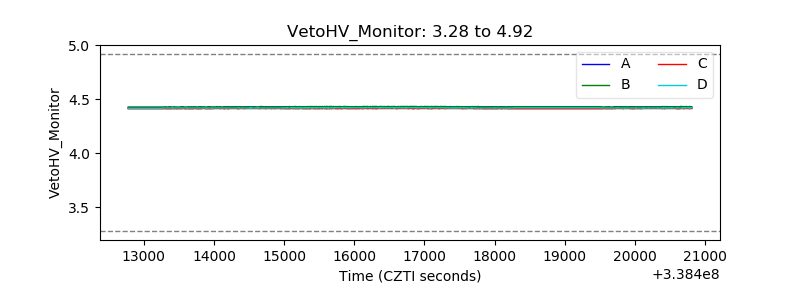 |
| Veto LLD | 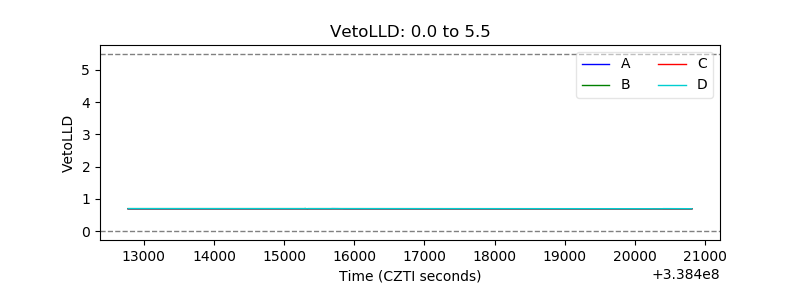 |
| Alpha Counter | 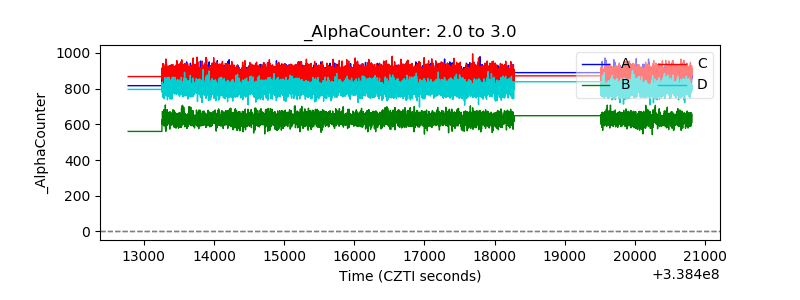 |
| _CPM_Rate | 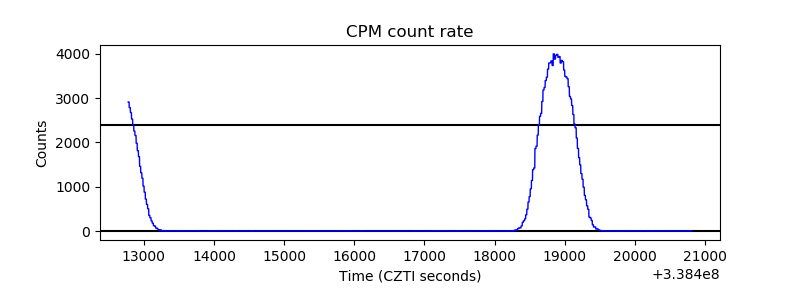 |
| CZT Counter | 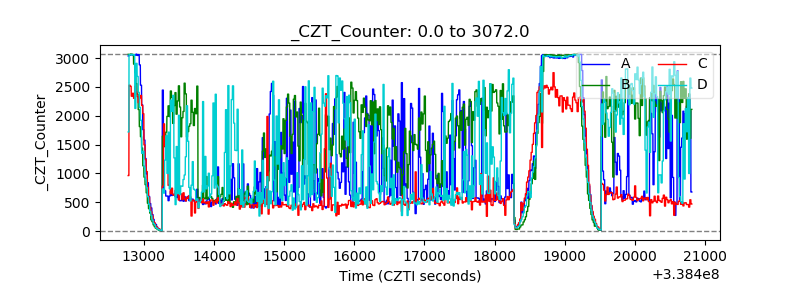 |
| +2.5 Volts monitor | 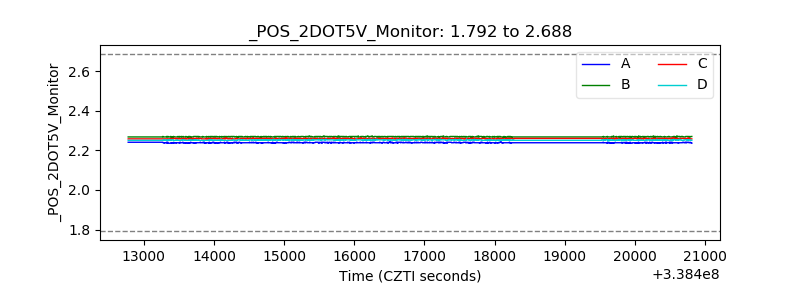 |
| +5 Volts monitor |  |
| _ROLL_ROT | 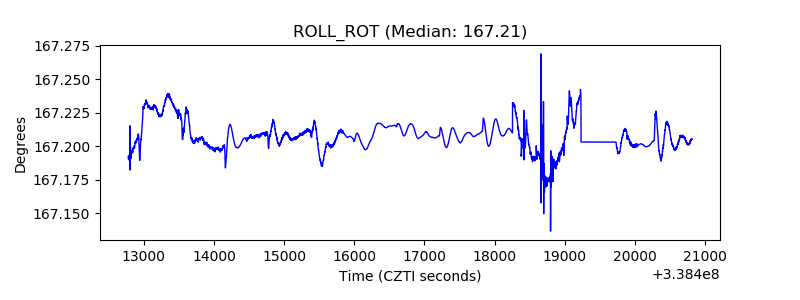 |
| _Roll_DEC |  |
| _Roll_RA | 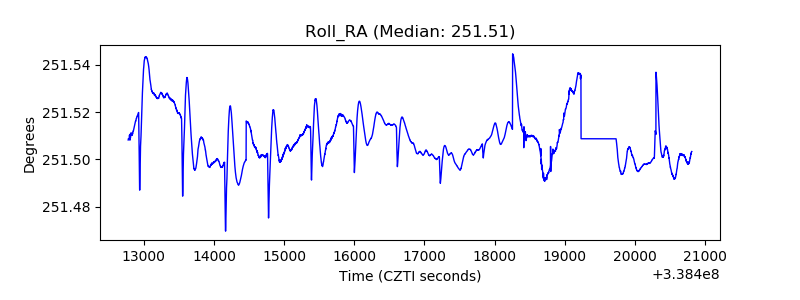 |
| Veto Counter | 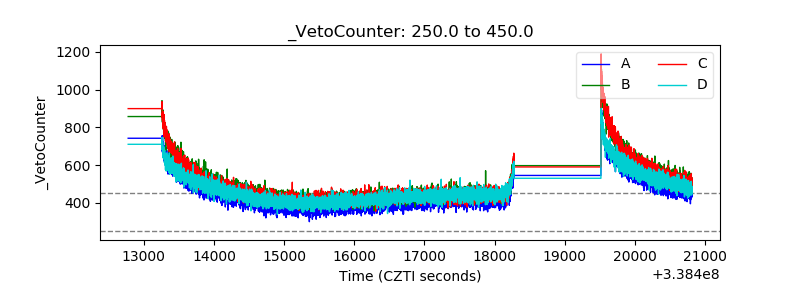 |