| Param | Original file | Final file |
|---|---|---|
| Filename | modeM0/AS1A09_134T01_9000003896_26951cztM0_level2.evt | modeM0/AS1A09_134T01_9000003896_26951cztM0_level2_quad_clean.evt |
| Size (bytes) | 906,776,640 | 75,905,280 |
| Size | 864.8 MB | 72.4 MB |
| Events in quadrant A | 5,389,520 | 499,765 |
| Events in quadrant B | 10,723,537 | 417,915 |
| Events in quadrant C | 3,176,816 | 514,544 |
| Events in quadrant D | 7,769,624 | 447,290 |
| Mode M9 | |||
|---|---|---|---|
| Quadrant | BADHDUFLAG | Total packets | Discarded packets |
| A | 0 | 13 | 0 |
| B | 0 | 13 | 0 |
| C | 0 | 13 | 0 |
| D | 0 | 13 | 0 |
| Mode M0 | |||
|---|---|---|---|
| Quadrant | BADHDUFLAG | Total packets | Discarded packets |
| A | 0 | 19726 | 0 |
| B | 0 | 36035 | 0 |
| C | 0 | 12847 | 0 |
| D | 0 | 27163 | 0 |
| Quadrant | Total seconds | Saturated seconds | Saturation percentage |
|---|---|---|---|
| A | 5977 | 912 | 15.258491% |
| B | 5977 | 3336 | 55.813953% |
| C | 5977 | 55 | 0.920194% |
| D | 5977 | 1471 | 24.611009% |
Noise dominated data is calculated using 1-second bins in cleaned event files. If a bin has >2000 counts, and if more than 50% of those come from <1% of pixels, then it is considered to be noise-dominated and hence unusable.
| Quadrant | # 1 sec bins | Bins with >0 counts | Bins with >2000 counts | High rate bins dominated by noise | Noise dominated (total time) | Noise dominated (detector-on time) | Marked lightcurve |
|---|---|---|---|---|---|---|---|
| A | 7297 | 5978 | 727 | 727 | 9.96% | 12.16% | 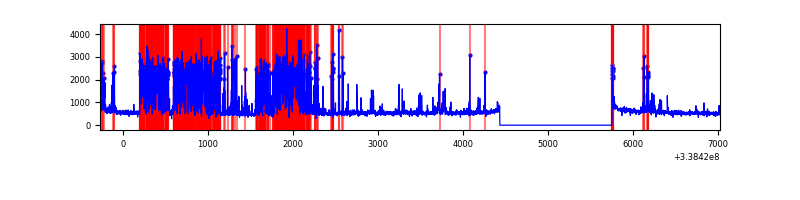 |
| B | 7297 | 5977 | 2809 | 2809 | 38.50% | 47.00% | 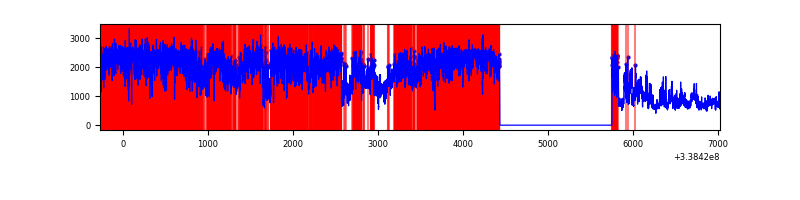 |
| C | 7297 | 5978 | 2 | 2 | 0.03% | 0.03% | 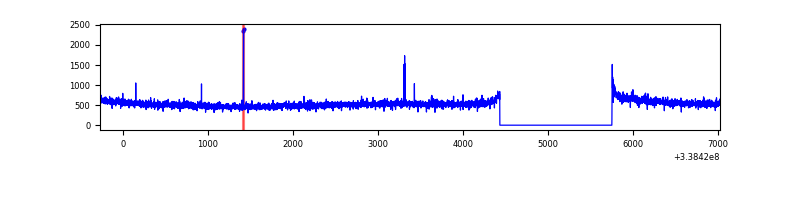 |
| D | 7297 | 5978 | 1512 | 1512 | 20.72% | 25.29% | 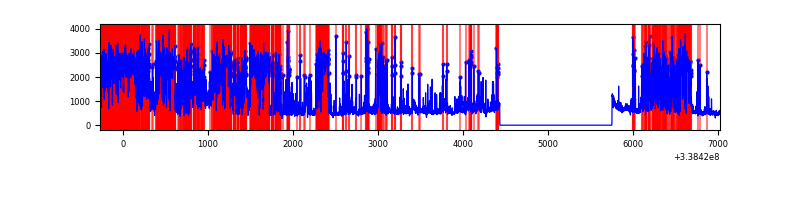 |
Top three noisy pixels from each quadrant. If the there are fewer than three noisy pixels in the level2.evt file, extra rows are filled as -1
| Pixel properties | Quadrant properties | ||||||
|---|---|---|---|---|---|---|---|
| Quadrant | DetID | PixID | Counts | Sigma | Mean | Median | Sigma |
| A | 14 | 235 | 2464881 | 16637.06 | 746 | 736 | 148.1 |
| A | 8 | 192 | 26006 | 170.61 | 746 | 736 | 148.1 |
| A | 5 | 168 | 16040 | 103.33 | 746 | 736 | 148.1 |
| B | 0 | 189 | 7897867 | 62378.12 | 692 | 677 | 126.6 |
| B | 5 | 172 | 61955 | 484.02 | 692 | 677 | 126.6 |
| B | 3 | 112 | 22255 | 170.44 | 692 | 677 | 126.6 |
| C | 14 | 238 | 127126 | 708.38 | 774 | 779 | 178.4 |
| C | 15 | 208 | 16962 | 90.73 | 774 | 779 | 178.4 |
| C | 2 | 16 | 11607 | 60.71 | 774 | 779 | 178.4 |
| D | 1 | 52 | 3090192 | 18568.11 | 702 | 684 | 166.4 |
| D | 12 | 1 | 1546756 | 9291.97 | 702 | 684 | 166.4 |
| D | 2 | 250 | 238872 | 1431.52 | 702 | 684 | 166.4 |
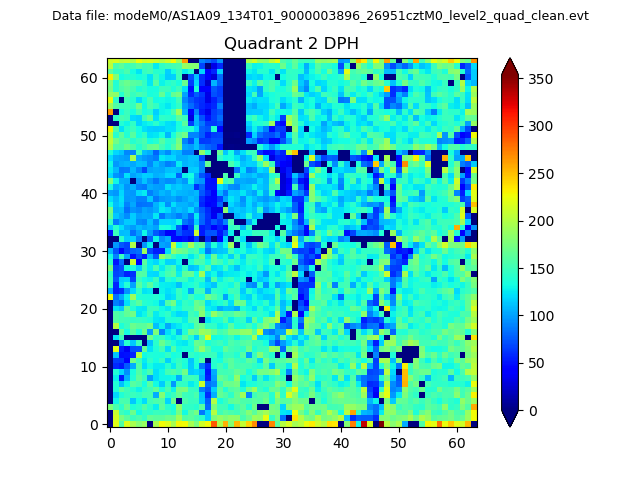
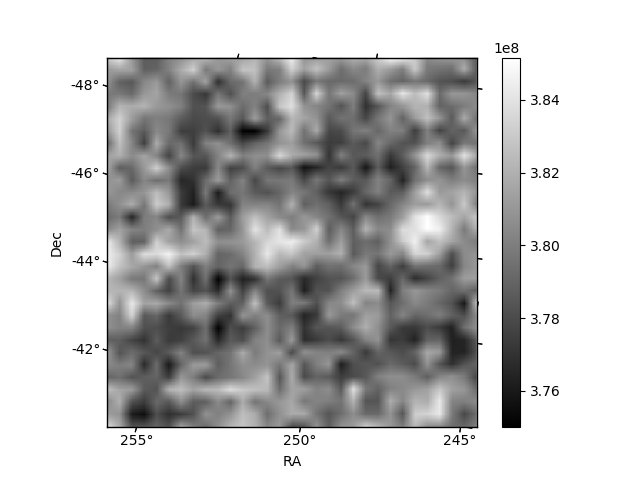
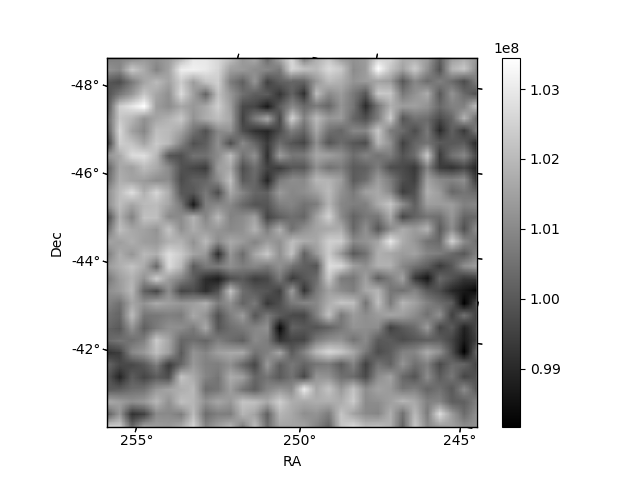
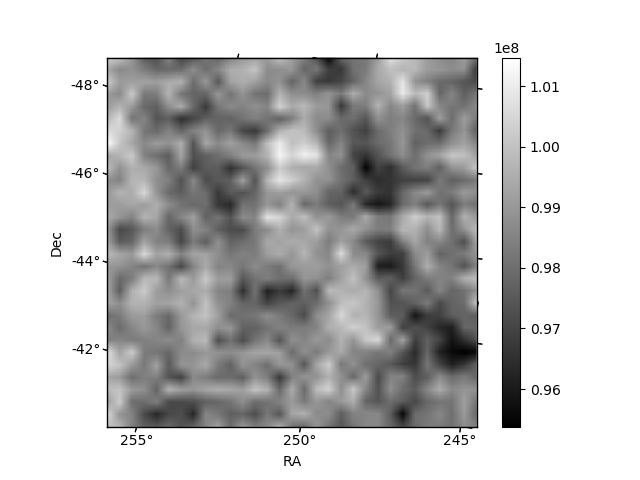
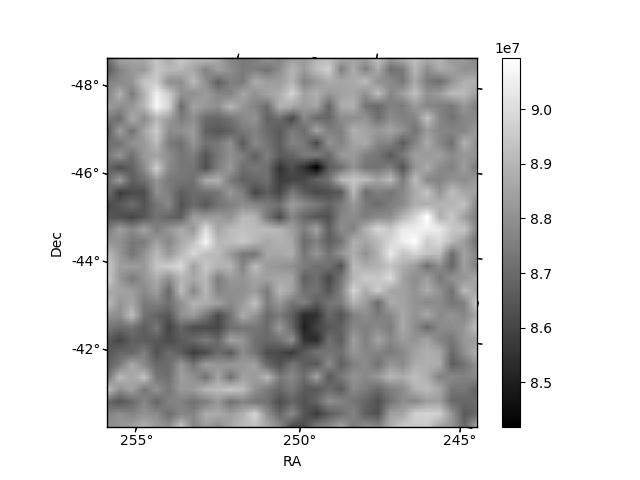
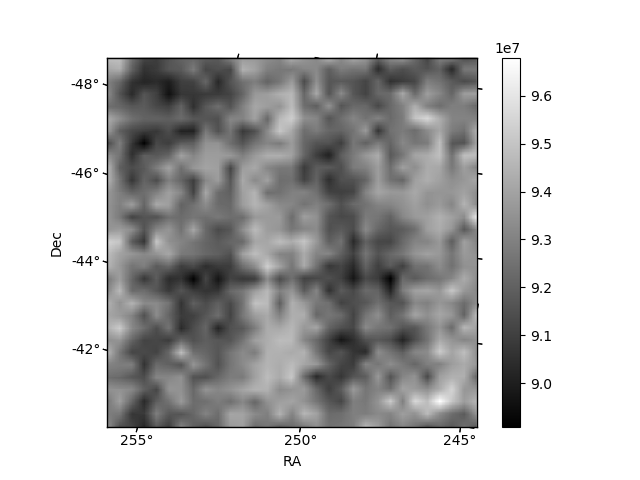
Histogram calculated using DETX and DETY for each event in the final _common_clean file
| Quadrant A | 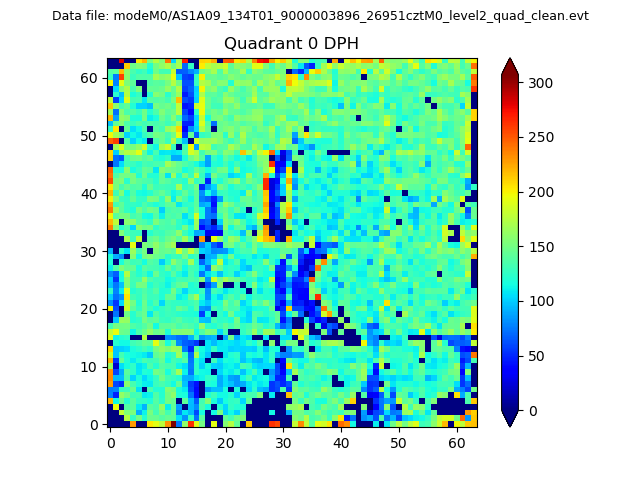 |
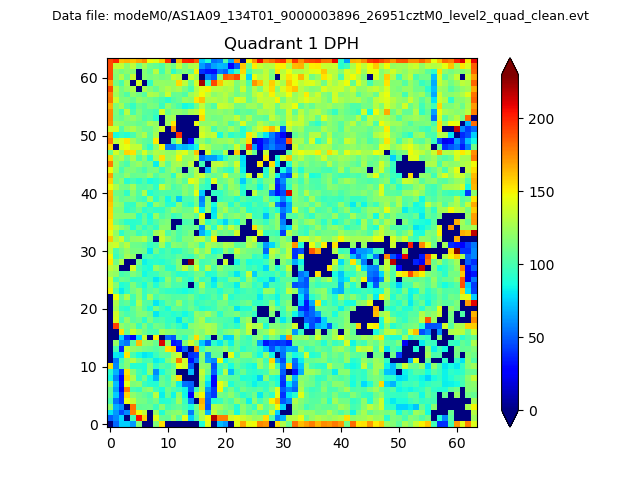 |
Quadrant B |
|---|---|---|---|
| Quadrant D | 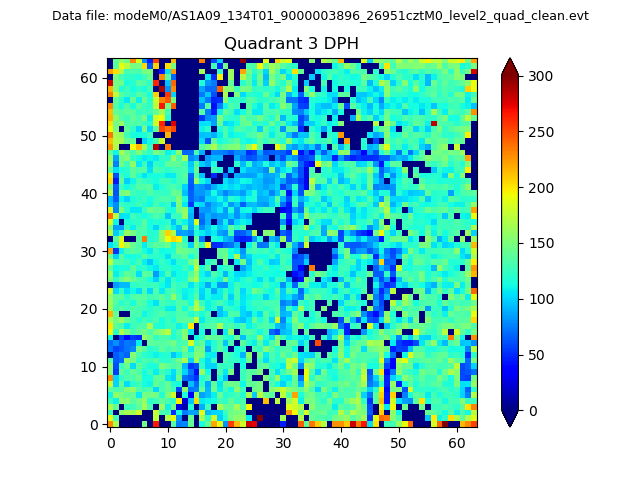 |
 |
Quadrant C |
| Plot type | Count rate plots | Images |
|---|---|---|
| Comparison with Poisson distribution Blue bars denote a histogram of data divided into 1 sec bins. Red curve is a Poisson curve with rate = median count rate of data. |
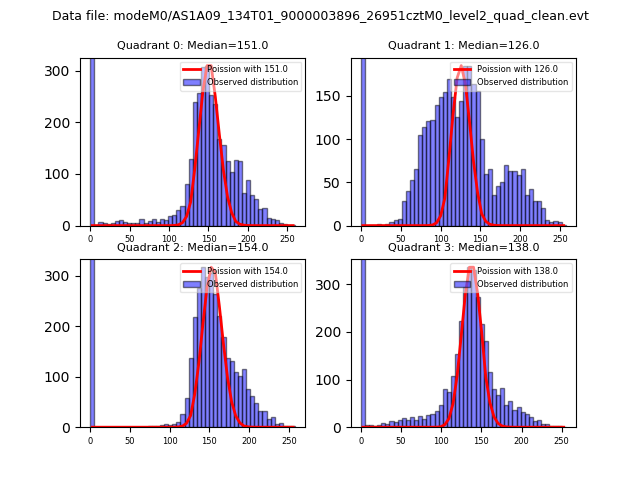 |
 |
| Quadrant-wise count rates Data is divided into 100 sec bins |
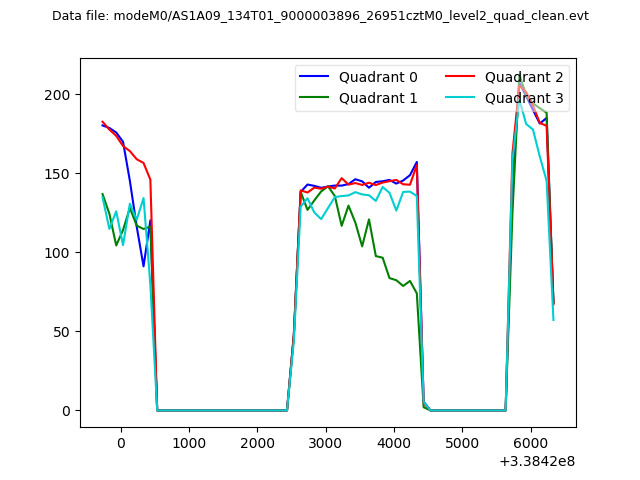 |
|
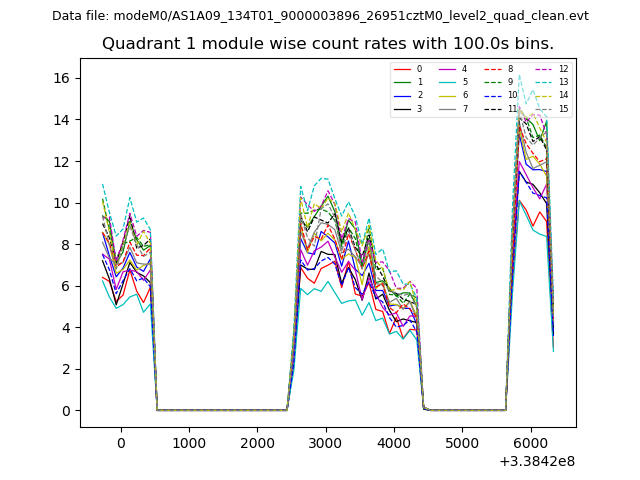
| Module-wise count rates for Quadrant A Data is divided into 100 sec bins |
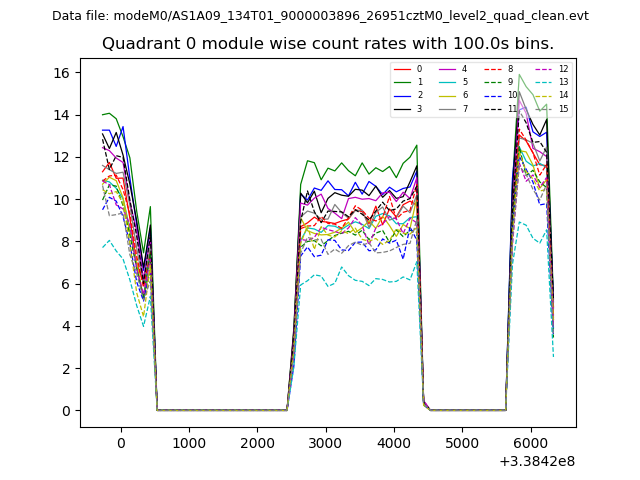 |
 |
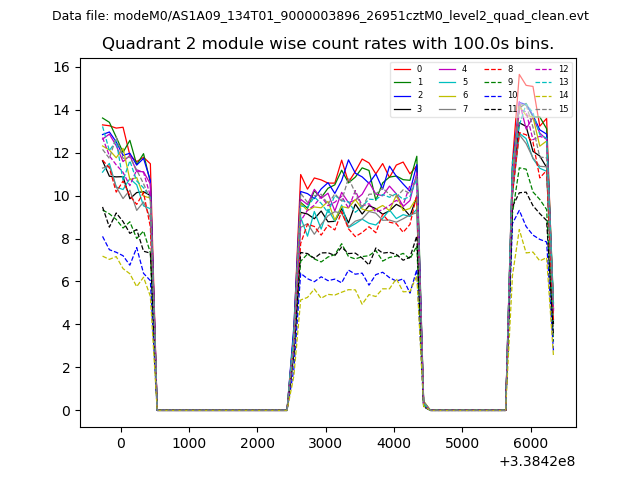
| Module-wise count rates for Quadrant B Data is divided into 100 sec bins |
 |
 |
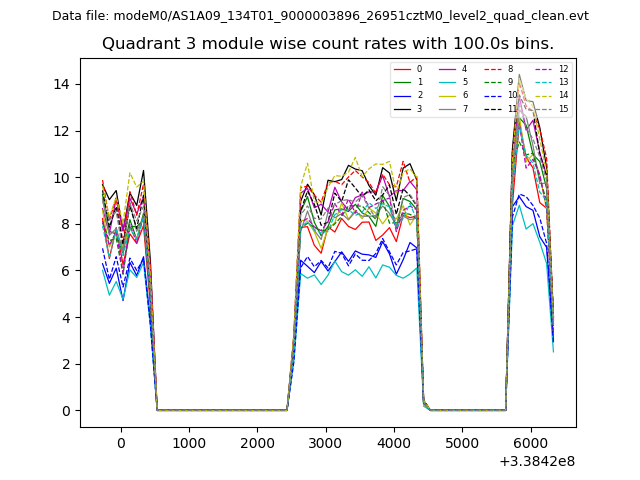
| Module-wise count rates for Quadrant C Data is divided into 100 sec bins |
 |
 |
| Module-wise count rates for Quadrant D Data is divided into 100 sec bins |
 |
 |
| Parameter | Plot |
|---|---|
| CZT HV Monitor | 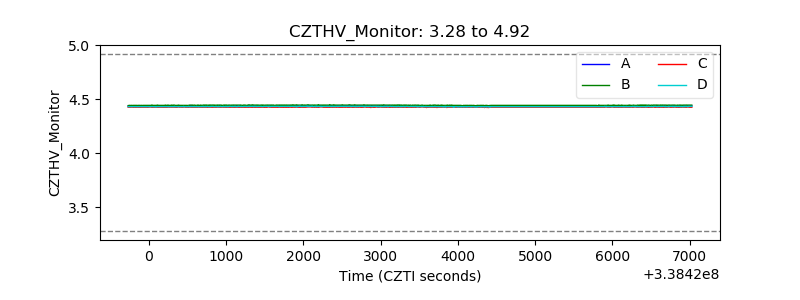 |
| D_VDD | 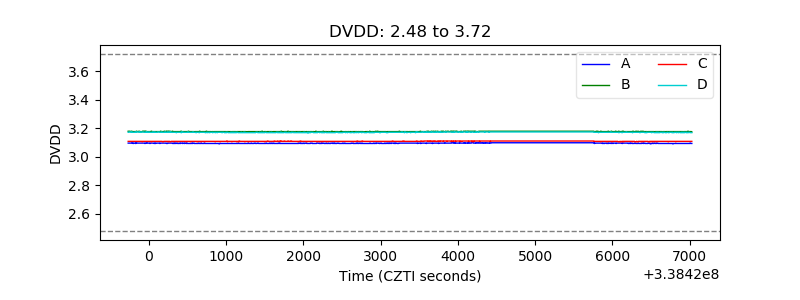 |
| Temperature 1 | 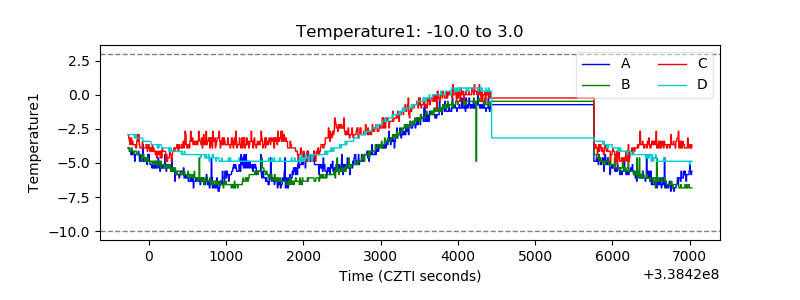 |
| Veto HV Monitor | 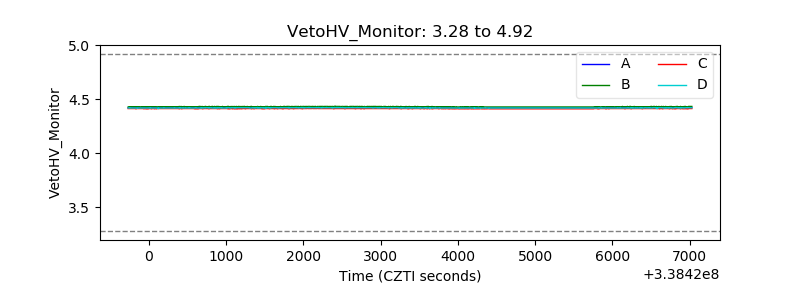 |
| Veto LLD | 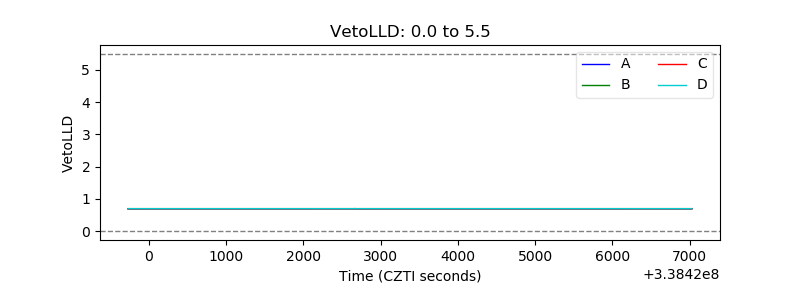 |
| Alpha Counter | 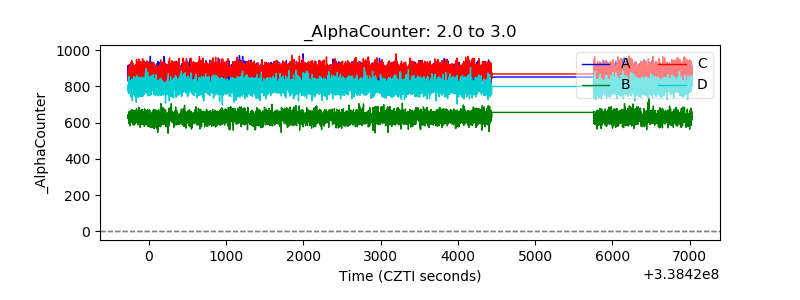 |
| _CPM_Rate | 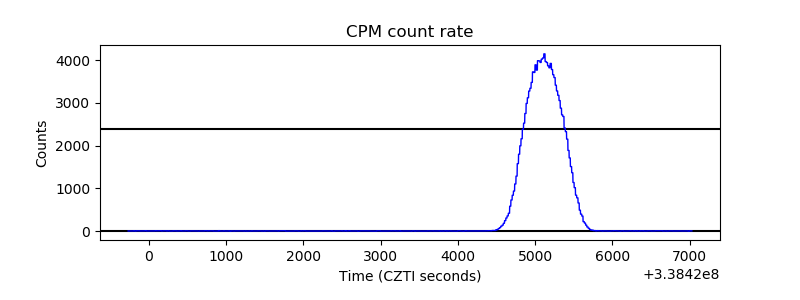 |
| CZT Counter | 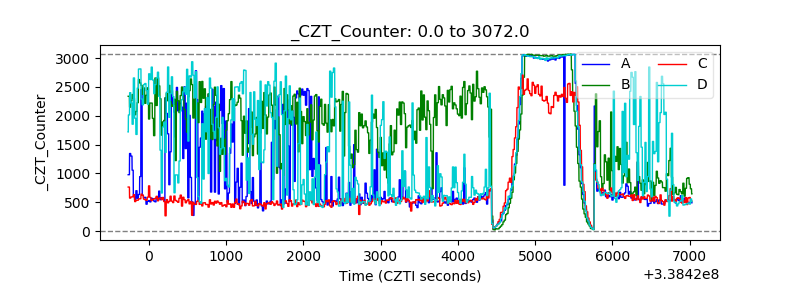 |
| +2.5 Volts monitor |  |
| +5 Volts monitor |  |
| _ROLL_ROT | 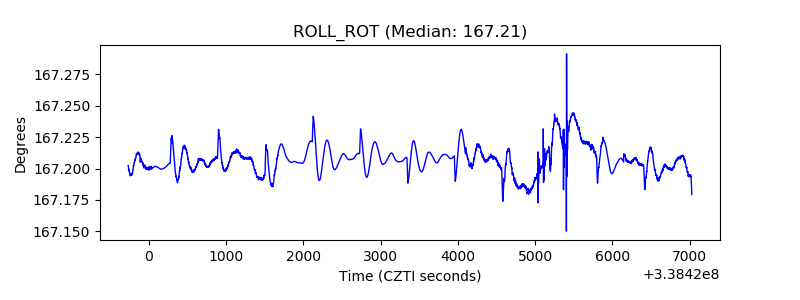 |
| _Roll_DEC | 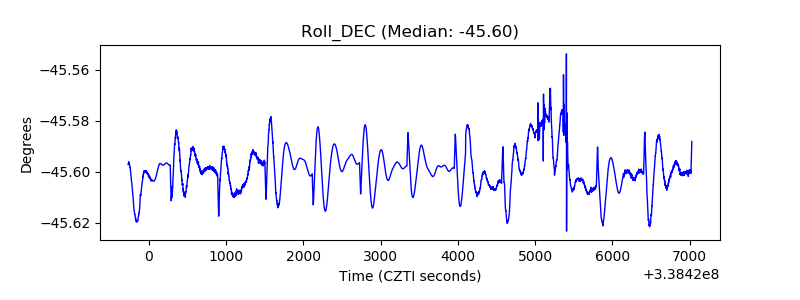 |
| _Roll_RA | 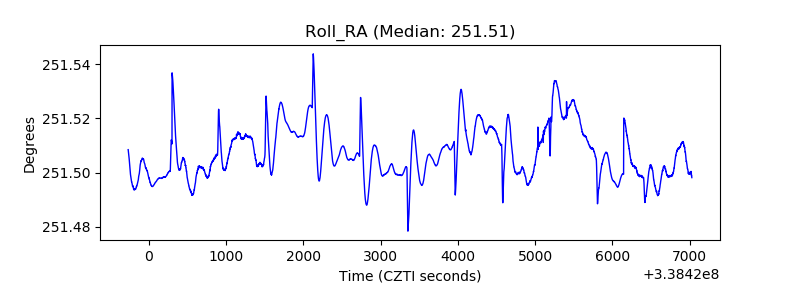 |
| Veto Counter | 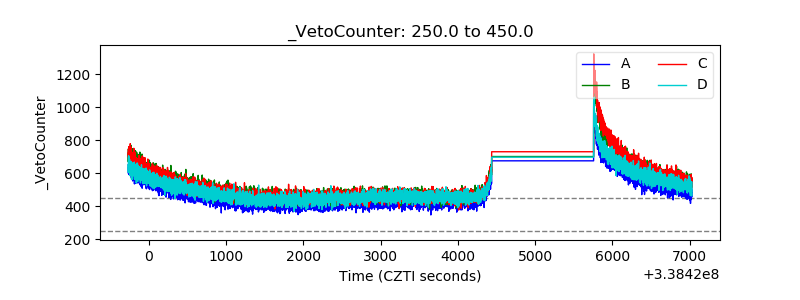 |