| Param | Original file | Final file |
|---|---|---|
| Filename | modeM0/AS1A09_134T01_9000003896_26952cztM0_level2.evt | modeM0/AS1A09_134T01_9000003896_26952cztM0_level2_quad_clean.evt |
| Size (bytes) | 683,032,320 | 75,888,000 |
| Size | 651.4 MB | 72.4 MB |
| Events in quadrant A | 3,566,330 | 479,632 |
| Events in quadrant B | 7,817,715 | 441,871 |
| Events in quadrant C | 3,578,649 | 480,598 |
| Events in quadrant D | 5,291,580 | 449,235 |
| Mode M9 | |||
|---|---|---|---|
| Quadrant | BADHDUFLAG | Total packets | Discarded packets |
| A | 0 | 20 | 0 |
| B | 0 | 21 | 0 |
| C | 0 | 21 | 0 |
| D | 0 | 21 | 0 |
| Mode M0 | |||
|---|---|---|---|
| Quadrant | BADHDUFLAG | Total packets | Discarded packets |
| A | 0 | 14267 | 0 |
| B | 0 | 27644 | 0 |
| C | 0 | 14305 | 0 |
| D | 0 | 19938 | 0 |
| Quadrant | Total seconds | Saturated seconds | Saturation percentage |
|---|---|---|---|
| A | 6391 | 64 | 1.001408% |
| B | 6391 | 1157 | 18.103583% |
| C | 6391 | 88 | 1.376936% |
| D | 6390 | 405 | 6.338028% |
Noise dominated data is calculated using 1-second bins in cleaned event files. If a bin has >2000 counts, and if more than 50% of those come from <1% of pixels, then it is considered to be noise-dominated and hence unusable.
| Quadrant | # 1 sec bins | Bins with >0 counts | Bins with >2000 counts | High rate bins dominated by noise | Noise dominated (total time) | Noise dominated (detector-on time) | Marked lightcurve |
|---|---|---|---|---|---|---|---|
| A | 7781 | 6392 | 28 | 28 | 0.36% | 0.44% | 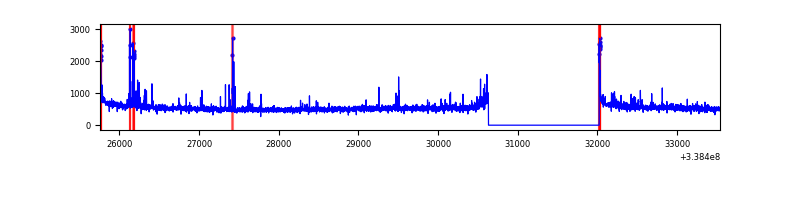 |
| B | 7781 | 6391 | 702 | 702 | 9.02% | 10.98% | 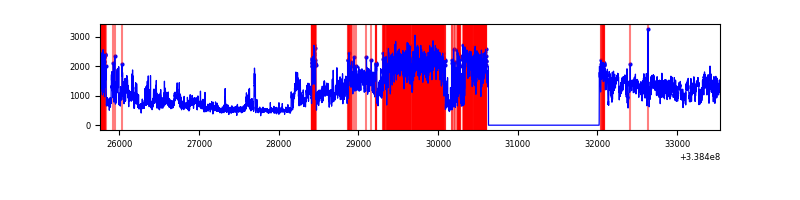 |
| C | 7781 | 6392 | 2 | 2 | 0.03% | 0.03% | 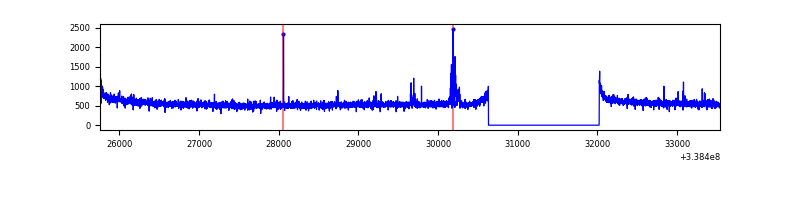 |
| D | 7779 | 6389 | 369 | 369 | 4.74% | 5.78% | 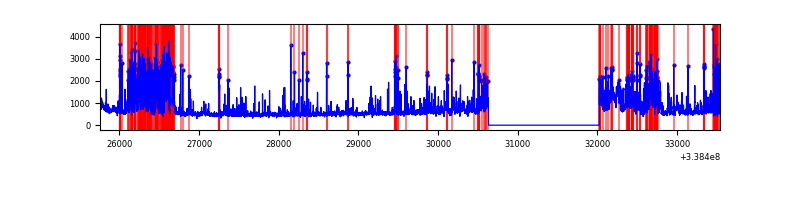 |
Top three noisy pixels from each quadrant. If the there are fewer than three noisy pixels in the level2.evt file, extra rows are filled as -1
| Pixel properties | Quadrant properties | ||||||
|---|---|---|---|---|---|---|---|
| Quadrant | DetID | PixID | Counts | Sigma | Mean | Median | Sigma |
| A | 14 | 235 | 105804 | 601.48 | 876 | 864 | 174.5 |
| A | 8 | 192 | 51650 | 291.09 | 876 | 864 | 174.5 |
| A | 0 | 13 | 31662 | 176.52 | 876 | 864 | 174.5 |
| B | 0 | 189 | 4310752 | 27852.5 | 851 | 833 | 154.7 |
| B | 5 | 172 | 65240 | 416.22 | 851 | 833 | 154.7 |
| B | 15 | 33 | 49109 | 311.98 | 851 | 833 | 154.7 |
| C | 14 | 238 | 140333 | 710.18 | 860 | 871 | 196.4 |
| C | 2 | 16 | 51542 | 258.03 | 860 | 871 | 196.4 |
| C | 15 | 208 | 19238 | 93.53 | 860 | 871 | 196.4 |
| D | 1 | 52 | 1124476 | 5650.79 | 837 | 818 | 198.8 |
| D | 12 | 1 | 689006 | 3460.84 | 837 | 818 | 198.8 |
| D | 2 | 250 | 159110 | 796.04 | 837 | 818 | 198.8 |
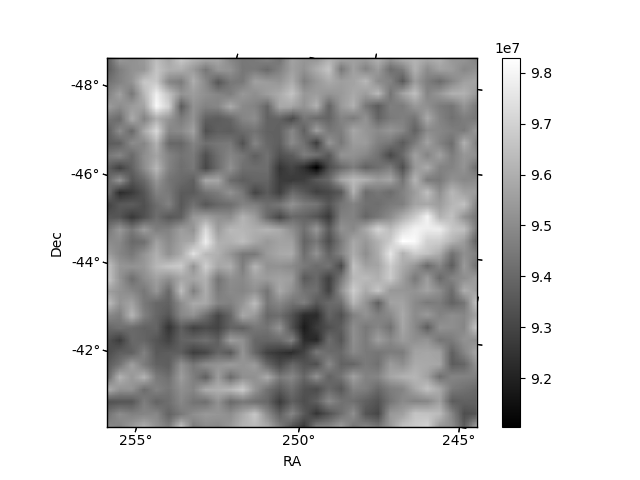
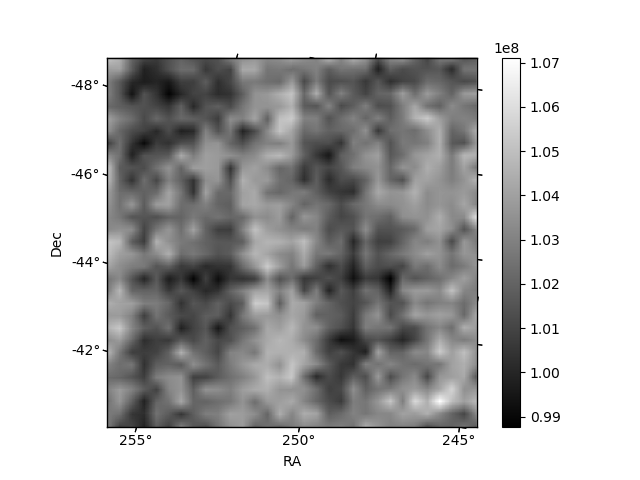
Histogram calculated using DETX and DETY for each event in the final _common_clean file
| Quadrant A |  |
 |
Quadrant B |
|---|---|---|---|
| Quadrant D |  |
 |
Quadrant C |
| Plot type | Count rate plots | Images |
|---|---|---|
| Comparison with Poisson distribution Blue bars denote a histogram of data divided into 1 sec bins. Red curve is a Poisson curve with rate = median count rate of data. |
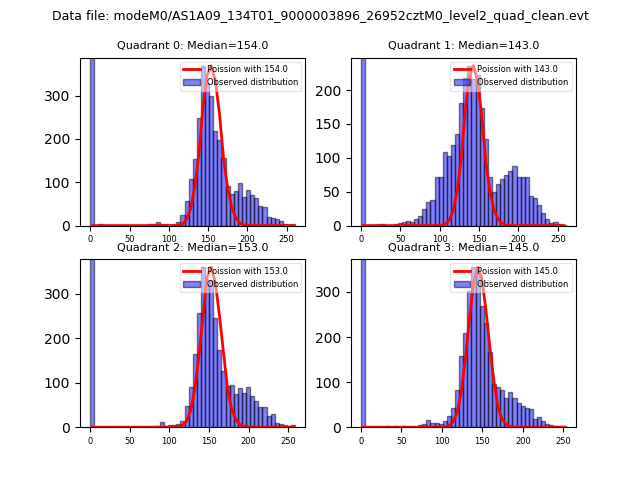 |
 |
| Quadrant-wise count rates Data is divided into 100 sec bins |
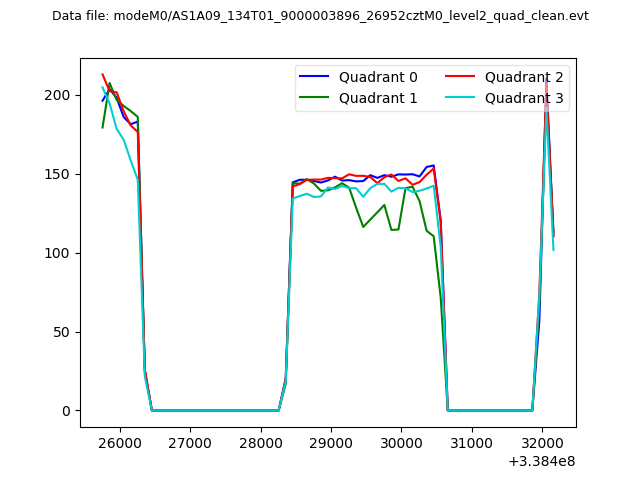 |
|
| Module-wise count rates for Quadrant A Data is divided into 100 sec bins |
 |
 |
| Module-wise count rates for Quadrant B Data is divided into 100 sec bins |
 |
 |
| Module-wise count rates for Quadrant C Data is divided into 100 sec bins |
 |
 |
| Module-wise count rates for Quadrant D Data is divided into 100 sec bins |
 |
 |
| Parameter | Plot |
|---|---|
| CZT HV Monitor |  |
| D_VDD | 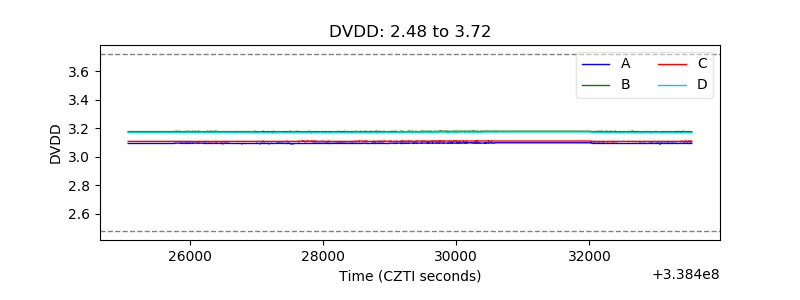 |
| Temperature 1 |  |
| Veto HV Monitor |  |
| Veto LLD |  |
| Alpha Counter |  |
| _CPM_Rate | 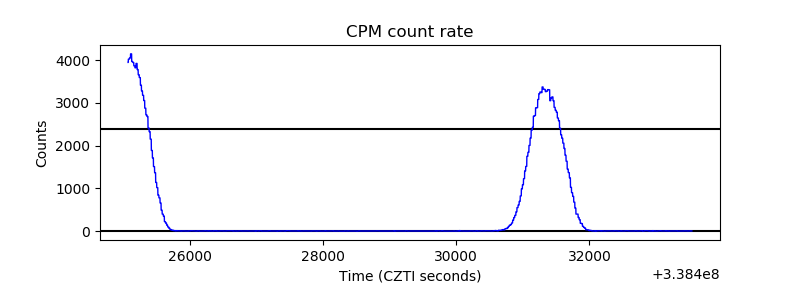 |
| CZT Counter |  |
| +2.5 Volts monitor |  |
| +5 Volts monitor |  |
| _ROLL_ROT |  |
| _Roll_DEC |  |
| _Roll_RA |  |
| Veto Counter |  |