| Param | Original file | Final file |
|---|---|---|
| Filename | modeM0/AS1A09_134T01_9000003896_26953cztM0_level2.evt | modeM0/AS1A09_134T01_9000003896_26953cztM0_level2_quad_clean.evt |
| Size (bytes) | 689,820,480 | 62,291,520 |
| Size | 657.9 MB | 59.4 MB |
| Events in quadrant A | 3,294,809 | 388,749 |
| Events in quadrant B | 8,591,320 | 322,488 |
| Events in quadrant C | 3,398,203 | 387,978 |
| Events in quadrant D | 5,198,956 | 363,989 |
| Mode M9 | |||
|---|---|---|---|
| Quadrant | BADHDUFLAG | Total packets | Discarded packets |
| A | 0 | 13 | 0 |
| B | 0 | 13 | 0 |
| C | 0 | 13 | 0 |
| D | 0 | 13 | 0 |
| Mode M0 | |||
|---|---|---|---|
| Quadrant | BADHDUFLAG | Total packets | Discarded packets |
| A | 0 | 13065 | 0 |
| B | 0 | 29800 | 0 |
| C | 0 | 13471 | 0 |
| D | 0 | 19387 | 0 |
| Quadrant | Total seconds | Saturated seconds | Saturation percentage |
|---|---|---|---|
| A | 6039 | 60 | 0.993542% |
| B | 6040 | 1420 | 23.509934% |
| C | 6040 | 129 | 2.135762% |
| D | 6040 | 496 | 8.211921% |
Noise dominated data is calculated using 1-second bins in cleaned event files. If a bin has >2000 counts, and if more than 50% of those come from <1% of pixels, then it is considered to be noise-dominated and hence unusable.
| Quadrant | # 1 sec bins | Bins with >0 counts | Bins with >2000 counts | High rate bins dominated by noise | Noise dominated (total time) | Noise dominated (detector-on time) | Marked lightcurve |
|---|---|---|---|---|---|---|---|
| A | 7389 | 6040 | 18 | 18 | 0.24% | 0.30% | 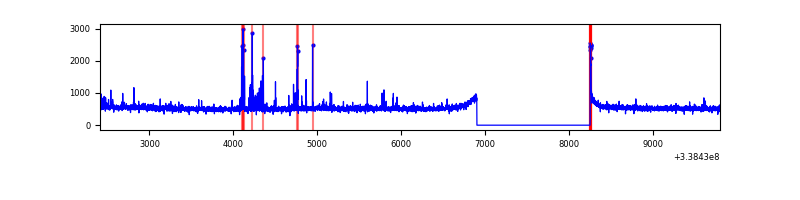 |
| B | 7390 | 6041 | 1044 | 1044 | 14.13% | 17.28% | 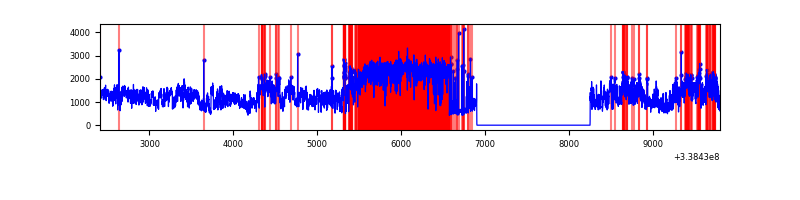 |
| C | 7390 | 6040 | 8 | 8 | 0.11% | 0.13% | 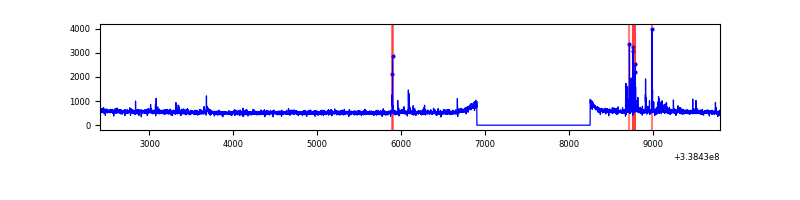 |
| D | 7390 | 6041 | 423 | 423 | 5.72% | 7.00% | 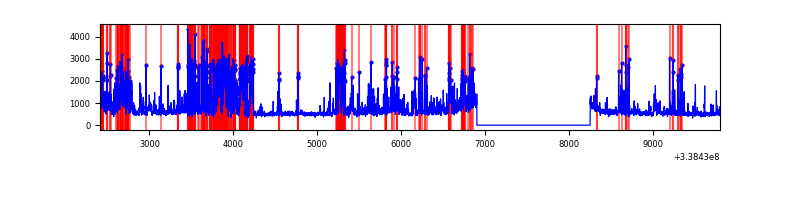 |
Top three noisy pixels from each quadrant. If the there are fewer than three noisy pixels in the level2.evt file, extra rows are filled as -1
| Pixel properties | Quadrant properties | ||||||
|---|---|---|---|---|---|---|---|
| Quadrant | DetID | PixID | Counts | Sigma | Mean | Median | Sigma |
| A | 14 | 235 | 108045 | 666.54 | 816 | 801 | 160.9 |
| A | 8 | 192 | 25768 | 155.17 | 816 | 801 | 160.9 |
| A | 0 | 13 | 18069 | 107.32 | 816 | 801 | 160.9 |
| B | 0 | 189 | 5458775 | 38822.22 | 764 | 749 | 140.6 |
| B | 3 | 112 | 95390 | 673.17 | 764 | 749 | 140.6 |
| B | 0 | 219 | 20172 | 138.15 | 764 | 749 | 140.6 |
| C | 14 | 238 | 132201 | 722.62 | 798 | 807 | 181.8 |
| C | 2 | 16 | 112421 | 613.84 | 798 | 807 | 181.8 |
| C | 0 | 207 | 33387 | 179.18 | 798 | 807 | 181.8 |
| D | 1 | 52 | 1742936 | 9590.03 | 777 | 758 | 181.7 |
| D | 2 | 250 | 241880 | 1327.29 | 777 | 758 | 181.7 |
| D | 12 | 1 | 204308 | 1120.47 | 777 | 758 | 181.7 |
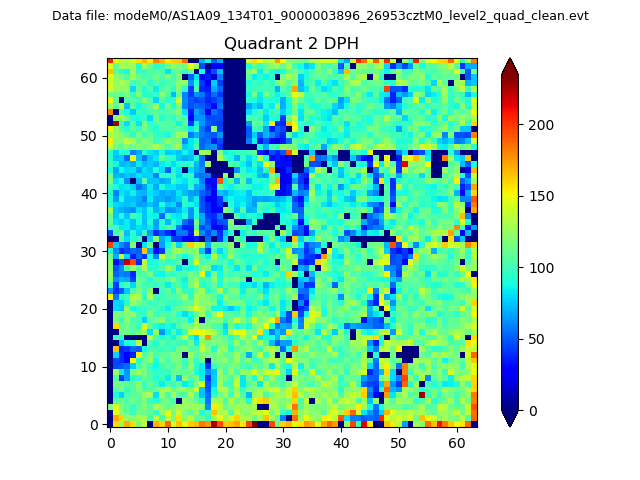
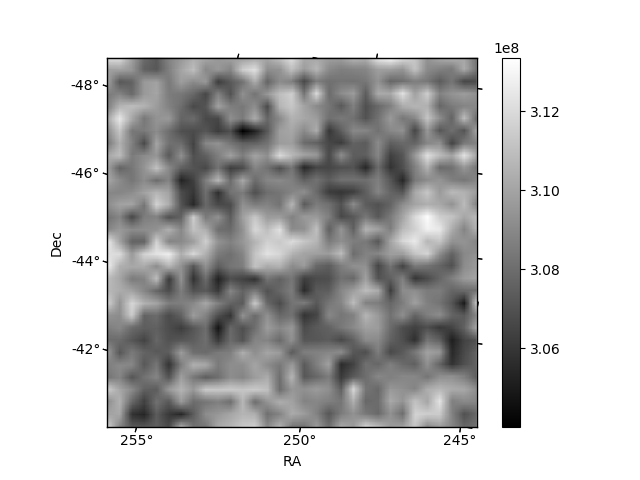
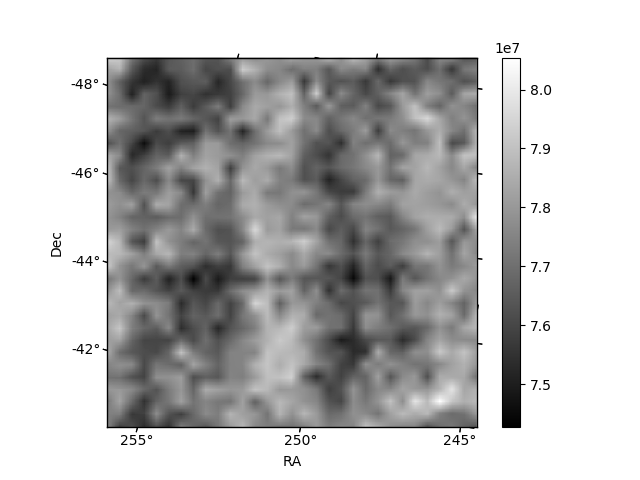
Histogram calculated using DETX and DETY for each event in the final _common_clean file
| Quadrant A | 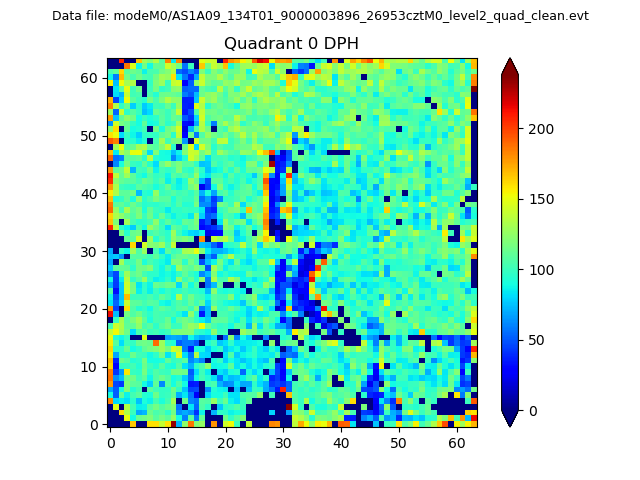 |
 |
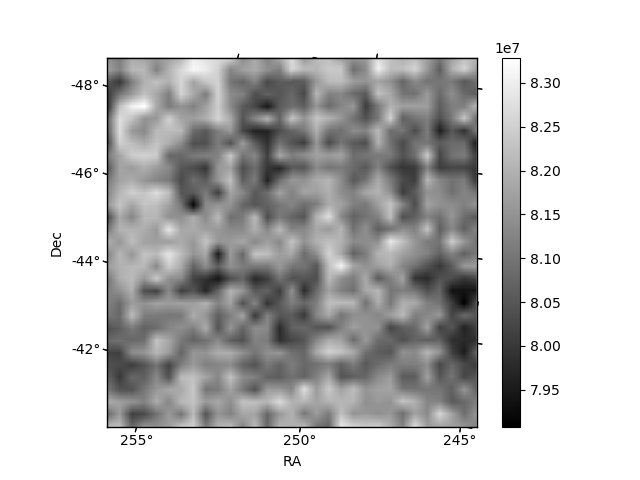
Quadrant B |
|---|---|---|---|
| Quadrant D | 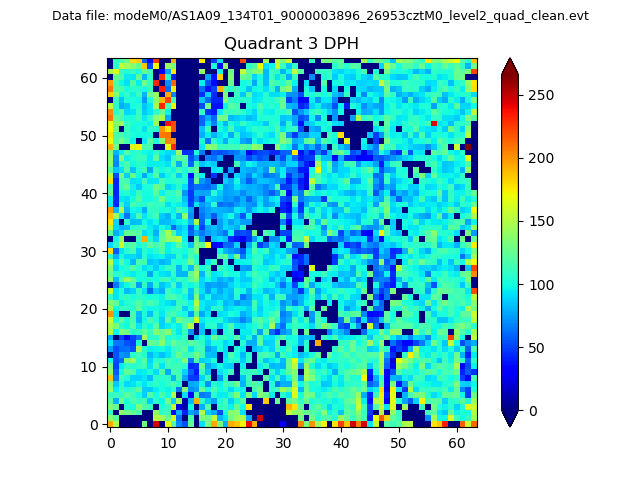 |
 |
Quadrant C |
| Plot type | Count rate plots | Images |
|---|---|---|
| Comparison with Poisson distribution Blue bars denote a histogram of data divided into 1 sec bins. Red curve is a Poisson curve with rate = median count rate of data. |
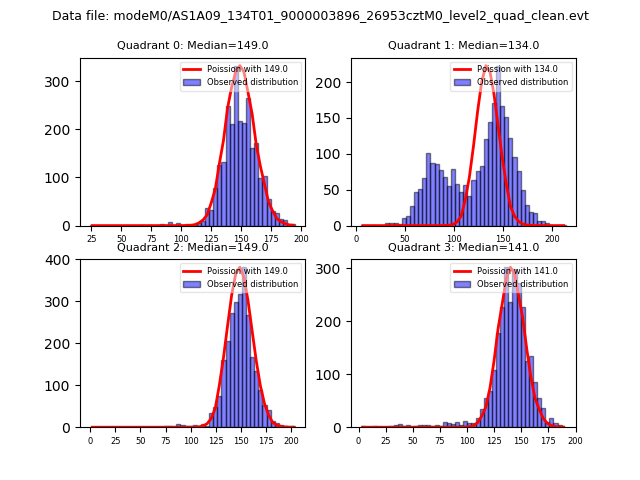 |
 |
| Quadrant-wise count rates Data is divided into 100 sec bins |
 |
|
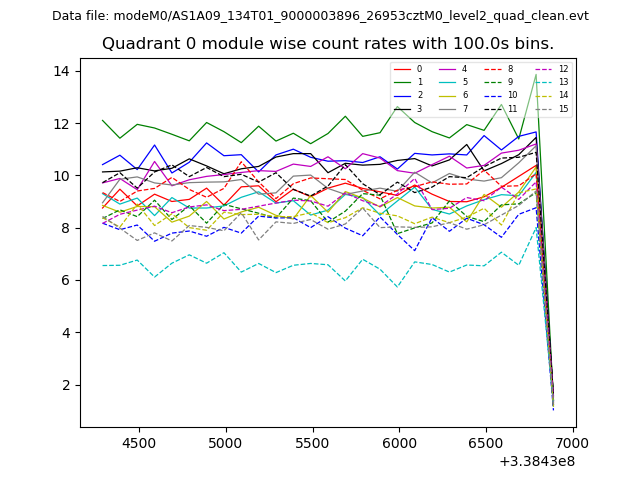
| Module-wise count rates for Quadrant A Data is divided into 100 sec bins |
 |
 |
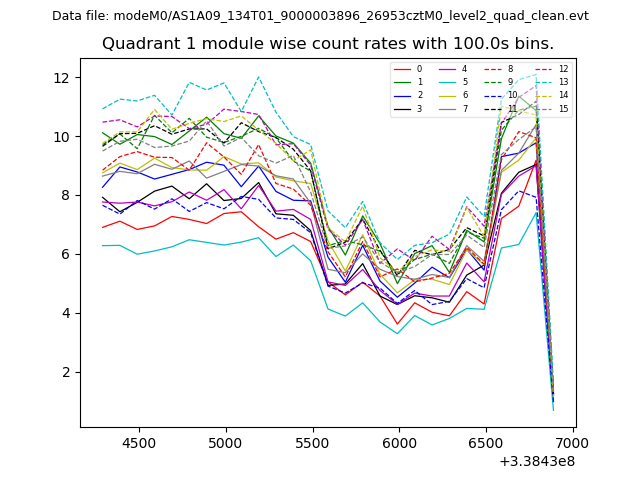
| Module-wise count rates for Quadrant B Data is divided into 100 sec bins |
 |
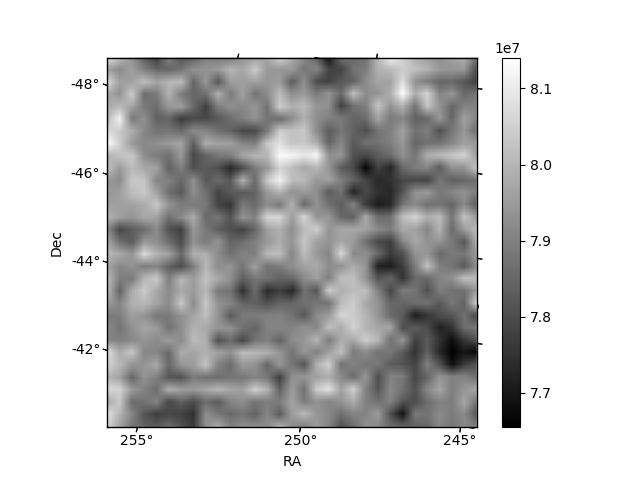 |
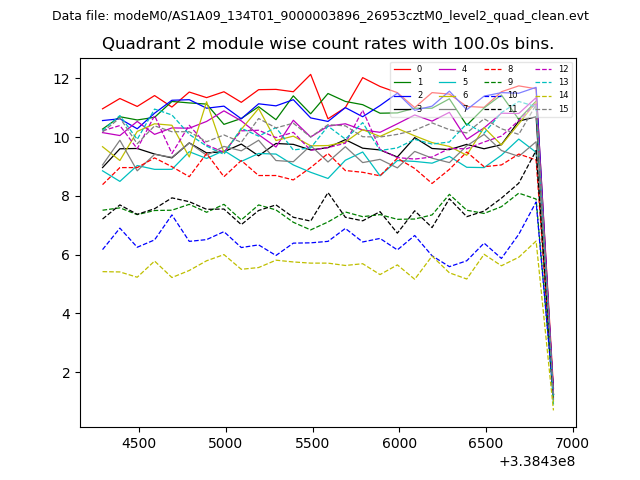
| Module-wise count rates for Quadrant C Data is divided into 100 sec bins |
 |
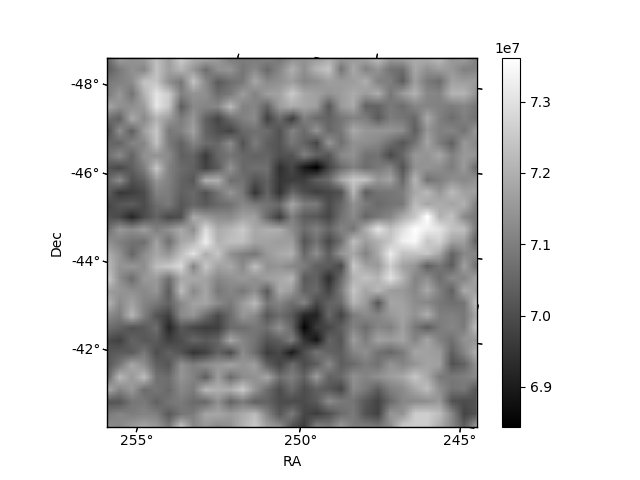 |
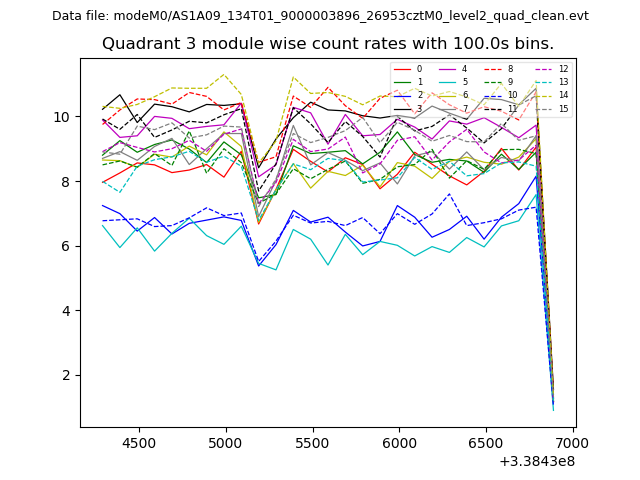
| Module-wise count rates for Quadrant D Data is divided into 100 sec bins |
 |
 |
| Parameter | Plot |
|---|---|
| CZT HV Monitor | 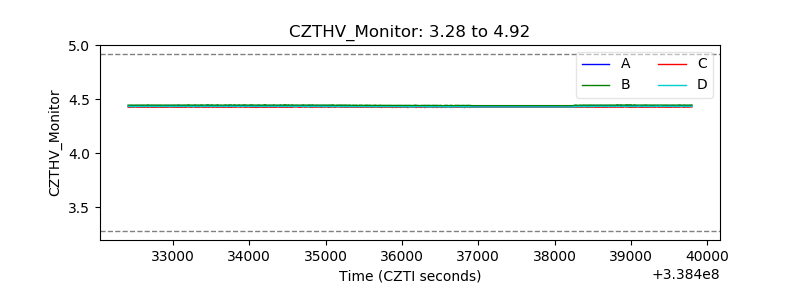 |
| D_VDD | 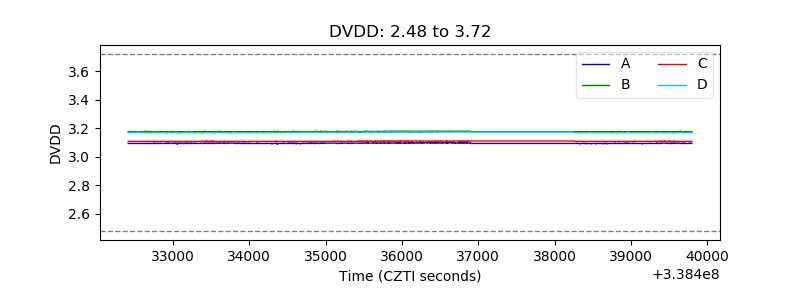 |
| Temperature 1 | 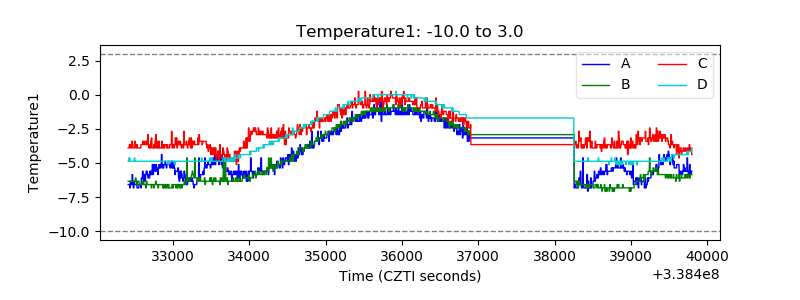 |
| Veto HV Monitor | 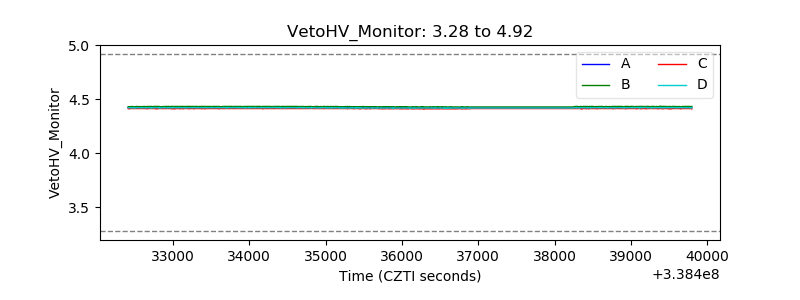 |
| Veto LLD | 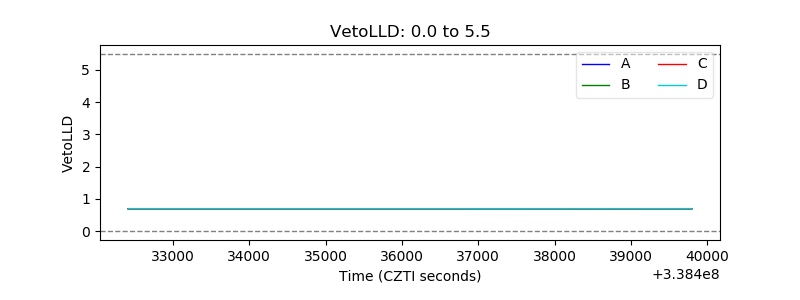 |
| Alpha Counter | 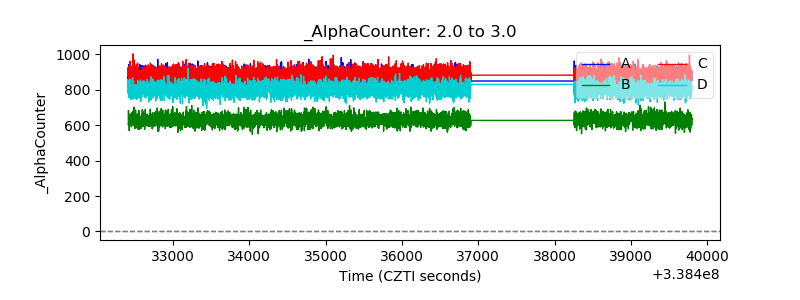 |
| _CPM_Rate | 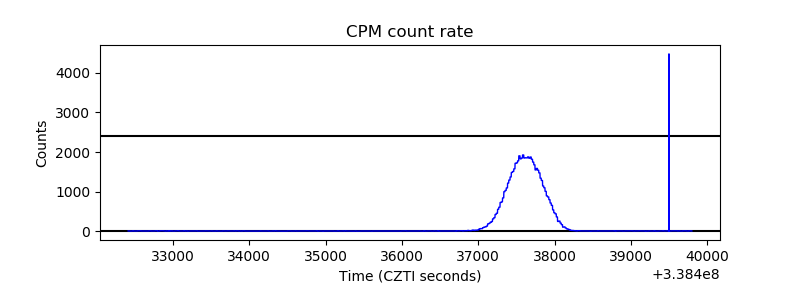 |
| CZT Counter | 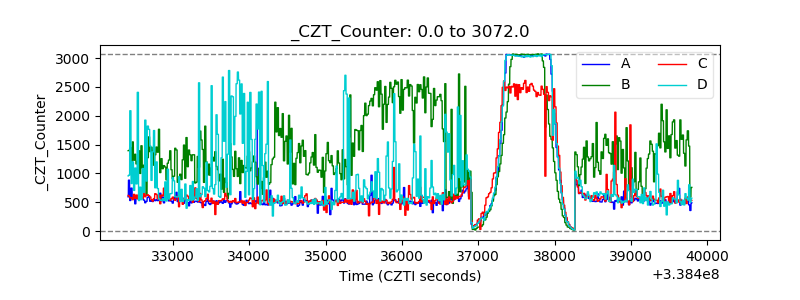 |
| +2.5 Volts monitor |  |
| +5 Volts monitor |  |
| _ROLL_ROT | 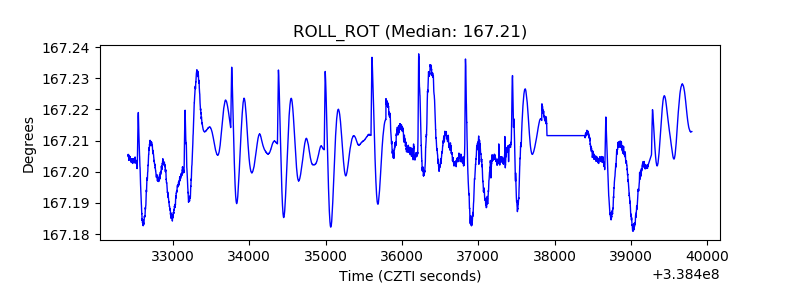 |
| _Roll_DEC | 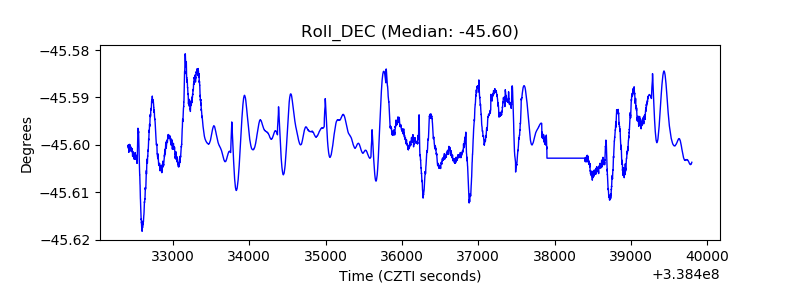 |
| _Roll_RA |  |
| Veto Counter | 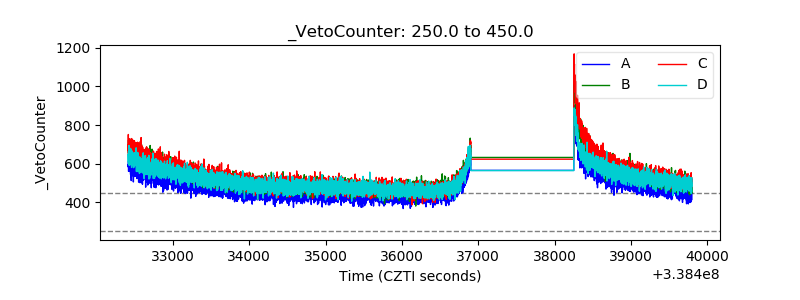 |