| Param | Original file | Final file |
|---|---|---|
| Filename | modeM0/AS1A09_134T01_9000003896_26954cztM0_level2.evt | modeM0/AS1A09_134T01_9000003896_26954cztM0_level2_quad_clean.evt |
| Size (bytes) | 696,173,760 | 71,758,080 |
| Size | 663.9 MB | 68.4 MB |
| Events in quadrant A | 3,321,737 | 462,286 |
| Events in quadrant B | 9,593,129 | 365,244 |
| Events in quadrant C | 3,667,818 | 460,664 |
| Events in quadrant D | 4,067,863 | 436,502 |
| Mode M9 | |||
|---|---|---|---|
| Quadrant | BADHDUFLAG | Total packets | Discarded packets |
| A | 0 | 12 | 0 |
| B | 0 | 12 | 0 |
| C | 0 | 12 | 0 |
| D | 0 | 12 | 0 |
| Mode M0 | |||
|---|---|---|---|
| Quadrant | BADHDUFLAG | Total packets | Discarded packets |
| A | 0 | 13402 | 0 |
| B | 0 | 32937 | 0 |
| C | 0 | 14590 | 0 |
| D | 0 | 16108 | 0 |
| Quadrant | Total seconds | Saturated seconds | Saturation percentage |
|---|---|---|---|
| A | 6412 | 81 | 1.263256% |
| B | 6412 | 2284 | 35.620711% |
| C | 6413 | 180 | 2.806799% |
| D | 6413 | 231 | 3.602058% |
Noise dominated data is calculated using 1-second bins in cleaned event files. If a bin has >2000 counts, and if more than 50% of those come from <1% of pixels, then it is considered to be noise-dominated and hence unusable.
| Quadrant | # 1 sec bins | Bins with >0 counts | Bins with >2000 counts | High rate bins dominated by noise | Noise dominated (total time) | Noise dominated (detector-on time) | Marked lightcurve |
|---|---|---|---|---|---|---|---|
| A | 7567 | 6412 | 3 | 3 | 0.04% | 0.05% | 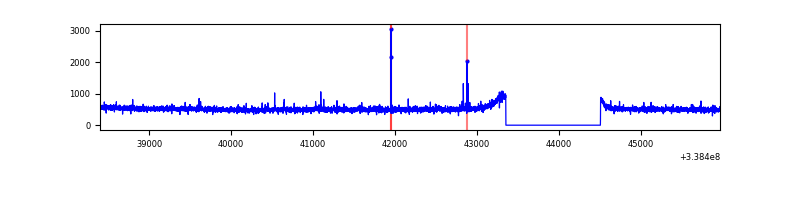 |
| B | 7567 | 6412 | 1733 | 1733 | 22.90% | 27.03% | 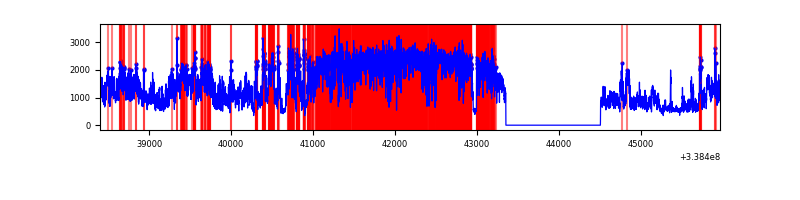 |
| C | 7568 | 6413 | 17 | 17 | 0.22% | 0.27% | 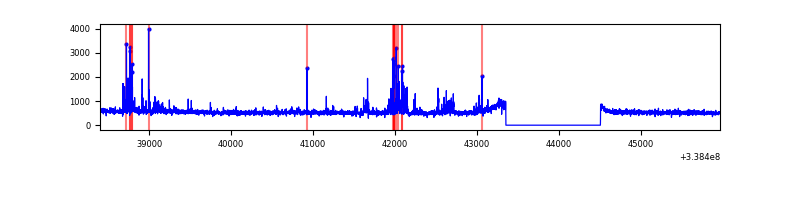 |
| D | 7568 | 6413 | 102 | 102 | 1.35% | 1.59% | 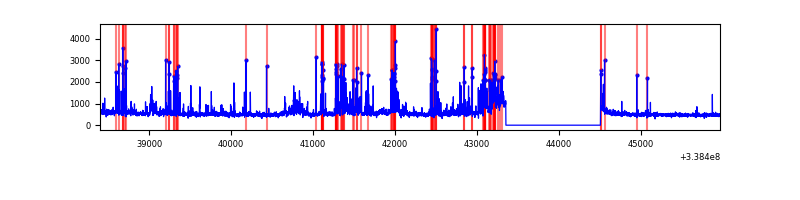 |
Top three noisy pixels from each quadrant. If the there are fewer than three noisy pixels in the level2.evt file, extra rows are filled as -1
| Pixel properties | Quadrant properties | ||||||
|---|---|---|---|---|---|---|---|
| Quadrant | DetID | PixID | Counts | Sigma | Mean | Median | Sigma |
| A | 14 | 235 | 26285 | 151.74 | 849 | 835 | 167.7 |
| A | 6 | 16 | 12585 | 70.05 | 849 | 835 | 167.7 |
| A | 13 | 254 | 10520 | 57.74 | 849 | 835 | 167.7 |
| B | 0 | 189 | 6512659 | 45200.66 | 771 | 755 | 144.1 |
| B | 0 | 219 | 22684 | 152.21 | 771 | 755 | 144.1 |
| B | 12 | 111 | 16747 | 111.0 | 771 | 755 | 144.1 |
| C | 2 | 16 | 308576 | 1629.13 | 824 | 830 | 188.9 |
| C | 14 | 238 | 134374 | 706.95 | 824 | 830 | 188.9 |
| C | 15 | 208 | 10525 | 51.32 | 824 | 830 | 188.9 |
| D | 1 | 52 | 618965 | 3199.24 | 819 | 798 | 193.2 |
| D | 2 | 250 | 168588 | 868.37 | 819 | 798 | 193.2 |
| D | 15 | 145 | 89095 | 456.97 | 819 | 798 | 193.2 |
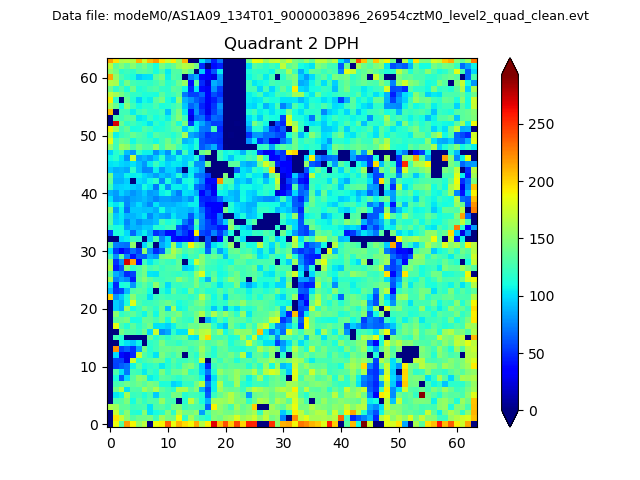
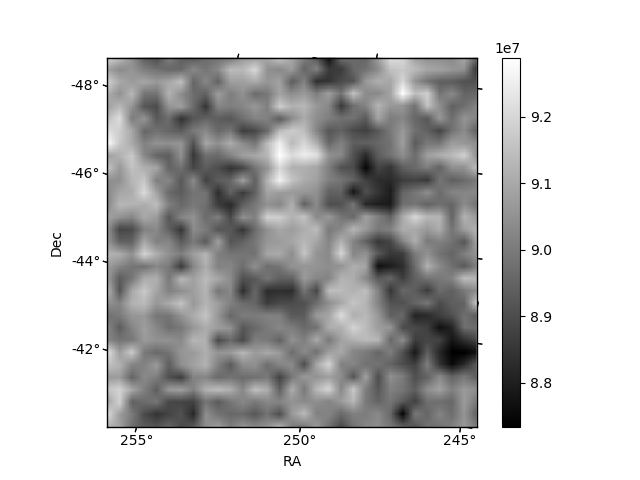
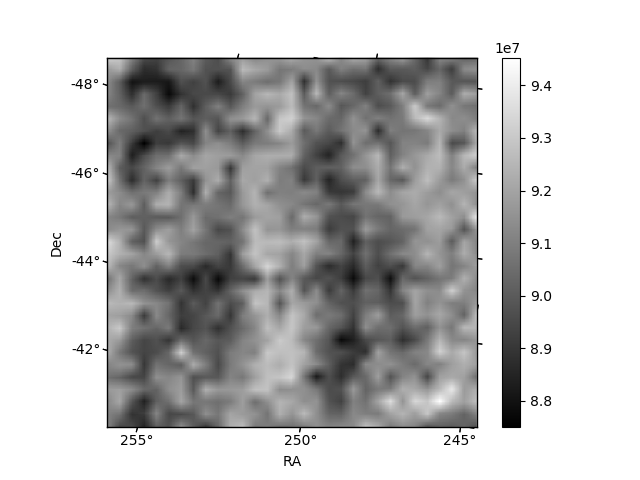
Histogram calculated using DETX and DETY for each event in the final _common_clean file
| Quadrant A | 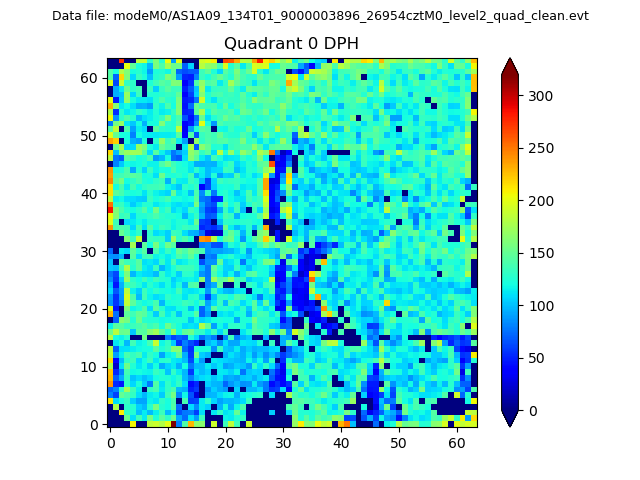 |
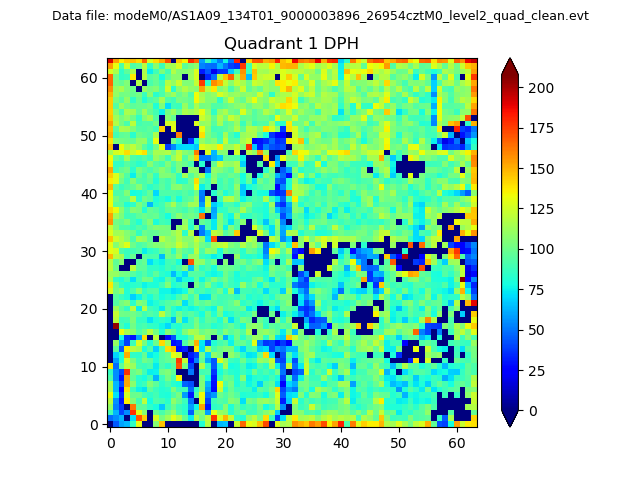 |
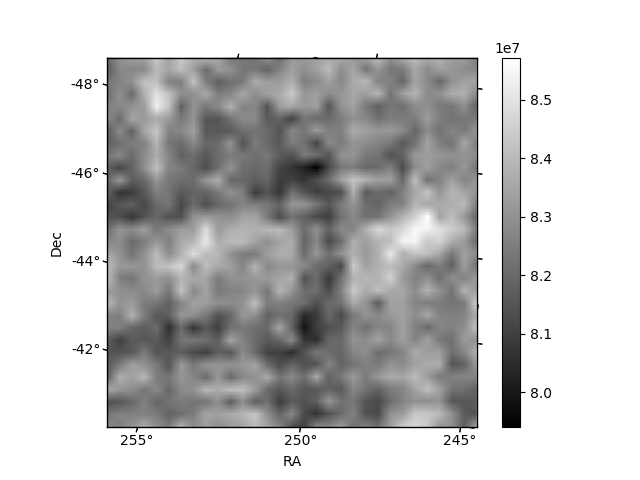
Quadrant B |
|---|---|---|---|
| Quadrant D | 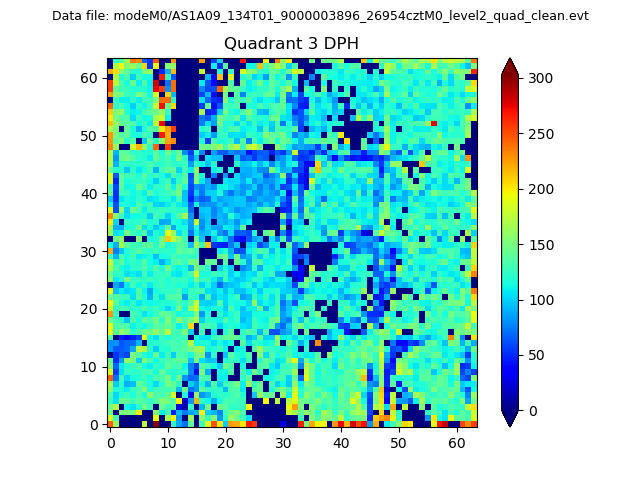 |
 |
Quadrant C |
| Plot type | Count rate plots | Images |
|---|---|---|
| Comparison with Poisson distribution Blue bars denote a histogram of data divided into 1 sec bins. Red curve is a Poisson curve with rate = median count rate of data. |
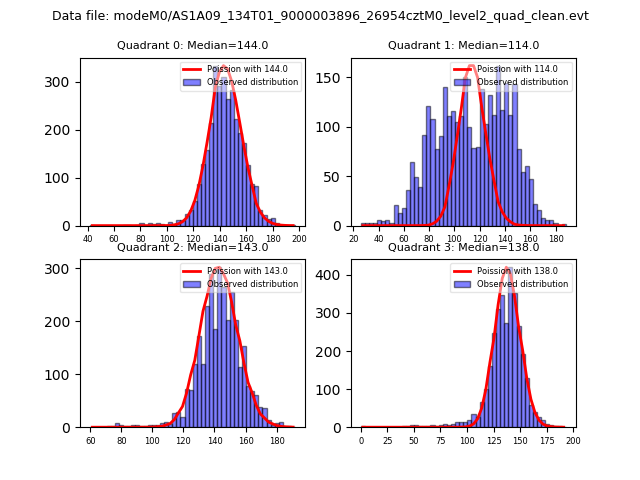 |
 |
| Quadrant-wise count rates Data is divided into 100 sec bins |
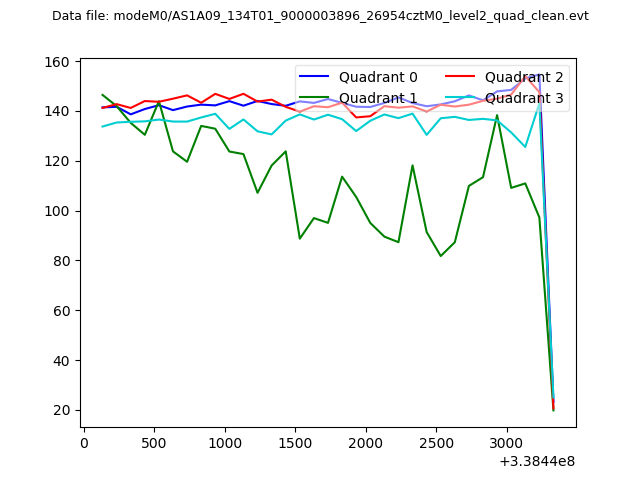 |
|
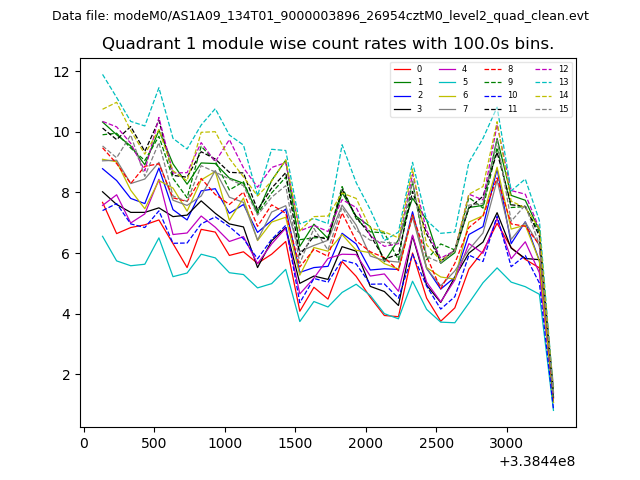
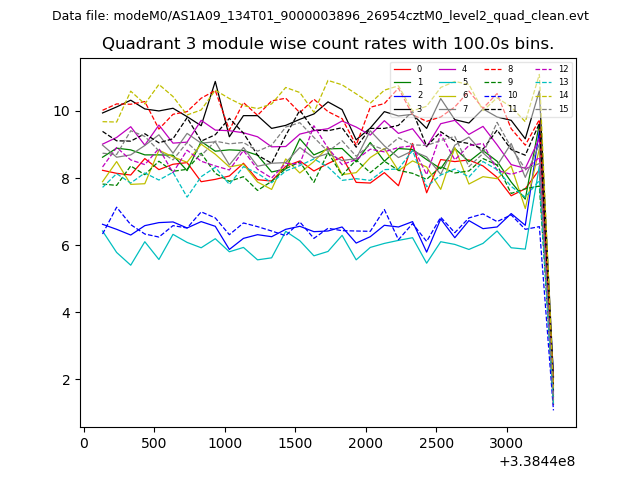
| Module-wise count rates for Quadrant A Data is divided into 100 sec bins |
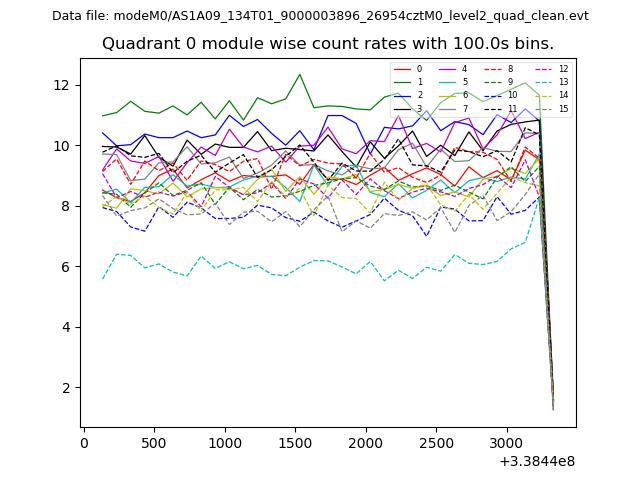 |
 |
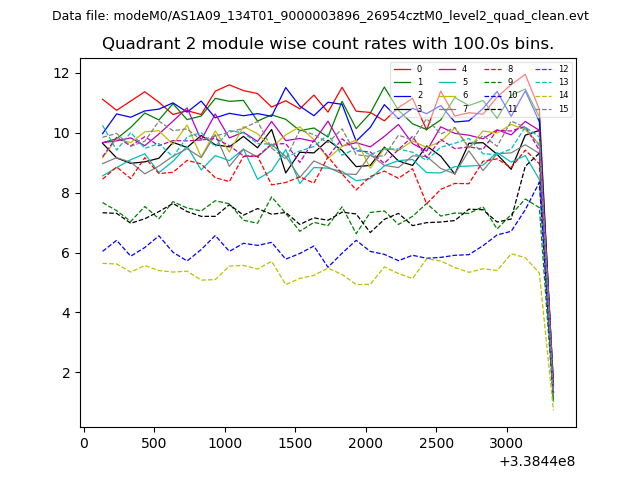
| Module-wise count rates for Quadrant B Data is divided into 100 sec bins |
 |
 |
| Module-wise count rates for Quadrant C Data is divided into 100 sec bins |
 |
 |
| Module-wise count rates for Quadrant D Data is divided into 100 sec bins |
 |
 |
| Parameter | Plot |
|---|---|
| CZT HV Monitor | 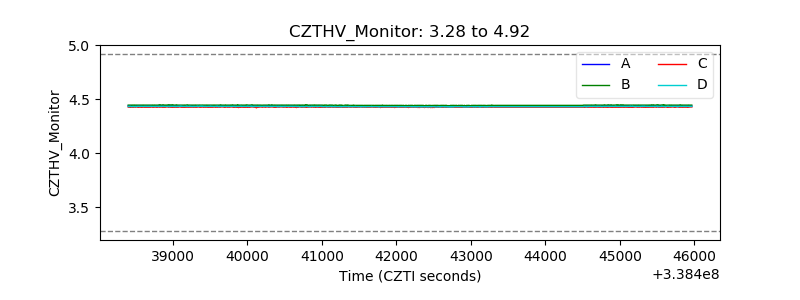 |
| D_VDD | 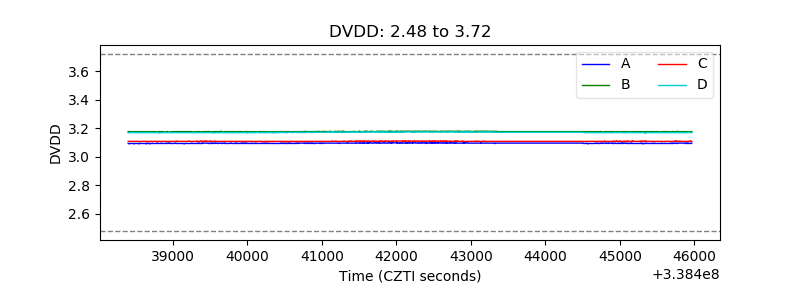 |
| Temperature 1 | 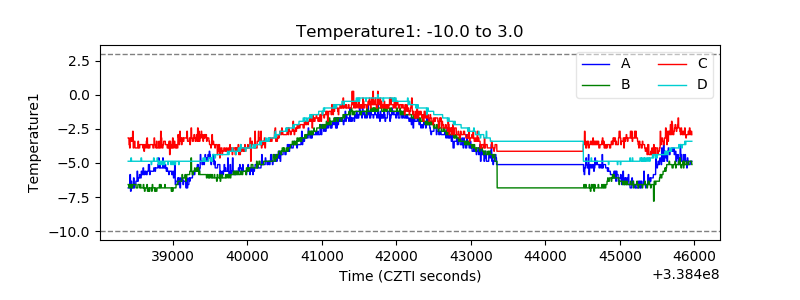 |
| Veto HV Monitor | 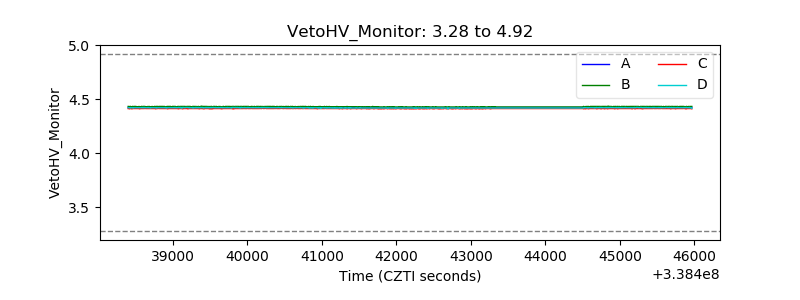 |
| Veto LLD | 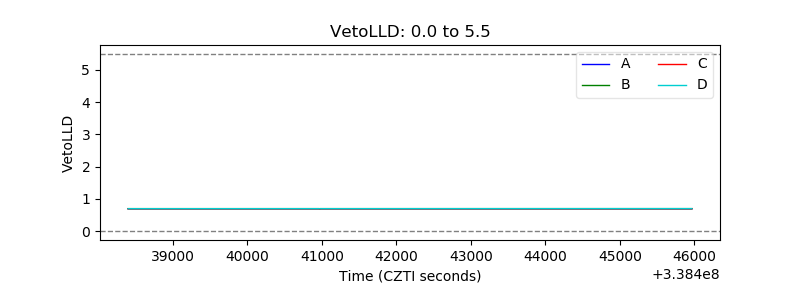 |
| Alpha Counter | 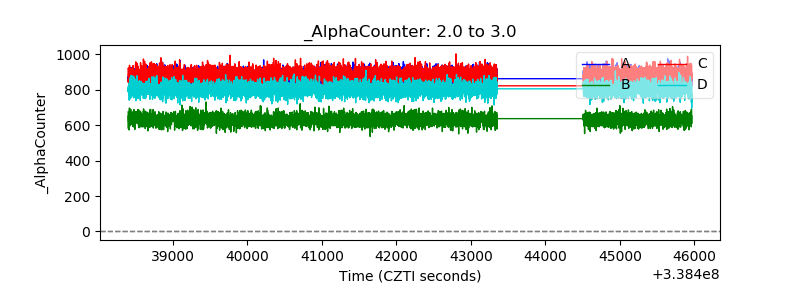 |
| _CPM_Rate | 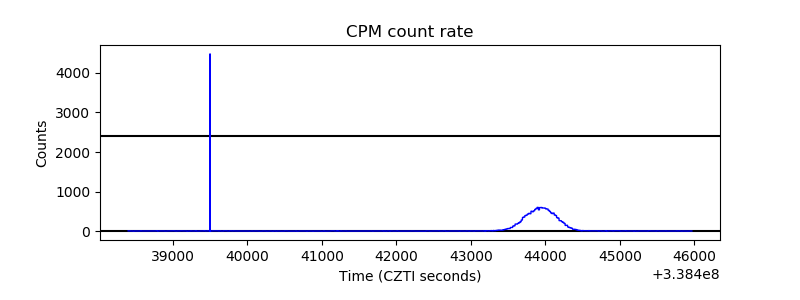 |
| CZT Counter |  |
| +2.5 Volts monitor |  |
| +5 Volts monitor |  |
| _ROLL_ROT | 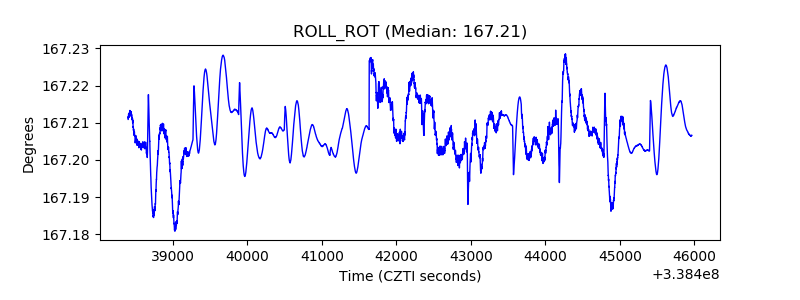 |
| _Roll_DEC | 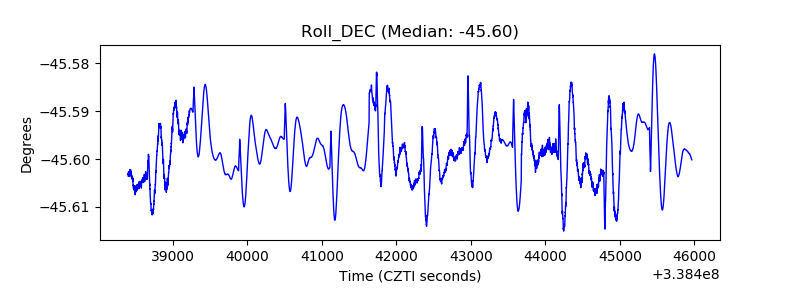 |
| _Roll_RA | 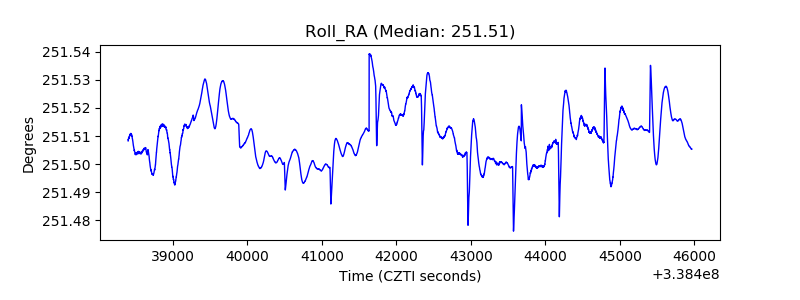 |
| Veto Counter | 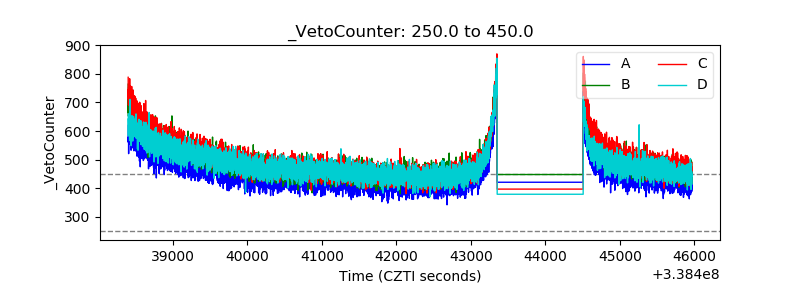 |