| Param | Original file | Final file |
|---|---|---|
| Filename | modeM0/AS1A09_134T01_9000003896_26955cztM0_level2.evt | modeM0/AS1A09_134T01_9000003896_26955cztM0_level2_quad_clean.evt |
| Size (bytes) | 688,982,400 | 86,495,040 |
| Size | 657.1 MB | 82.5 MB |
| Events in quadrant A | 4,328,933 | 556,519 |
| Events in quadrant B | 8,393,530 | 505,128 |
| Events in quadrant C | 3,502,010 | 551,749 |
| Events in quadrant D | 4,178,783 | 528,993 |
| Mode M9 | |||
|---|---|---|---|
| Quadrant | BADHDUFLAG | Total packets | Discarded packets |
| A | 0 | 8 | 0 |
| B | 0 | 8 | 0 |
| C | 0 | 8 | 0 |
| D | 0 | 8 | 0 |
| Mode M0 | |||
|---|---|---|---|
| Quadrant | BADHDUFLAG | Total packets | Discarded packets |
| A | 0 | 17026 | 0 |
| B | 0 | 29596 | 0 |
| C | 0 | 14360 | 0 |
| D | 0 | 16691 | 0 |
| Quadrant | Total seconds | Saturated seconds | Saturation percentage |
|---|---|---|---|
| A | 6839 | 416 | 6.082761% |
| B | 6840 | 1833 | 26.798246% |
| C | 6839 | 216 | 3.158356% |
| D | 6839 | 218 | 3.187601% |
Noise dominated data is calculated using 1-second bins in cleaned event files. If a bin has >2000 counts, and if more than 50% of those come from <1% of pixels, then it is considered to be noise-dominated and hence unusable.
| Quadrant | # 1 sec bins | Bins with >0 counts | Bins with >2000 counts | High rate bins dominated by noise | Noise dominated (total time) | Noise dominated (detector-on time) | Marked lightcurve |
|---|---|---|---|---|---|---|---|
| A | 7569 | 6839 | 229 | 229 | 3.03% | 3.35% | 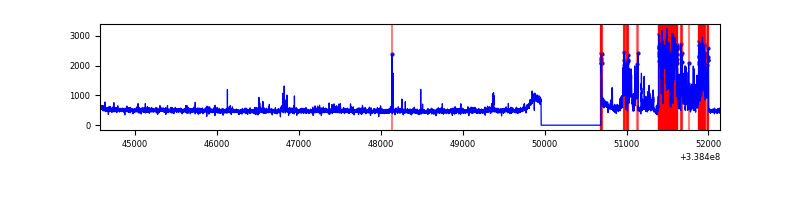 |
| B | 7570 | 6840 | 1170 | 1170 | 15.46% | 17.11% | 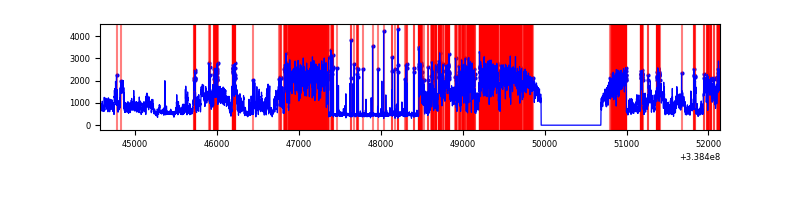 |
| C | 7569 | 6839 | 9 | 9 | 0.12% | 0.13% | 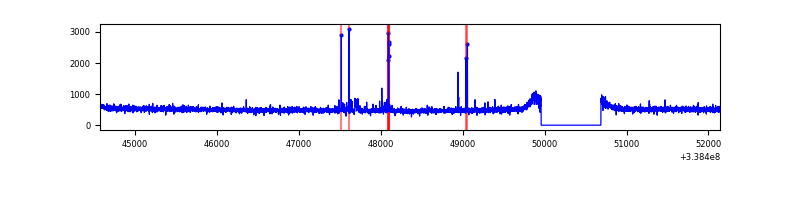 |
| D | 7569 | 6839 | 103 | 103 | 1.36% | 1.51% | 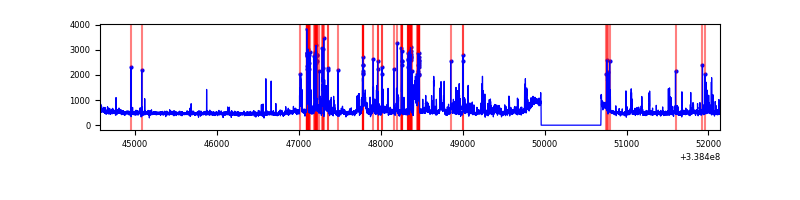 |
Top three noisy pixels from each quadrant. If the there are fewer than three noisy pixels in the level2.evt file, extra rows are filled as -1
| Pixel properties | Quadrant properties | ||||||
|---|---|---|---|---|---|---|---|
| Quadrant | DetID | PixID | Counts | Sigma | Mean | Median | Sigma |
| A | 6 | 16 | 953923 | 5543.87 | 861 | 844 | 171.9 |
| A | 8 | 192 | 23285 | 130.53 | 861 | 844 | 171.9 |
| A | 0 | 13 | 20802 | 116.09 | 861 | 844 | 171.9 |
| B | 0 | 189 | 5157152 | 33499.62 | 808 | 787 | 153.9 |
| B | 12 | 111 | 17996 | 111.8 | 808 | 787 | 153.9 |
| B | 0 | 219 | 16031 | 99.04 | 808 | 787 | 153.9 |
| C | 14 | 238 | 136000 | 687.47 | 844 | 852 | 196.6 |
| C | 0 | 207 | 48534 | 242.55 | 844 | 852 | 196.6 |
| C | 15 | 208 | 14628 | 70.08 | 844 | 852 | 196.6 |
| D | 1 | 52 | 391165 | 1948.94 | 844 | 822 | 200.3 |
| D | 7 | 38 | 258386 | 1285.99 | 844 | 822 | 200.3 |
| D | 11 | 176 | 158385 | 786.7 | 844 | 822 | 200.3 |
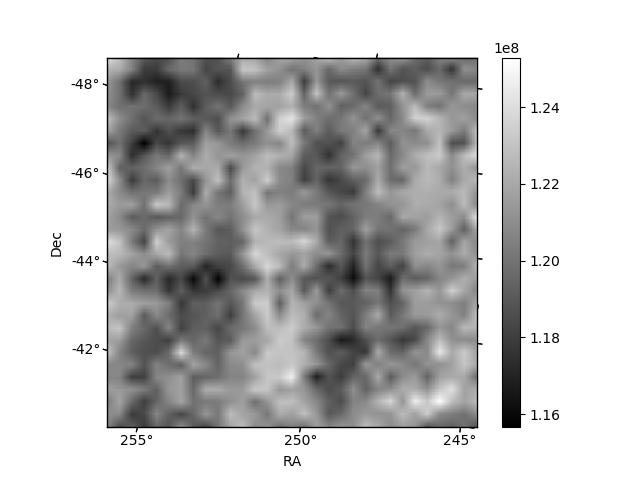
Histogram calculated using DETX and DETY for each event in the final _common_clean file
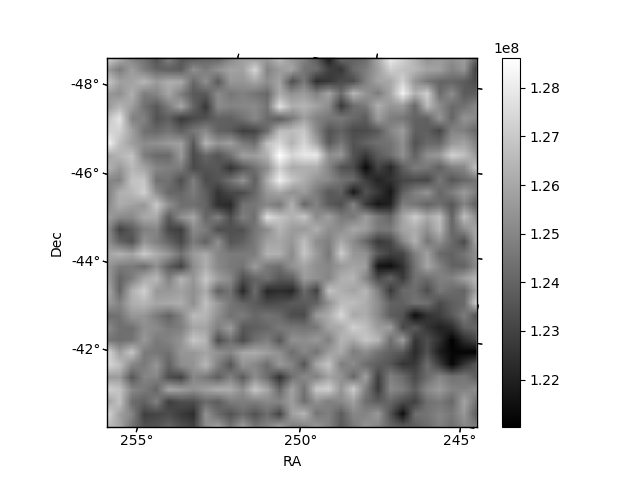
| Quadrant A | 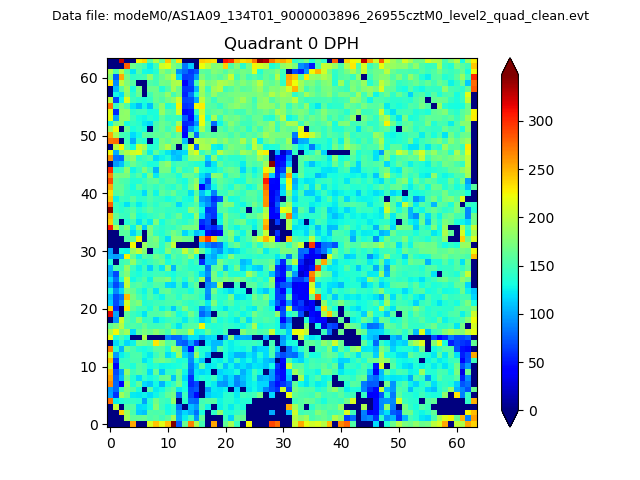 |
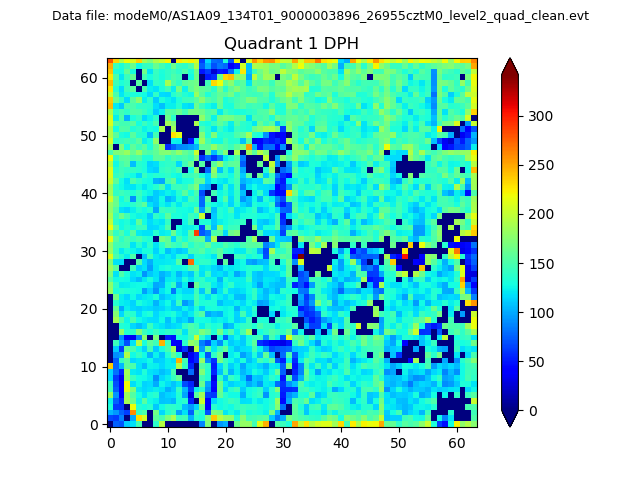 |
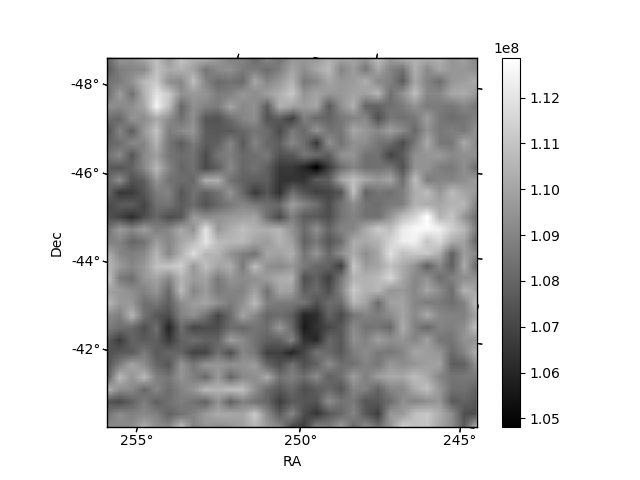
Quadrant B |
|---|---|---|---|
| Quadrant D | 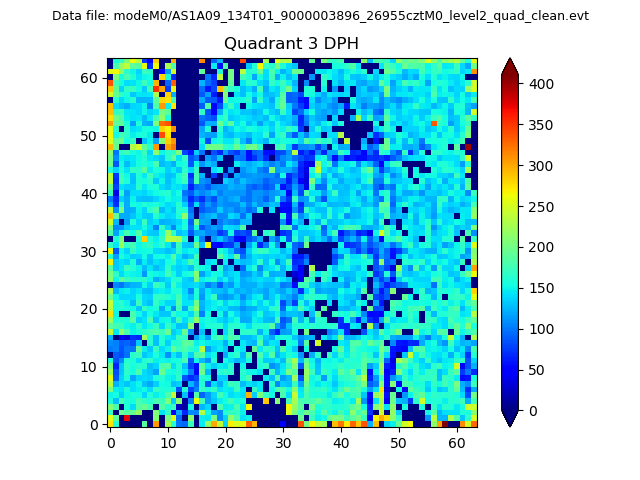 |
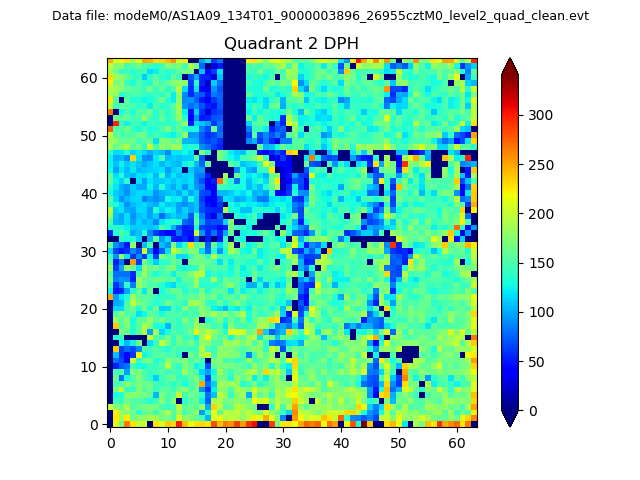 |
Quadrant C |
| Plot type | Count rate plots | Images |
|---|---|---|
| Comparison with Poisson distribution Blue bars denote a histogram of data divided into 1 sec bins. Red curve is a Poisson curve with rate = median count rate of data. |
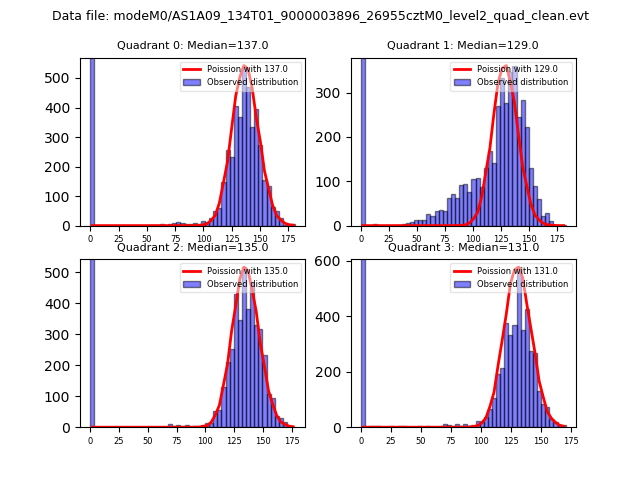 |
 |
| Quadrant-wise count rates Data is divided into 100 sec bins |
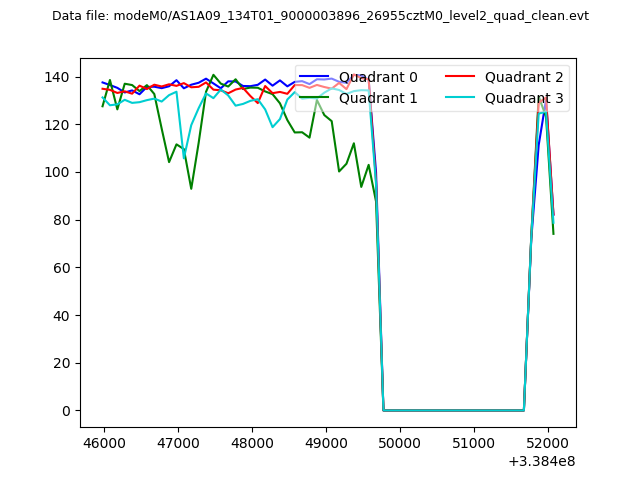 |
|
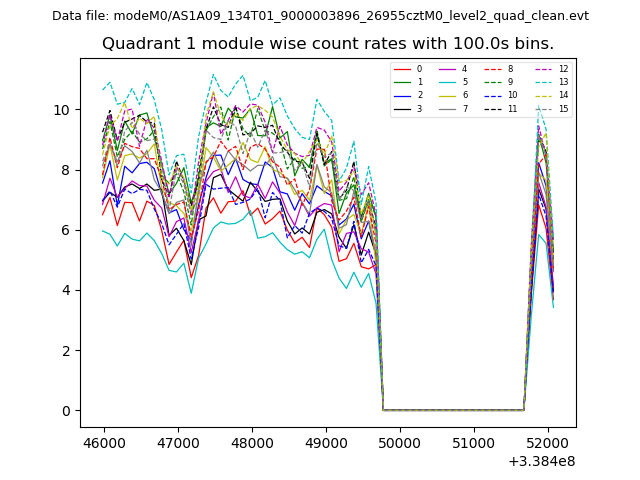
| Module-wise count rates for Quadrant A Data is divided into 100 sec bins |
 |
 |
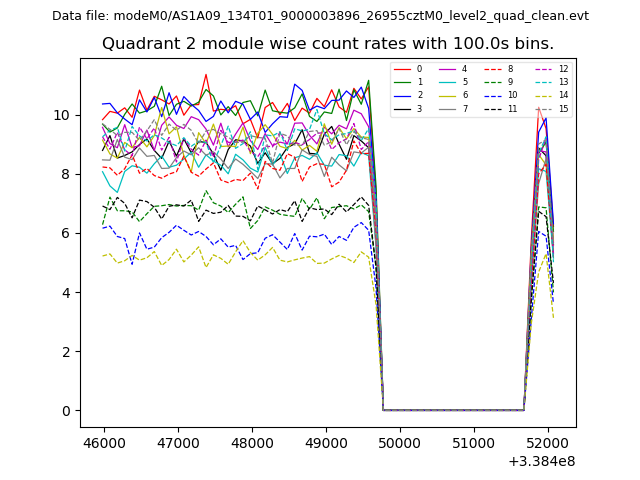
| Module-wise count rates for Quadrant B Data is divided into 100 sec bins |
 |
 |
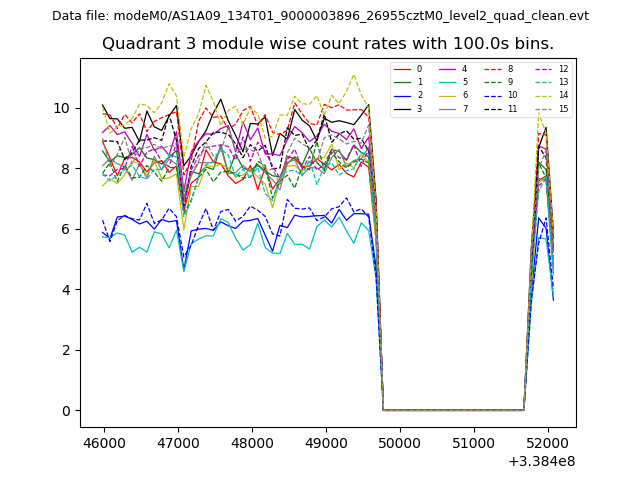
| Module-wise count rates for Quadrant C Data is divided into 100 sec bins |
 |
 |
| Module-wise count rates for Quadrant D Data is divided into 100 sec bins |
 |
 |
| Parameter | Plot |
|---|---|
| CZT HV Monitor |  |
| D_VDD | 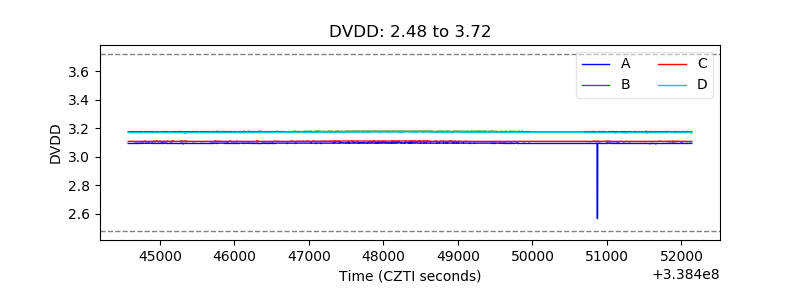 |
| Temperature 1 | 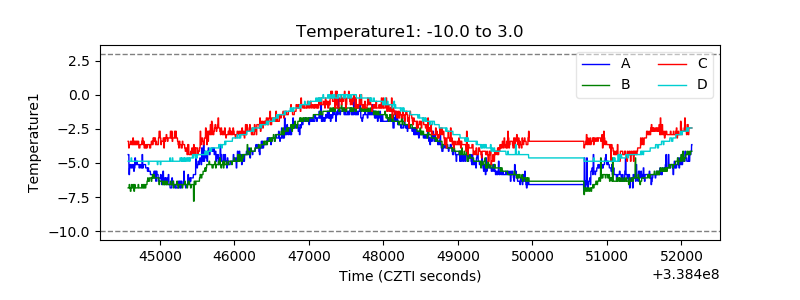 |
| Veto HV Monitor | 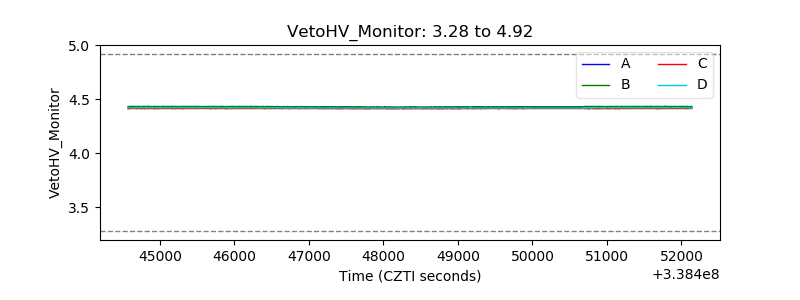 |
| Veto LLD | 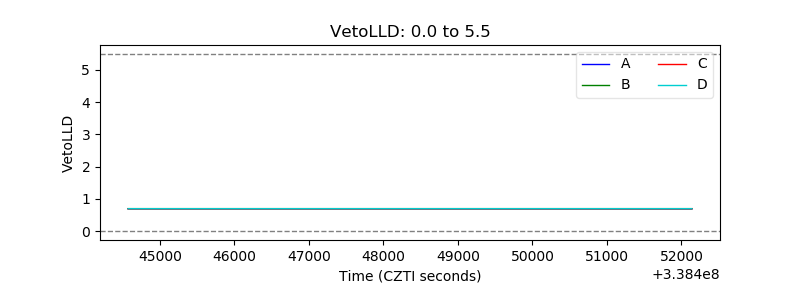 |
| Alpha Counter | 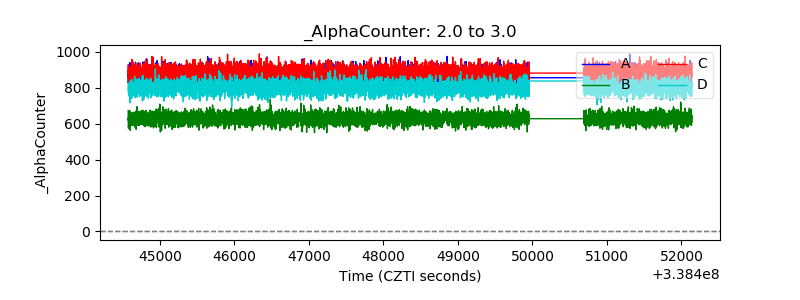 |
| _CPM_Rate | 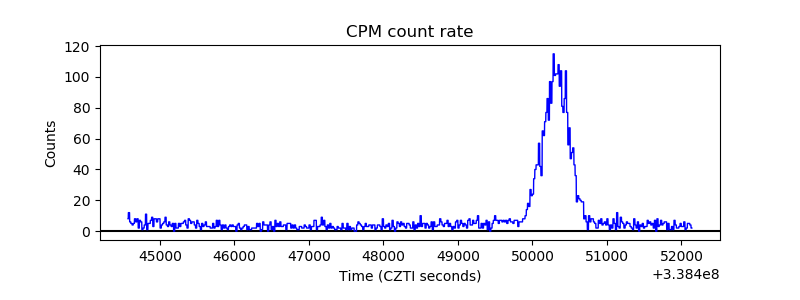 |
| CZT Counter | 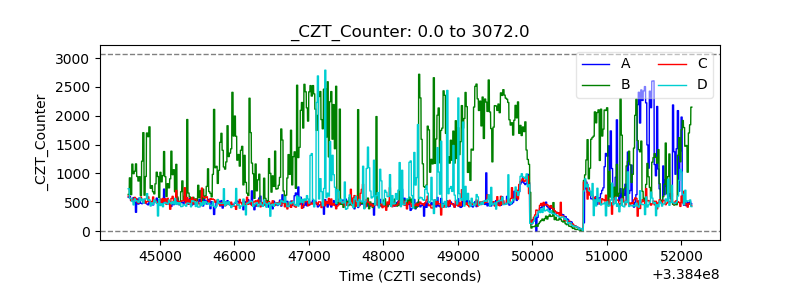 |
| +2.5 Volts monitor |  |
| +5 Volts monitor |  |
| _ROLL_ROT | 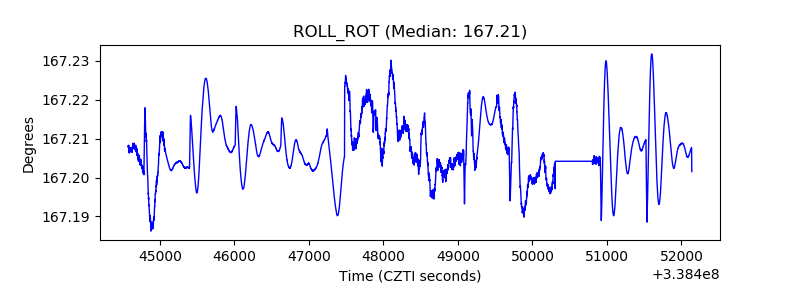 |
| _Roll_DEC | 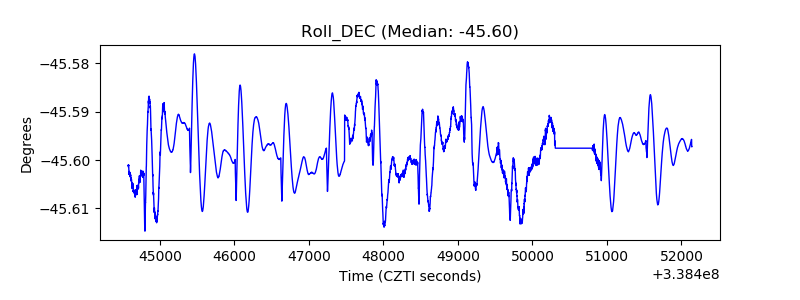 |
| _Roll_RA | 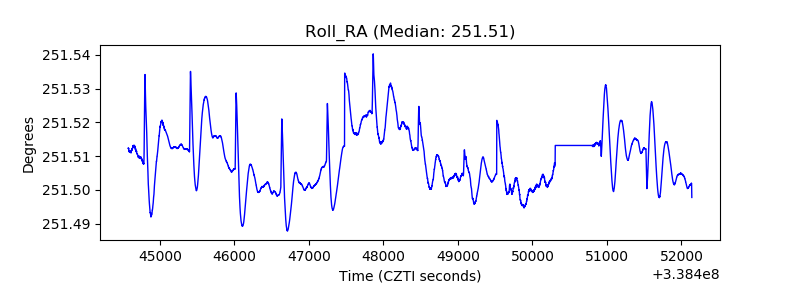 |
| Veto Counter | 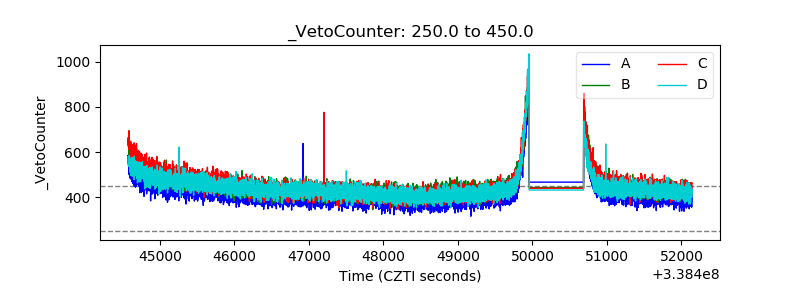 |