| Param | Original file | Final file |
|---|---|---|
| Filename | modeM0/AS1A09_134T01_9000003896_26956cztM0_level2.evt | modeM0/AS1A09_134T01_9000003896_26956cztM0_level2_quad_clean.evt |
| Size (bytes) | 925,767,360 | 87,863,040 |
| Size | 882.9 MB | 83.8 MB |
| Events in quadrant A | 4,903,915 | 585,882 |
| Events in quadrant B | 13,715,236 | 430,576 |
| Events in quadrant C | 3,623,554 | 587,738 |
| Events in quadrant D | 5,302,019 | 547,871 |
| Mode M9 | |||
|---|---|---|---|
| Quadrant | BADHDUFLAG | Total packets | Discarded packets |
| A | 0 | 4 | 0 |
| B | 0 | 4 | 0 |
| C | 0 | 4 | 0 |
| D | 0 | 4 | 0 |
| Mode M0 | |||
|---|---|---|---|
| Quadrant | BADHDUFLAG | Total packets | Discarded packets |
| A | 0 | 19248 | 0 |
| B | 0 | 45763 | 0 |
| C | 0 | 15147 | 0 |
| D | 0 | 20390 | 0 |
| Quadrant | Total seconds | Saturated seconds | Saturation percentage |
|---|---|---|---|
| A | 7289 | 503 | 6.900809% |
| B | 7289 | 4840 | 66.401427% |
| C | 7289 | 200 | 2.743861% |
| D | 7289 | 438 | 6.009055% |
Noise dominated data is calculated using 1-second bins in cleaned event files. If a bin has >2000 counts, and if more than 50% of those come from <1% of pixels, then it is considered to be noise-dominated and hence unusable.
| Quadrant | # 1 sec bins | Bins with >0 counts | Bins with >2000 counts | High rate bins dominated by noise | Noise dominated (total time) | Noise dominated (detector-on time) | Marked lightcurve |
|---|---|---|---|---|---|---|---|
| A | 7624 | 7289 | 297 | 297 | 3.90% | 4.07% | 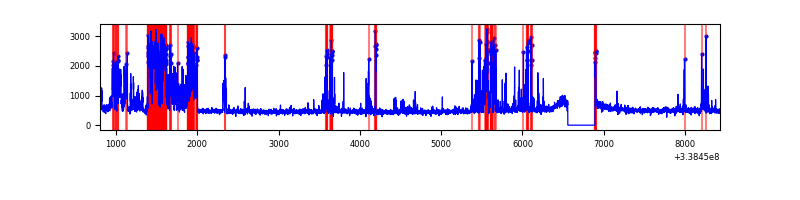 |
| B | 7623 | 7288 | 3693 | 3693 | 48.45% | 50.67% | 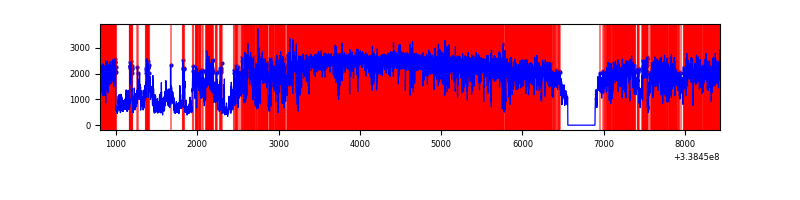 |
| C | 7624 | 7289 | 0 | 0 | 0.00% | 0.00% | 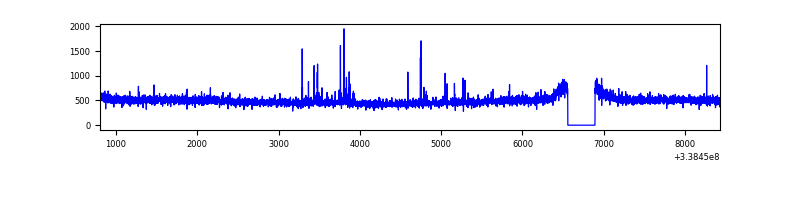 |
| D | 7624 | 7289 | 324 | 324 | 4.25% | 4.45% | 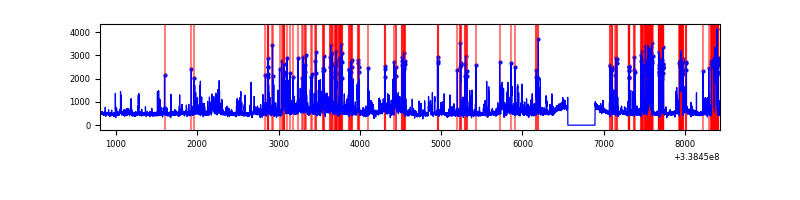 |
Top three noisy pixels from each quadrant. If the there are fewer than three noisy pixels in the level2.evt file, extra rows are filled as -1
| Pixel properties | Quadrant properties | ||||||
|---|---|---|---|---|---|---|---|
| Quadrant | DetID | PixID | Counts | Sigma | Mean | Median | Sigma |
| A | 6 | 16 | 1004761 | 5611.04 | 888 | 867 | 178.9 |
| A | 14 | 235 | 416559 | 2323.42 | 888 | 867 | 178.9 |
| A | 0 | 13 | 32310 | 175.74 | 888 | 867 | 178.9 |
| B | 0 | 189 | 10771148 | 76241.41 | 739 | 720 | 141.3 |
| B | 12 | 111 | 16535 | 111.95 | 739 | 720 | 141.3 |
| B | 0 | 219 | 15765 | 106.5 | 739 | 720 | 141.3 |
| C | 14 | 238 | 138264 | 670.13 | 876 | 882 | 205.0 |
| C | 0 | 207 | 33289 | 158.08 | 876 | 882 | 205.0 |
| C | 2 | 16 | 15650 | 72.04 | 876 | 882 | 205.0 |
| D | 1 | 52 | 1624061 | 7942.32 | 863 | 837 | 204.4 |
| D | 2 | 250 | 219293 | 1068.89 | 863 | 837 | 204.4 |
| D | 12 | 1 | 95442 | 462.9 | 863 | 837 | 204.4 |
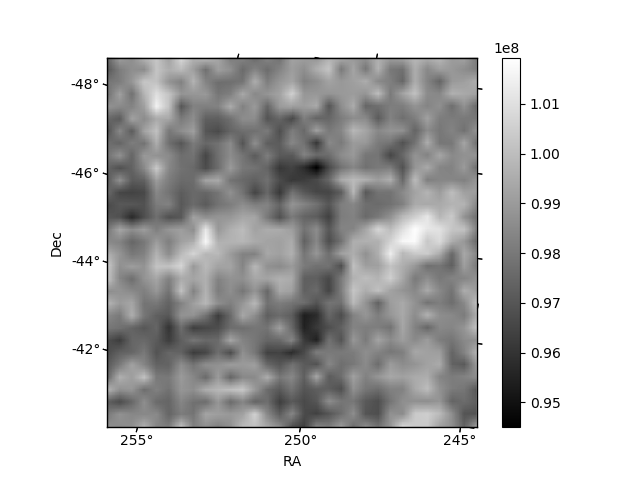
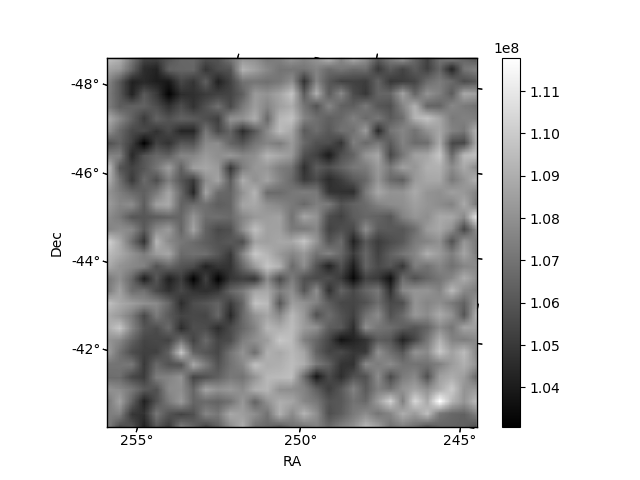
Histogram calculated using DETX and DETY for each event in the final _common_clean file
| Quadrant A |  |
 |
Quadrant B |
|---|---|---|---|
| Quadrant D |  |
 |
Quadrant C |
| Plot type | Count rate plots | Images |
|---|---|---|
| Comparison with Poisson distribution Blue bars denote a histogram of data divided into 1 sec bins. Red curve is a Poisson curve with rate = median count rate of data. |
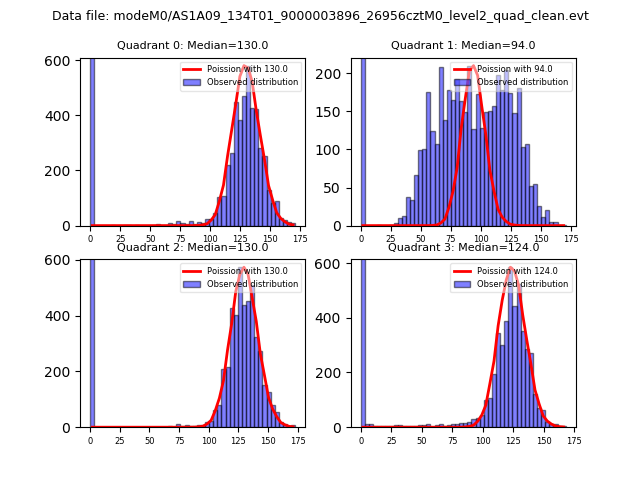 |
 |
| Quadrant-wise count rates Data is divided into 100 sec bins |
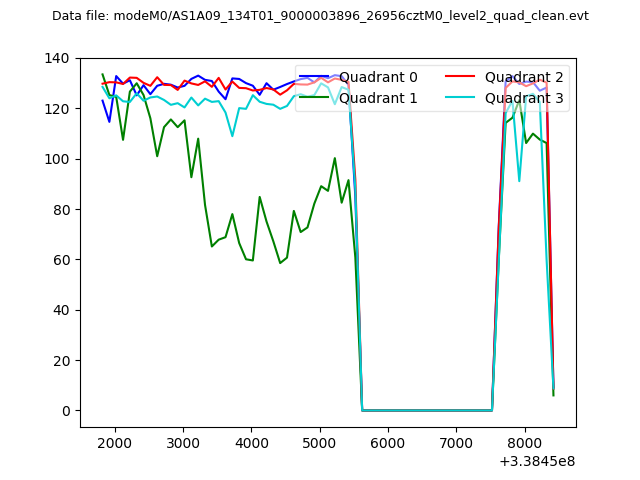 |
|
| Module-wise count rates for Quadrant A Data is divided into 100 sec bins |
 |
 |
| Module-wise count rates for Quadrant B Data is divided into 100 sec bins |
 |
 |
| Module-wise count rates for Quadrant C Data is divided into 100 sec bins |
 |
 |
| Module-wise count rates for Quadrant D Data is divided into 100 sec bins |
 |
 |
| Parameter | Plot |
|---|---|
| CZT HV Monitor |  |
| D_VDD | 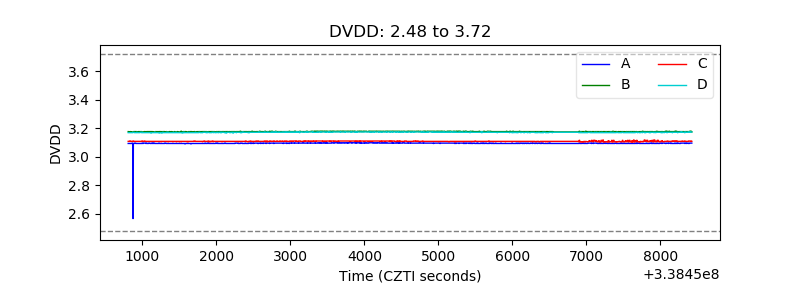 |
| Temperature 1 |  |
| Veto HV Monitor |  |
| Veto LLD |  |
| Alpha Counter | 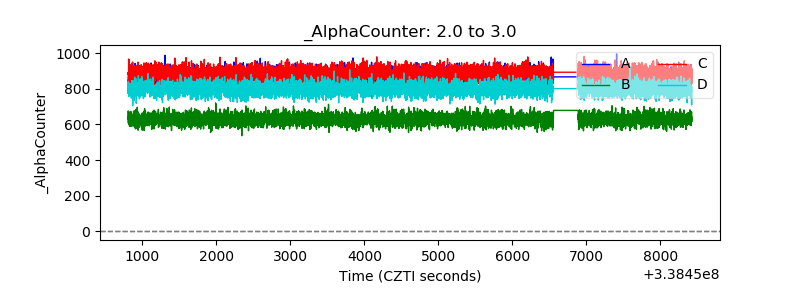 |
| _CPM_Rate | 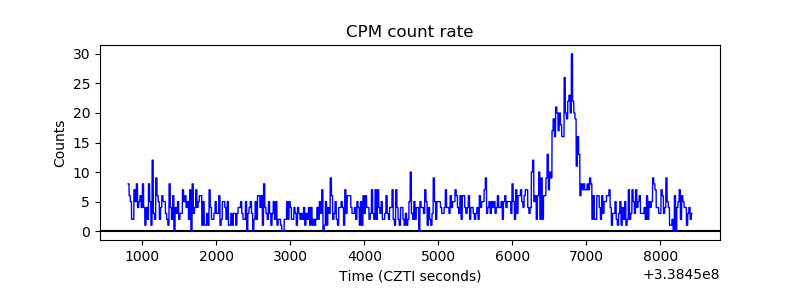 |
| CZT Counter |  |
| +2.5 Volts monitor |  |
| +5 Volts monitor |  |
| _ROLL_ROT |  |
| _Roll_DEC |  |
| _Roll_RA |  |
| Veto Counter |  |