| Param | Original file | Final file |
|---|---|---|
| Filename | modeM0/AS1A09_134T01_9000003896_26957cztM0_level2.evt | modeM0/AS1A09_134T01_9000003896_26957cztM0_level2_quad_clean.evt |
| Size (bytes) | 200,839,680 | 22,968,000 |
| Size | 191.5 MB | 21.9 MB |
| Events in quadrant A | 764,753 | 159,386 |
| Events in quadrant B | 2,969,440 | 126,336 |
| Events in quadrant C | 769,092 | 159,283 |
| Events in quadrant D | 1,475,154 | 138,480 |
| Mode M0 | |||
|---|---|---|---|
| Quadrant | BADHDUFLAG | Total packets | Discarded packets |
| A | 0 | 3162 | 0 |
| B | 0 | 9835 | 0 |
| C | 0 | 3109 | 0 |
| D | 0 | 5331 | 0 |
| Quadrant | Total seconds | Saturated seconds | Saturation percentage |
|---|---|---|---|
| A | 1498 | 8 | 0.534045% |
| B | 1498 | 1024 | 68.357810% |
| C | 1498 | 11 | 0.734312% |
| D | 1498 | 255 | 17.022697% |
Noise dominated data is calculated using 1-second bins in cleaned event files. If a bin has >2000 counts, and if more than 50% of those come from <1% of pixels, then it is considered to be noise-dominated and hence unusable.
| Quadrant | # 1 sec bins | Bins with >0 counts | Bins with >2000 counts | High rate bins dominated by noise | Noise dominated (total time) | Noise dominated (detector-on time) | Marked lightcurve |
|---|---|---|---|---|---|---|---|
| A | 1498 | 1498 | 4 | 4 | 0.27% | 0.27% | 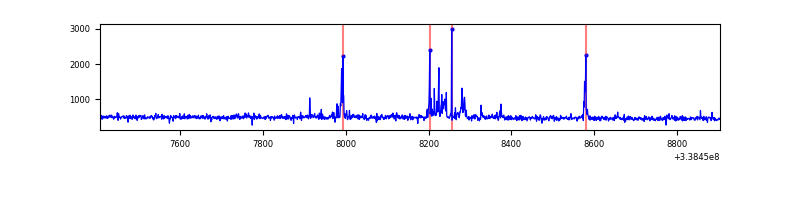 |
| B | 1498 | 1498 | 817 | 817 | 54.54% | 54.54% | 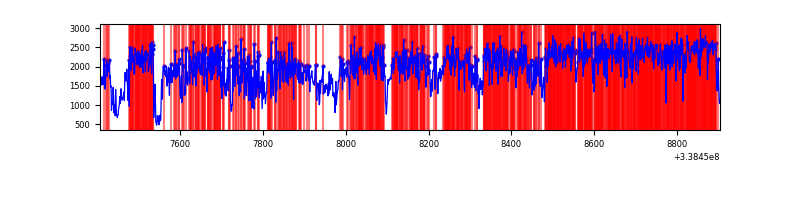 |
| C | 1498 | 1498 | 0 | 0 | 0.00% | 0.00% | 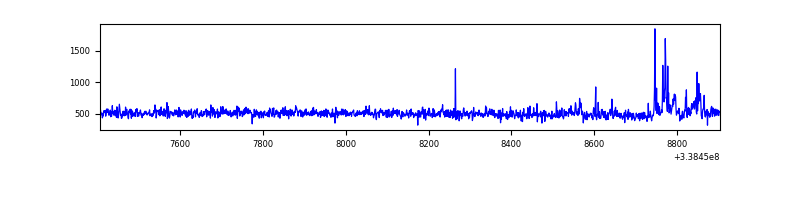 |
| D | 1498 | 1498 | 241 | 241 | 16.09% | 16.09% | 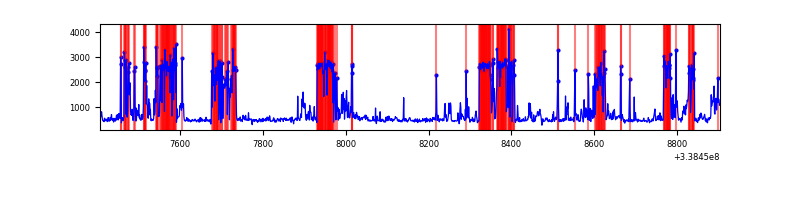 |
Top three noisy pixels from each quadrant. If the there are fewer than three noisy pixels in the level2.evt file, extra rows are filled as -1
| Pixel properties | Quadrant properties | ||||||
|---|---|---|---|---|---|---|---|
| Quadrant | DetID | PixID | Counts | Sigma | Mean | Median | Sigma |
| A | 14 | 235 | 50659 | 1282.4 | 184 | 180 | 39.4 |
| A | 13 | 254 | 2419 | 56.88 | 184 | 180 | 39.4 |
| A | 3 | 137 | 1752 | 39.94 | 184 | 180 | 39.4 |
| B | 0 | 189 | 2356162 | 73745.49 | 154 | 150 | 31.9 |
| B | 0 | 219 | 6351 | 194.1 | 154 | 150 | 31.9 |
| B | 12 | 111 | 3497 | 104.76 | 154 | 150 | 31.9 |
| C | 14 | 238 | 28936 | 652.43 | 180 | 181 | 44.1 |
| C | 0 | 207 | 26049 | 586.92 | 180 | 181 | 44.1 |
| C | 2 | 16 | 7664 | 169.78 | 180 | 181 | 44.1 |
| D | 1 | 52 | 750375 | 17711.92 | 167 | 161 | 42.4 |
| D | 2 | 250 | 56005 | 1318.43 | 167 | 161 | 42.4 |
| D | 12 | 1 | 26302 | 617.17 | 167 | 161 | 42.4 |
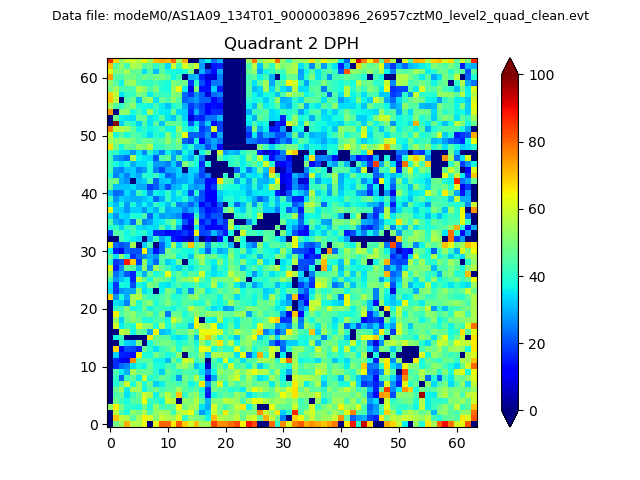
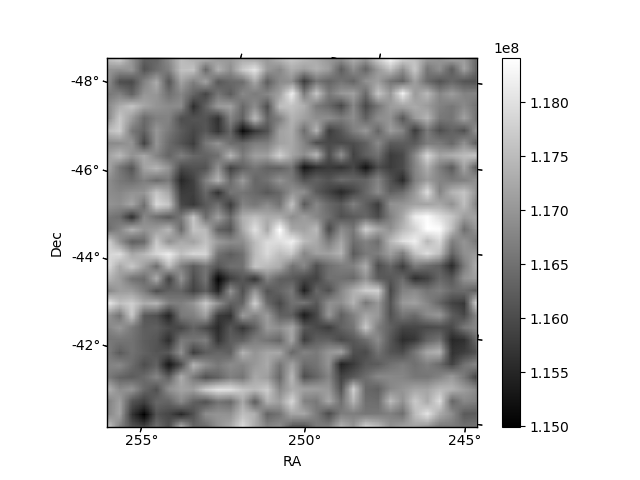
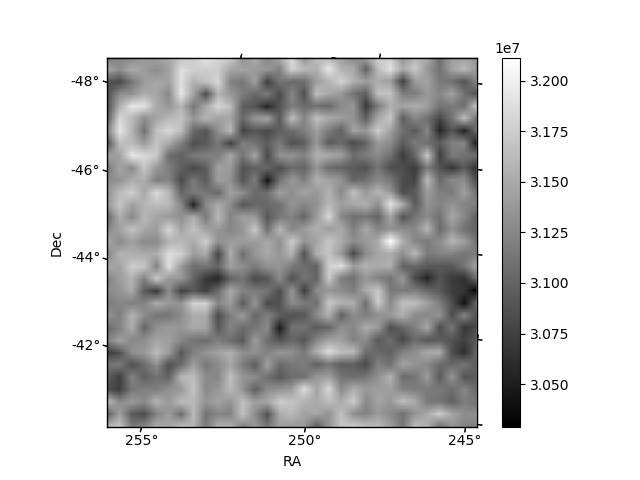
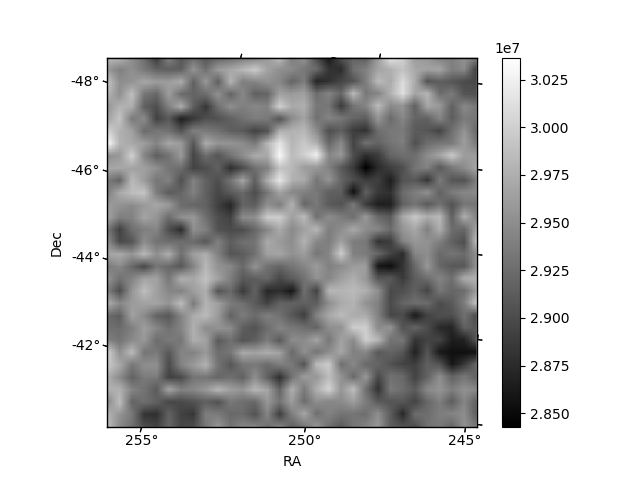
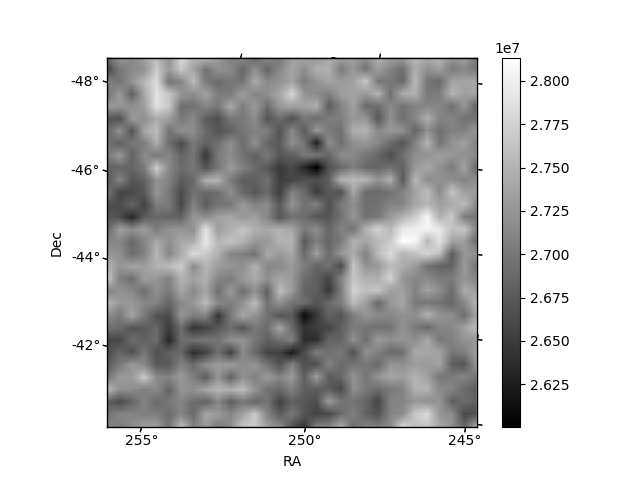
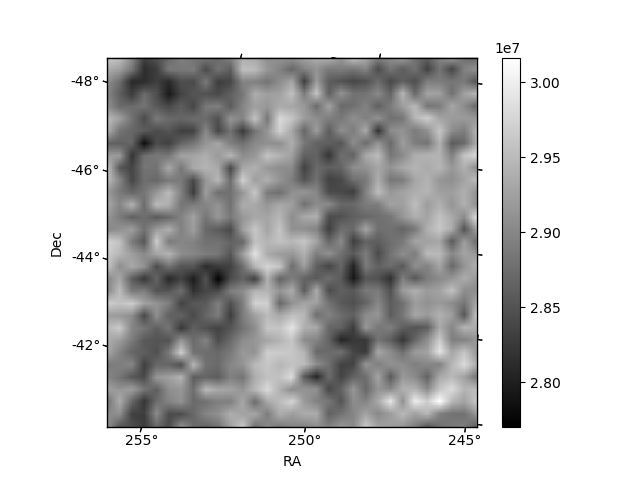
Histogram calculated using DETX and DETY for each event in the final _common_clean file
| Quadrant A | 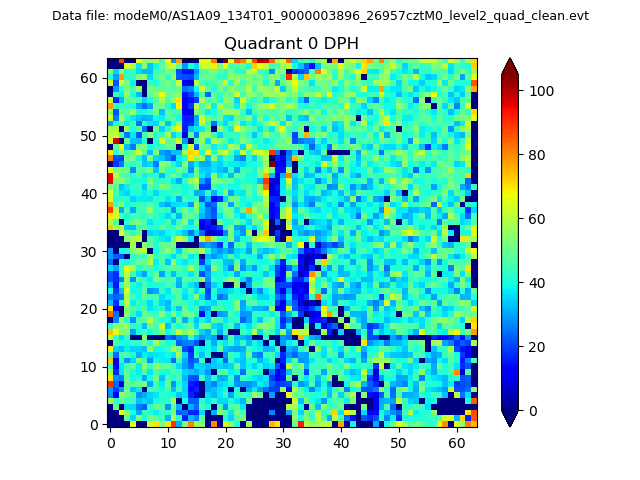 |
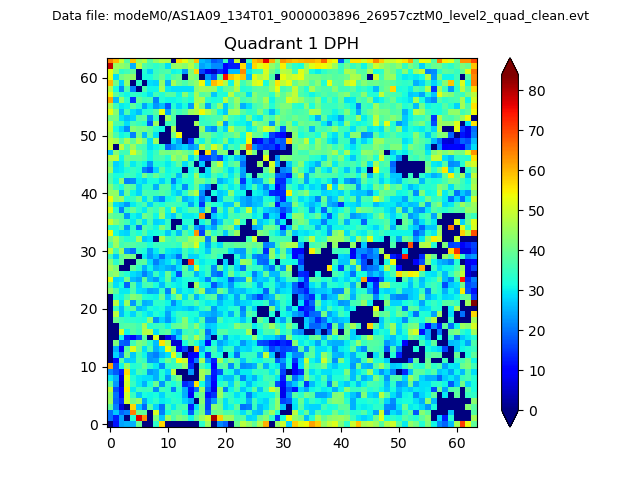 |
Quadrant B |
|---|---|---|---|
| Quadrant D | 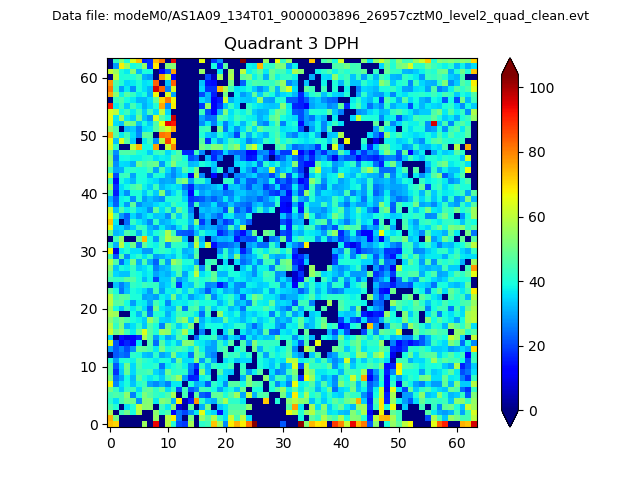 |
 |
Quadrant C |
| Plot type | Count rate plots | Images |
|---|---|---|
| Comparison with Poisson distribution Blue bars denote a histogram of data divided into 1 sec bins. Red curve is a Poisson curve with rate = median count rate of data. |
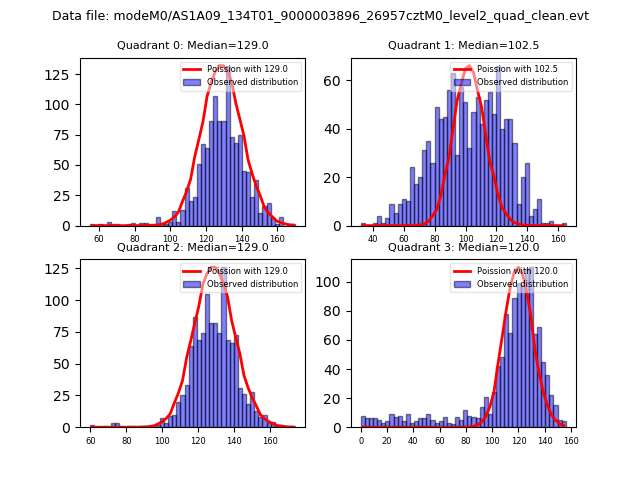 |
 |
| Quadrant-wise count rates Data is divided into 100 sec bins |
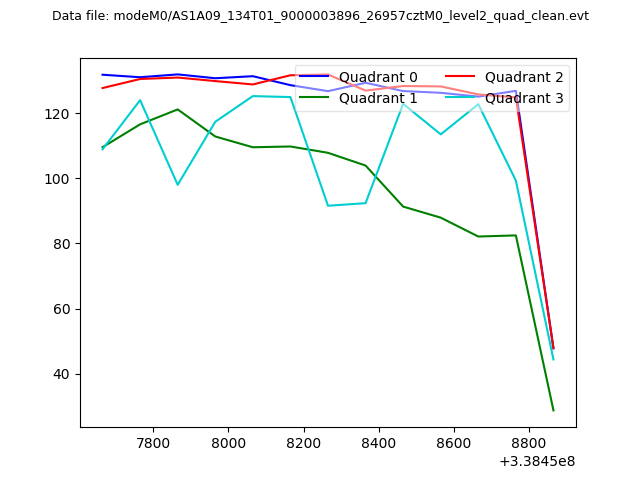 |
|
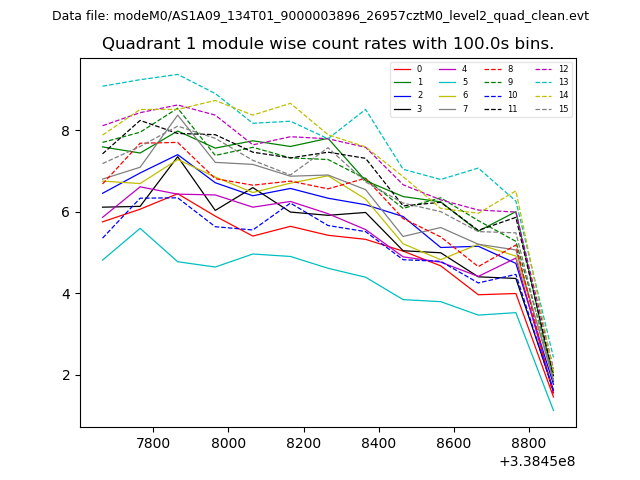
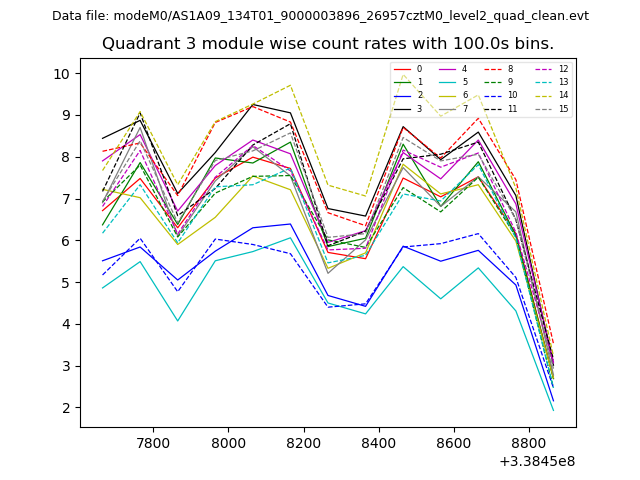
| Module-wise count rates for Quadrant A Data is divided into 100 sec bins |
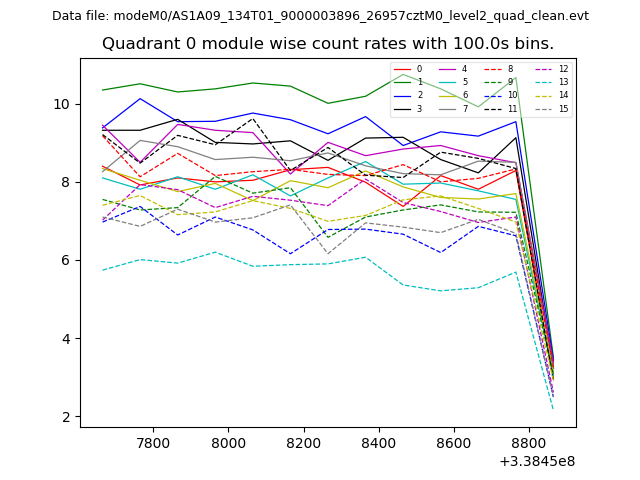 |
 |
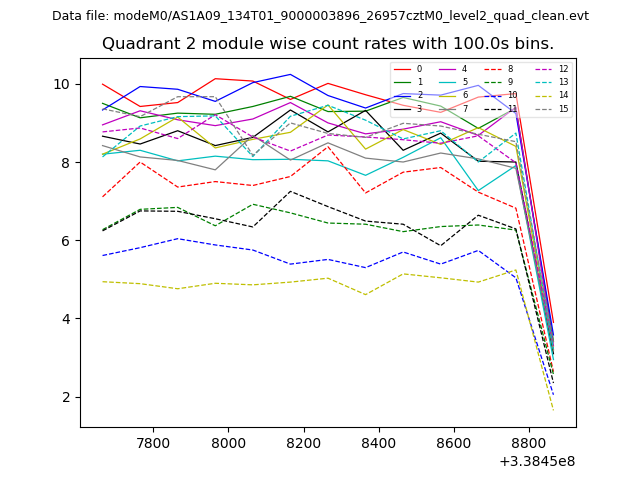
| Module-wise count rates for Quadrant B Data is divided into 100 sec bins |
 |
 |
| Module-wise count rates for Quadrant C Data is divided into 100 sec bins |
 |
 |
| Module-wise count rates for Quadrant D Data is divided into 100 sec bins |
 |
 |
| Parameter | Plot |
|---|---|
| CZT HV Monitor | 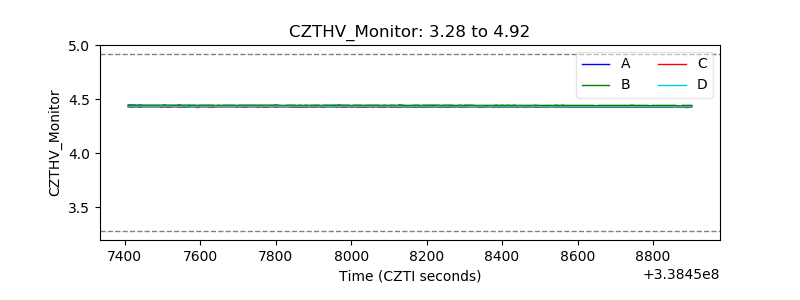 |
| D_VDD | 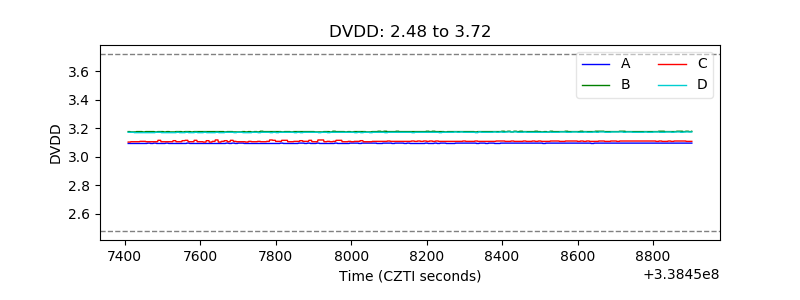 |
| Temperature 1 | 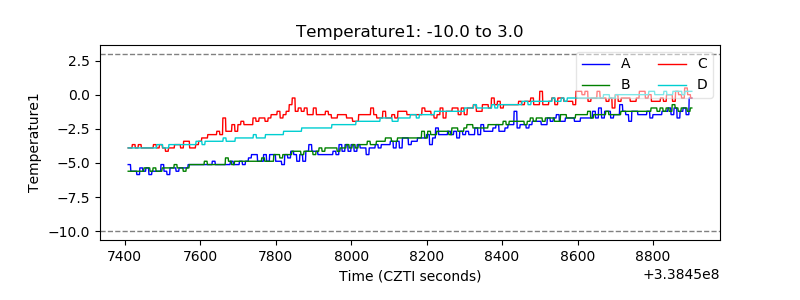 |
| Veto HV Monitor | 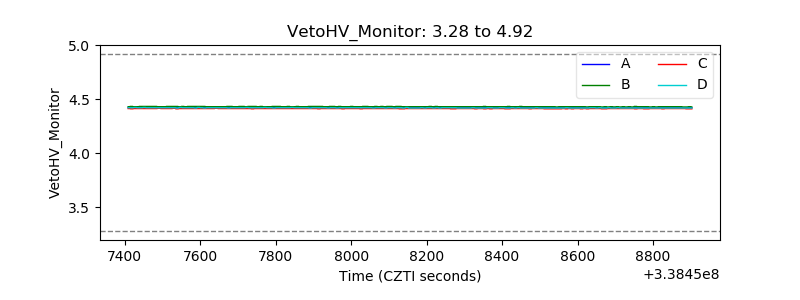 |
| Veto LLD | 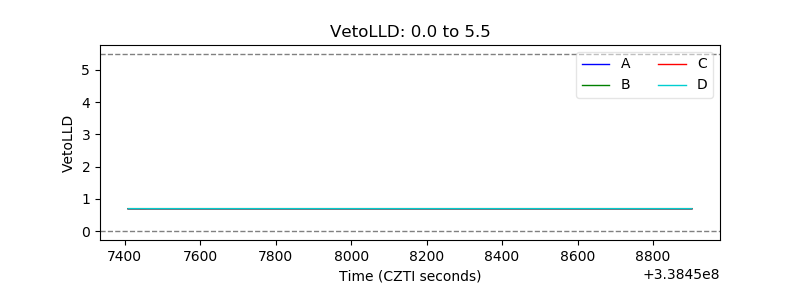 |
| Alpha Counter | 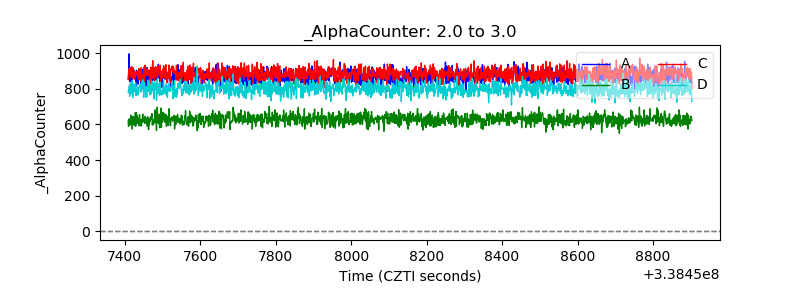 |
| _CPM_Rate | 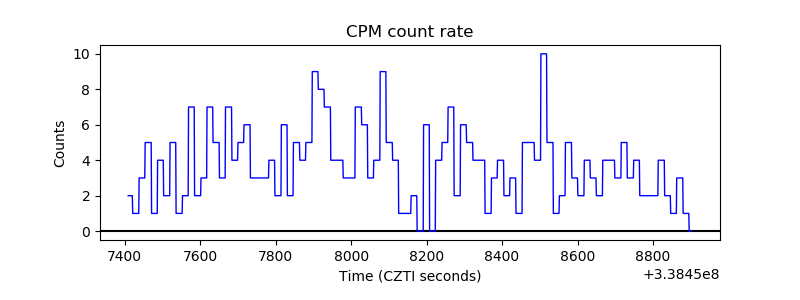 |
| CZT Counter | 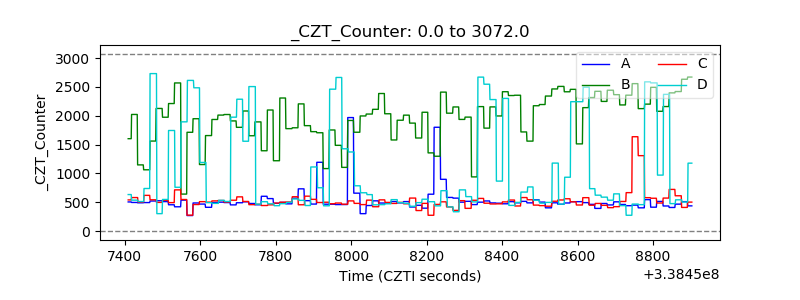 |
| +2.5 Volts monitor | 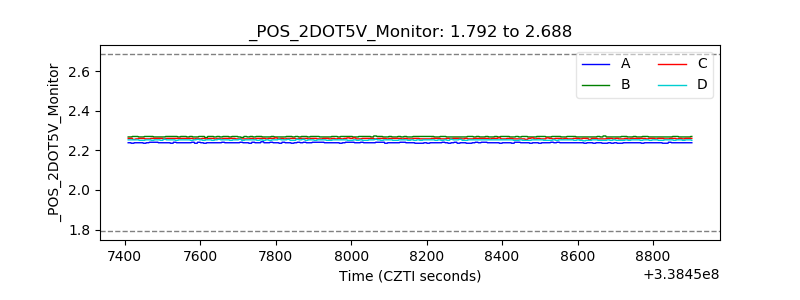 |
| +5 Volts monitor | 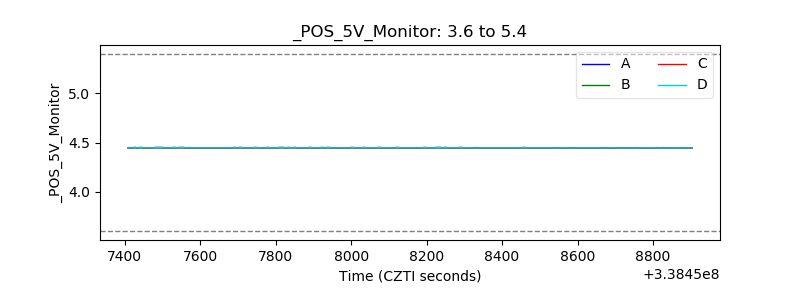 |
| _ROLL_ROT | 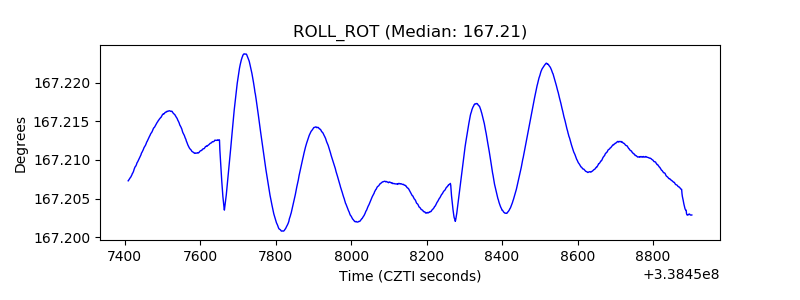 |
| _Roll_DEC |  |
| _Roll_RA | 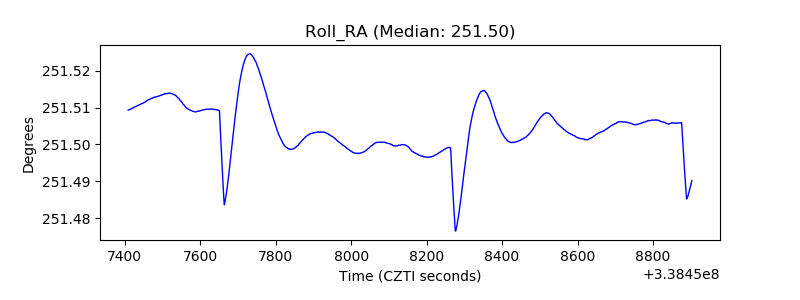 |
| Veto Counter | 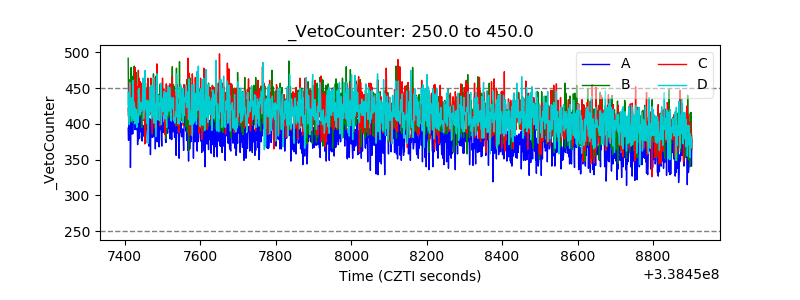 |