| Param | Original file | Final file |
|---|---|---|
| Filename | modeM0/AS1T03_233T01_9000003894cztM0_level2.fits | modeM0/AS1T03_233T01_9000003894cztM0_level2_quad_clean.evt |
| Size (bytes) | 93,107,520 | 110,229,120 |
| Size | 88.8 MB | 105.1 MB |
| Events in quadrant A | 625,380 | 848,012 |
| Events in quadrant B | 298,436 | 257,673 |
| Events in quadrant C | 618,450 | 822,799 |
| Events in quadrant D | 504,696 | 641,081 |
| Mode SS | |||
|---|---|---|---|
| Quadrant | BADHDUFLAG | Total packets | Discarded packets |
| A | 0 | 224 | 0 |
| B | 0 | 224 | 0 |
| C | 0 | 224 | 0 |
| D | 0 | 224 | 0 |
| Mode M0 | |||
|---|---|---|---|
| Quadrant | BADHDUFLAG | Total packets | Discarded packets |
| A | 0 | 23799 | 0 |
| B | 0 | 67741 | 0 |
| C | 0 | 22744 | 0 |
| D | 0 | 37841 | 0 |
| Mode M9 | |||
|---|---|---|---|
| Quadrant | BADHDUFLAG | Total packets | Discarded packets |
| A | 0 | 4 | 0 |
| B | 0 | 4 | 0 |
| C | 0 | 4 | 0 |
| D | 0 | 4 | 0 |
| Quadrant | Total seconds | Saturated seconds | Saturation percentage |
|---|---|---|---|
| A | 11097 | 106 | 0.955213% |
| B | 11097 | 8488 | 76.489141% |
| C | 11097 | 154 | 1.387762% |
| D | 11097 | 1527 | 13.760476% |
Noise dominated data is calculated using 1-second bins in cleaned event files. If a bin has >2000 counts, and if more than 50% of those come from <1% of pixels, then it is considered to be noise-dominated and hence unusable.
| Quadrant | # 1 sec bins | Bins with >0 counts | Bins with >2000 counts | High rate bins dominated by noise | Noise dominated (total time) | Noise dominated (detector-on time) | Marked lightcurve |
|---|---|---|---|---|---|---|---|
| A | 11531 | 11091 | 0 | 0 | 0.00% | 0.00% |  |
| B | 11531 | 9587 | 0 | 0 | 0.00% | 0.00% | 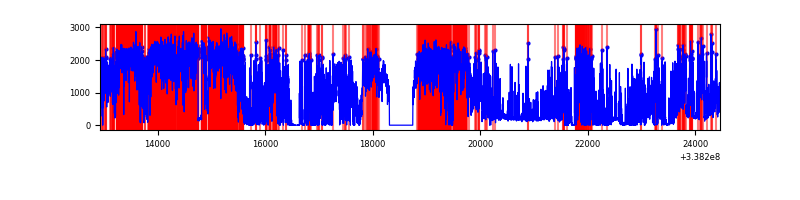 |
| C | 11531 | 11094 | 0 | 0 | 0.00% | 0.00% | 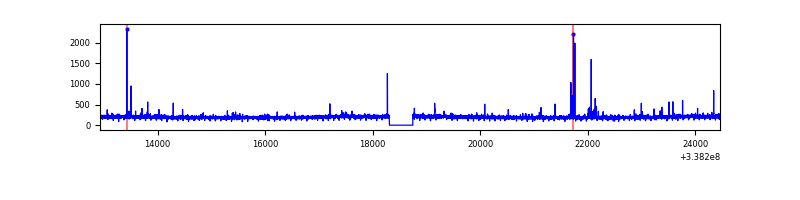 |
| D | 11531 | 11067 | 0 | 0 | 0.00% | 0.00% | 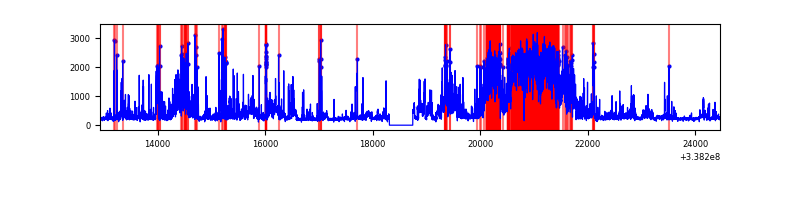 |
Top three noisy pixels from each quadrant. If the there are fewer than three noisy pixels in the level2.evt file, extra rows are filled as -1
| Pixel properties | Quadrant properties | ||||||
|---|---|---|---|---|---|---|---|
| Quadrant | DetID | PixID | Counts | Sigma | Mean | Median | Sigma |
| A | 0 | 29 | 529 | 8.99 | 163 | 154 | 41.7 |
| A | 7 | 110 | 515 | 8.65 | 163 | 154 | 41.7 |
| A | 0 | 30 | 478 | 7.77 | 163 | 154 | 41.7 |
| B | 2 | 9 | 252 | 10.12 | 78 | 75 | 17.5 |
| B | 2 | 8 | 222 | 8.4 | 78 | 75 | 17.5 |
| B | 3 | 17 | 201 | 7.2 | 78 | 75 | 17.5 |
| C | 12 | 241 | 441 | 6.64 | 163 | 153 | 43.3 |
| C | 2 | 191 | 426 | 6.3 | 163 | 153 | 43.3 |
| C | 3 | 234 | 416 | 6.07 | 163 | 153 | 43.3 |
| D | 7 | 3 | 386 | 6.42 | 144 | 131 | 39.7 |
| D | 10 | 189 | 366 | 5.92 | 144 | 131 | 39.7 |
| D | 3 | 14 | 355 | 5.64 | 144 | 131 | 39.7 |
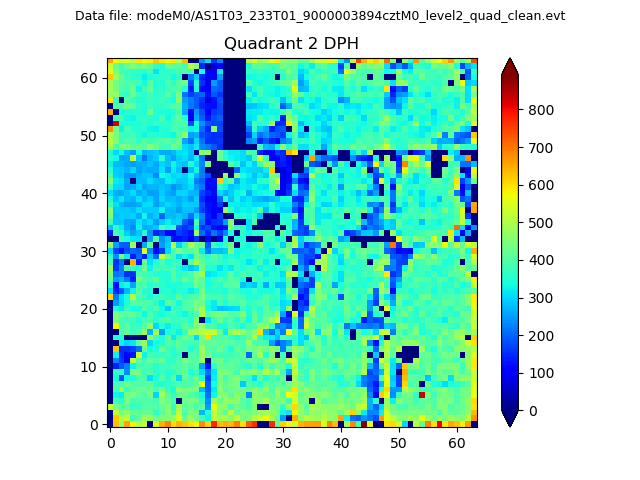
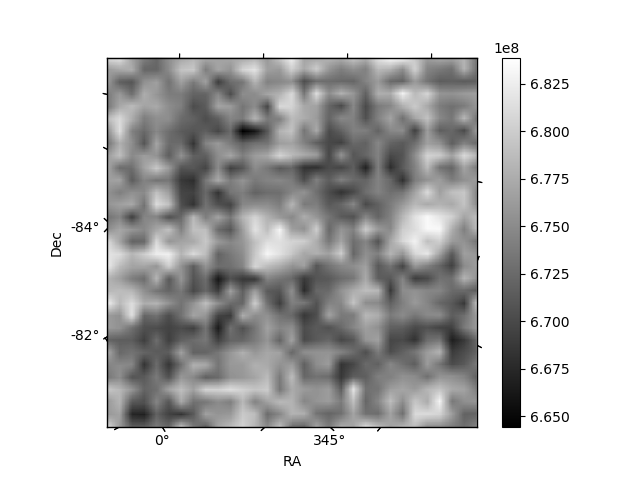
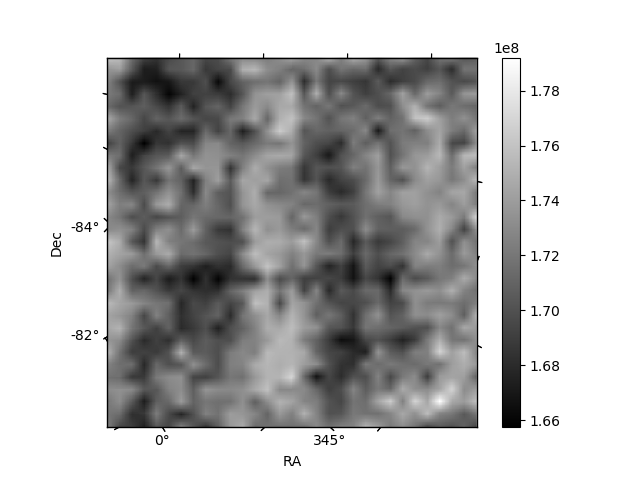
Histogram calculated using DETX and DETY for each event in the final _common_clean file
| Quadrant A |  |
 |
Quadrant B |
|---|---|---|---|
| Quadrant D |  |
 |
Quadrant C |
| Plot type | Count rate plots | Images |
|---|---|---|
| Comparison with Poisson distribution Blue bars denote a histogram of data divided into 1 sec bins. Red curve is a Poisson curve with rate = median count rate of data. |
 |
 |
| Quadrant-wise count rates Data is divided into 100 sec bins |
 |
|
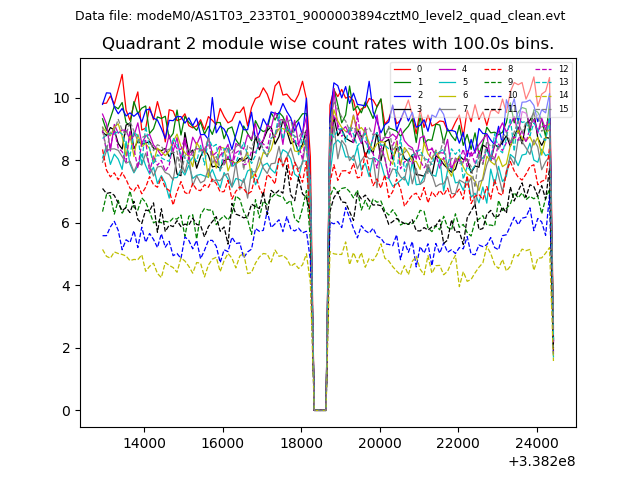
| Module-wise count rates for Quadrant A Data is divided into 100 sec bins |
 |
 |
| Module-wise count rates for Quadrant B Data is divided into 100 sec bins |
 |
 |
| Module-wise count rates for Quadrant C Data is divided into 100 sec bins |
 |
 |
| Module-wise count rates for Quadrant D Data is divided into 100 sec bins |
 |
 |
| Parameter | Plot |
|---|---|
| CZT HV Monitor | 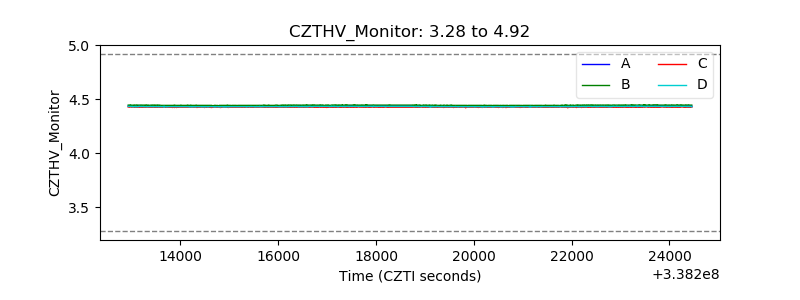 |
| D_VDD | 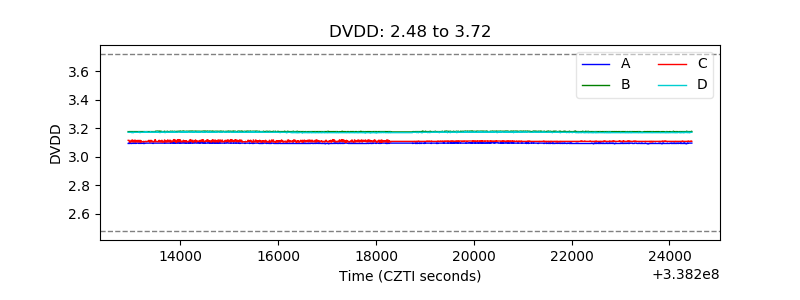 |
| Temperature 1 | 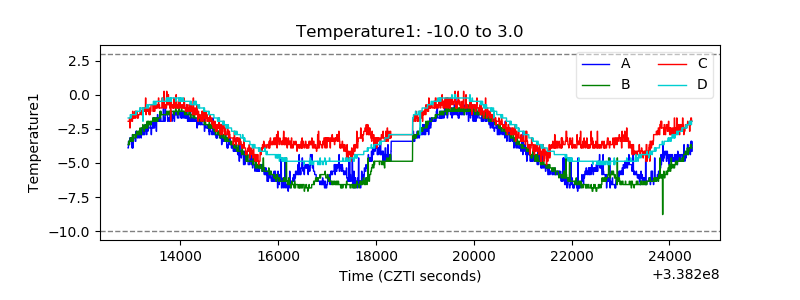 |
| Veto HV Monitor |  |
| Veto LLD | 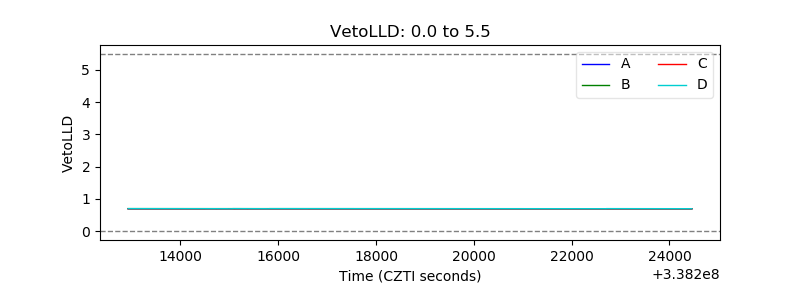 |
| Alpha Counter |  |
| _CPM_Rate | 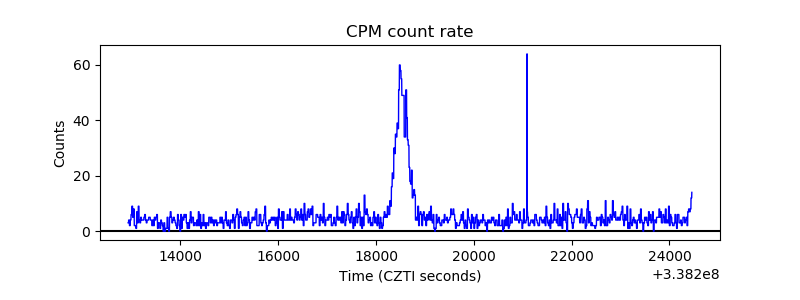 |
| CZT Counter |  |
| +2.5 Volts monitor |  |
| +5 Volts monitor |  |
| _ROLL_ROT |  |
| _Roll_DEC |  |
| _Roll_RA |  |
| Veto Counter |  |