| Param | Original file | Final file |
|---|---|---|
| Filename | modeM0/AS1T03_233T01_9000003894_26917cztM0_level2.evt | modeM0/AS1T03_233T01_9000003894_26917cztM0_level2_quad_clean.evt |
| Size (bytes) | 1,390,392,000 | 182,352,960 |
| Size | 1.3 GB | 173.9 MB |
| Events in quadrant A | 5,611,532 | 1,394,170 |
| Events in quadrant B | 20,247,574 | 712,540 |
| Events in quadrant C | 5,214,575 | 1,386,322 |
| Events in quadrant D | 10,284,672 | 1,257,351 |
| Mode M0 | |||
|---|---|---|---|
| Quadrant | BADHDUFLAG | Total packets | Discarded packets |
| A | 0 | 23799 | 0 |
| B | 0 | 67741 | 0 |
| C | 0 | 22744 | 0 |
| D | 0 | 37841 | 0 |
| Mode M9 | |||
|---|---|---|---|
| Quadrant | BADHDUFLAG | Total packets | Discarded packets |
| A | 0 | 4 | 0 |
| B | 0 | 4 | 0 |
| C | 0 | 4 | 0 |
| D | 0 | 4 | 0 |
| Quadrant | Total seconds | Saturated seconds | Saturation percentage |
|---|---|---|---|
| A | 11097 | 106 | 0.955213% |
| B | 11097 | 8488 | 76.489141% |
| C | 11097 | 154 | 1.387762% |
| D | 11097 | 1527 | 13.760476% |
Noise dominated data is calculated using 1-second bins in cleaned event files. If a bin has >2000 counts, and if more than 50% of those come from <1% of pixels, then it is considered to be noise-dominated and hence unusable.
| Quadrant | # 1 sec bins | Bins with >0 counts | Bins with >2000 counts | High rate bins dominated by noise | Noise dominated (total time) | Noise dominated (detector-on time) | Marked lightcurve |
|---|---|---|---|---|---|---|---|
| A | 11531 | 11096 | 11 | 11 | 0.10% | 0.10% | 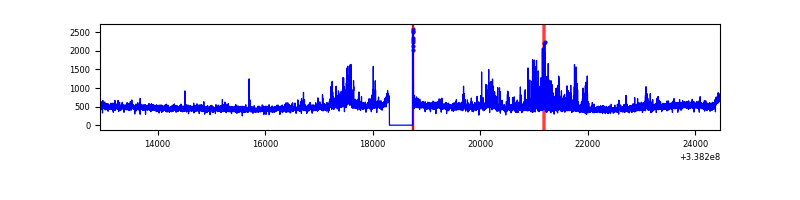 |
| B | 11531 | 11096 | 5977 | 5977 | 51.83% | 53.87% | 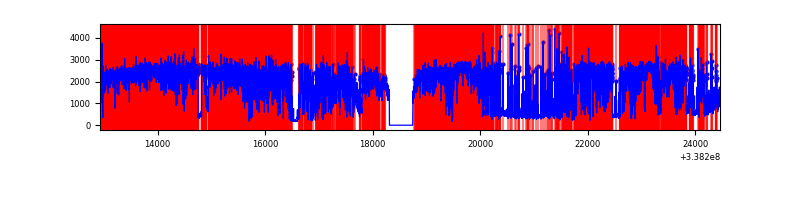 |
| C | 11532 | 11097 | 4 | 4 | 0.03% | 0.04% | 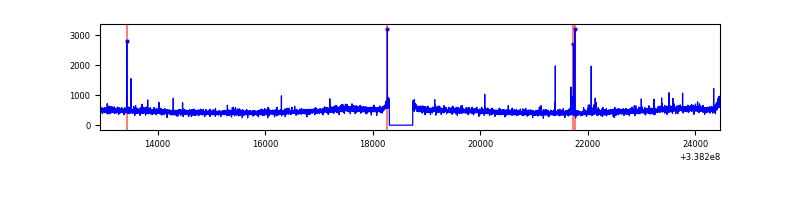 |
| D | 11531 | 11096 | 1450 | 1450 | 12.57% | 13.07% | 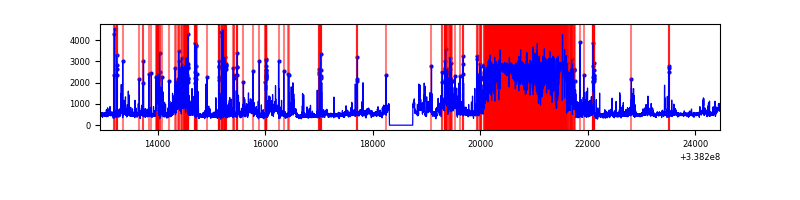 |
Top three noisy pixels from each quadrant. If the there are fewer than three noisy pixels in the level2.evt file, extra rows are filled as -1
| Pixel properties | Quadrant properties | ||||||
|---|---|---|---|---|---|---|---|
| Quadrant | DetID | PixID | Counts | Sigma | Mean | Median | Sigma |
| A | 0 | 13 | 460358 | 1765.85 | 1304 | 1279 | 260.0 |
| A | 5 | 168 | 90969 | 344.99 | 1304 | 1279 | 260.0 |
| A | 8 | 192 | 25628 | 93.66 | 1304 | 1279 | 260.0 |
| B | 3 | 64 | 8832014 | 64885.29 | 727 | 710 | 136.1 |
| B | 0 | 189 | 8365013 | 61454.15 | 727 | 710 | 136.1 |
| B | 10 | 246 | 70990 | 516.36 | 727 | 710 | 136.1 |
| C | 14 | 238 | 203809 | 688.06 | 1267 | 1277 | 294.4 |
| C | 15 | 208 | 28401 | 92.15 | 1267 | 1277 | 294.4 |
| C | 2 | 16 | 27884 | 90.39 | 1267 | 1277 | 294.4 |
| D | 7 | 80 | 4178696 | 14428.7 | 1207 | 1172 | 289.5 |
| D | 1 | 52 | 1054349 | 3637.55 | 1207 | 1172 | 289.5 |
| D | 2 | 250 | 235979 | 811.0 | 1207 | 1172 | 289.5 |
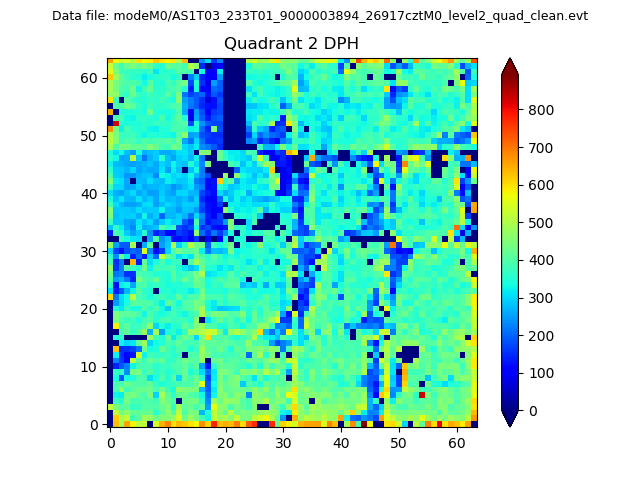
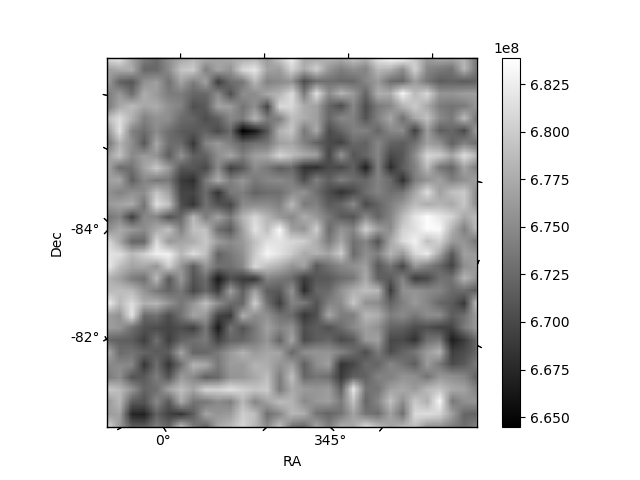
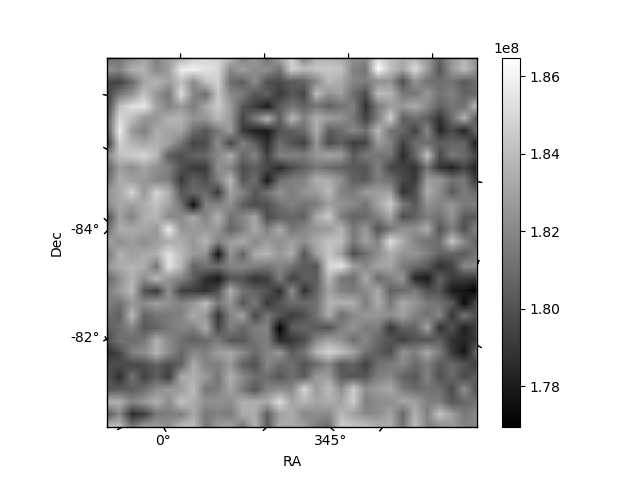
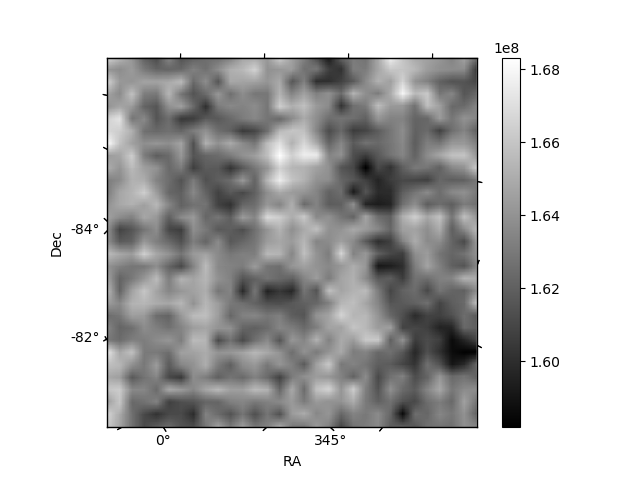
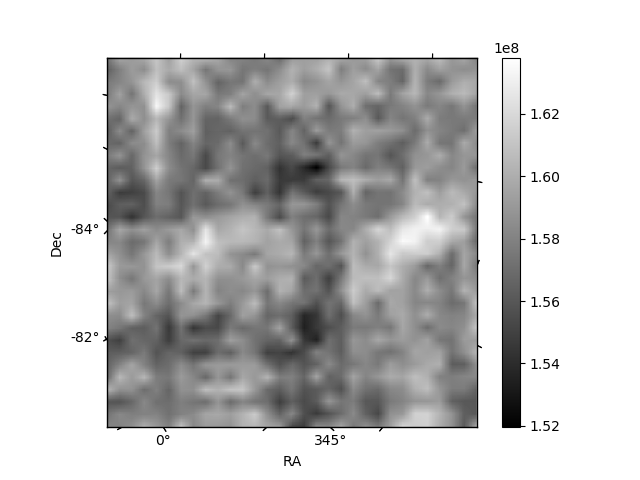
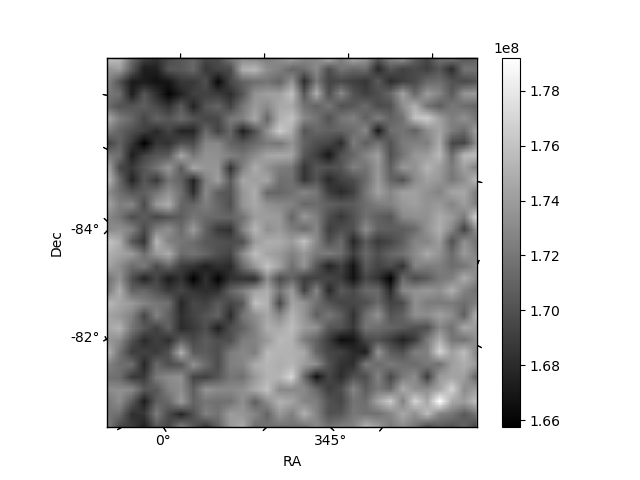
Histogram calculated using DETX and DETY for each event in the final _common_clean file
| Quadrant A | 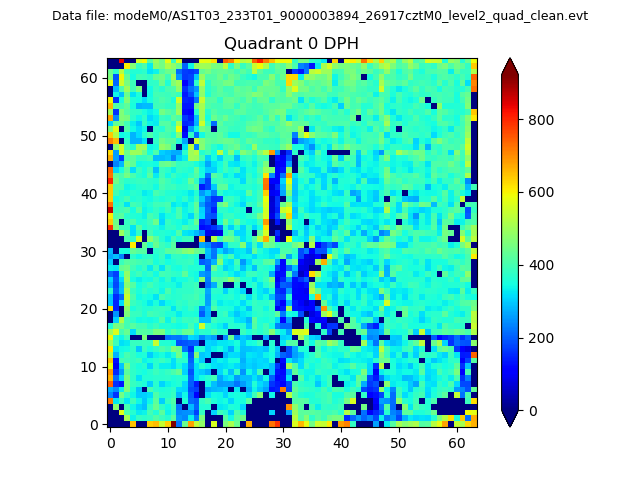 |
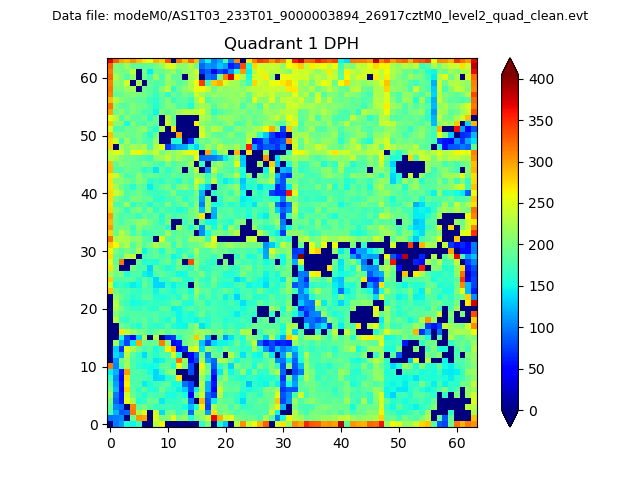 |
Quadrant B |
|---|---|---|---|
| Quadrant D | 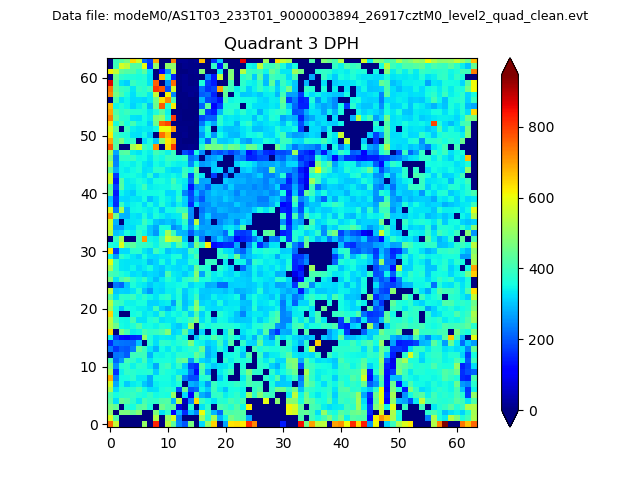 |
 |
Quadrant C |
| Plot type | Count rate plots | Images |
|---|---|---|
| Comparison with Poisson distribution Blue bars denote a histogram of data divided into 1 sec bins. Red curve is a Poisson curve with rate = median count rate of data. |
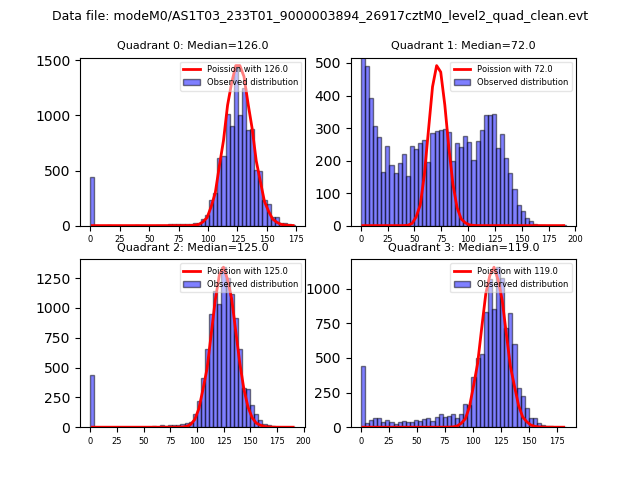 |
 |
| Quadrant-wise count rates Data is divided into 100 sec bins |
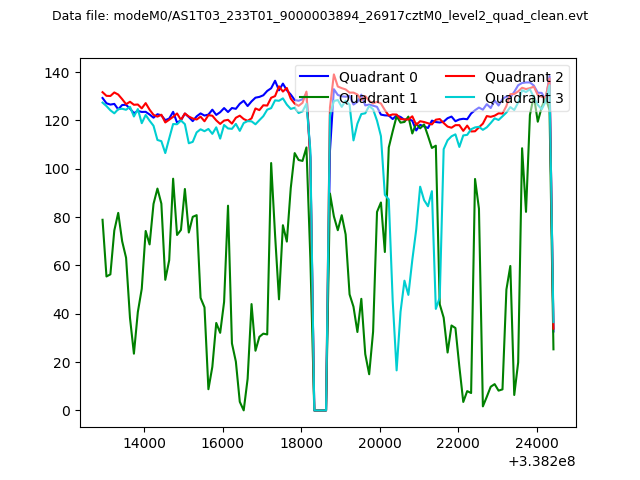 |
|
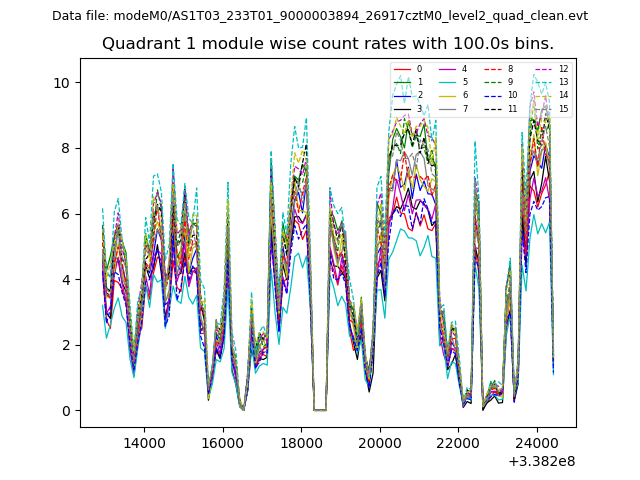
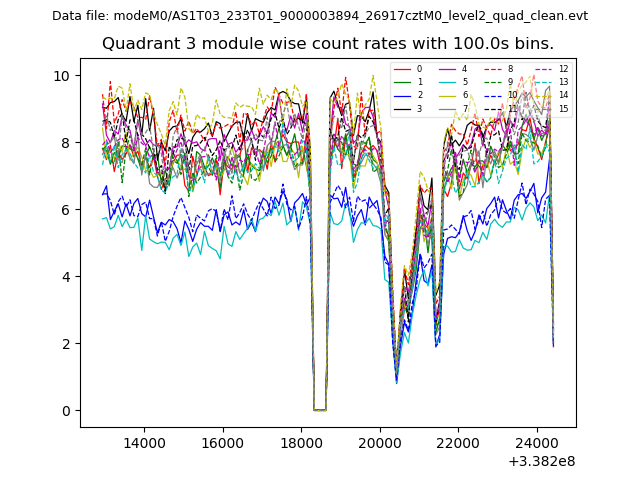
| Module-wise count rates for Quadrant A Data is divided into 100 sec bins |
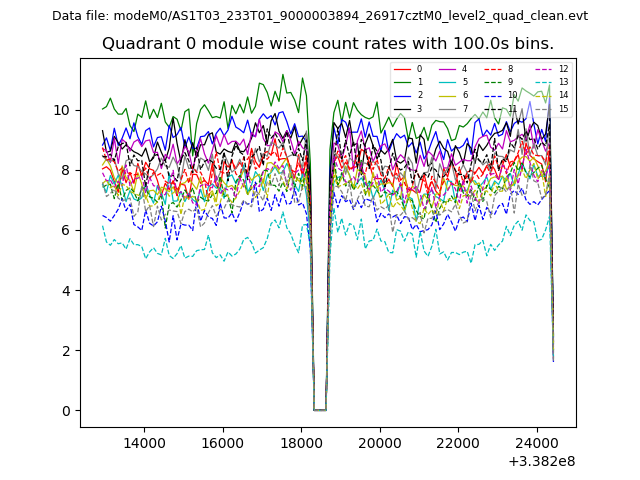 |
 |
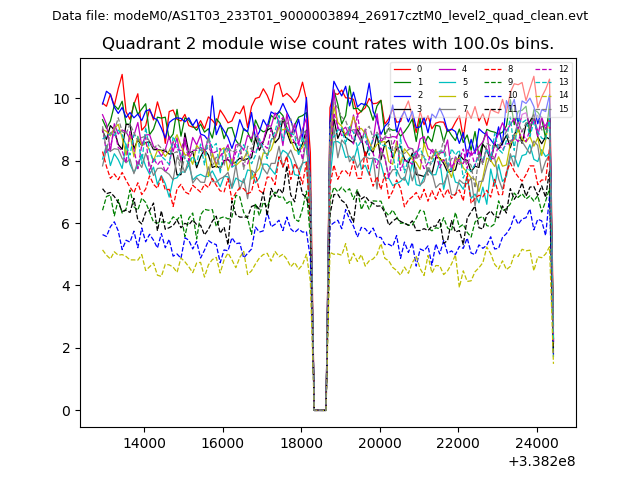
| Module-wise count rates for Quadrant B Data is divided into 100 sec bins |
 |
 |
| Module-wise count rates for Quadrant C Data is divided into 100 sec bins |
 |
 |
| Module-wise count rates for Quadrant D Data is divided into 100 sec bins |
 |
 |
| Parameter | Plot |
|---|---|
| CZT HV Monitor | 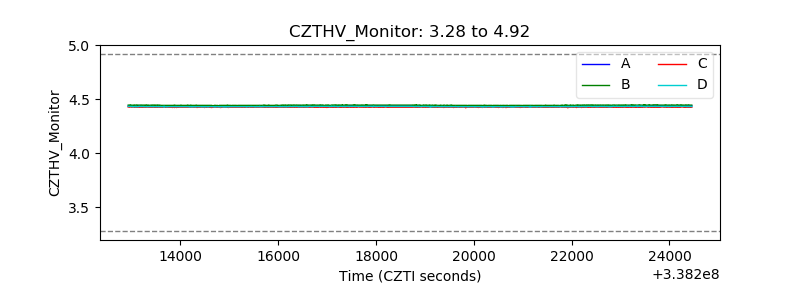 |
| D_VDD |  |
| Temperature 1 | 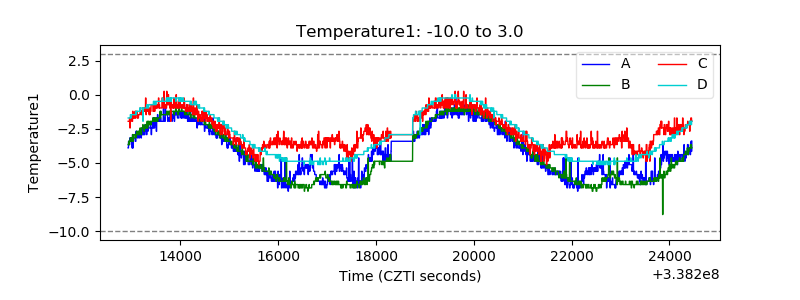 |
| Veto HV Monitor | 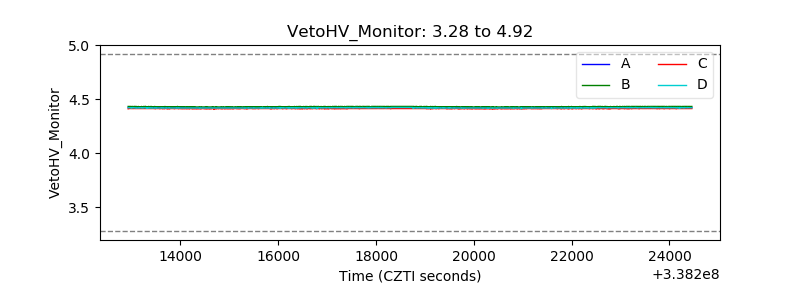 |
| Veto LLD | 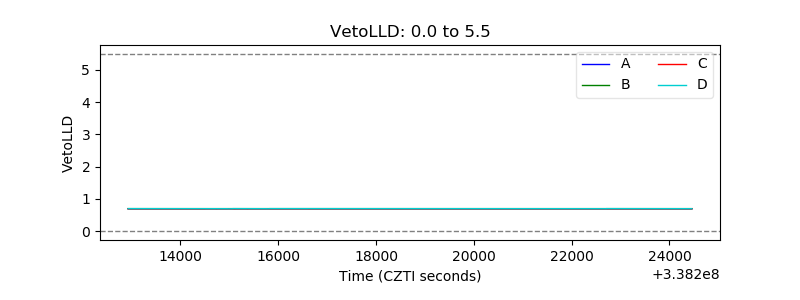 |
| Alpha Counter |  |
| _CPM_Rate | 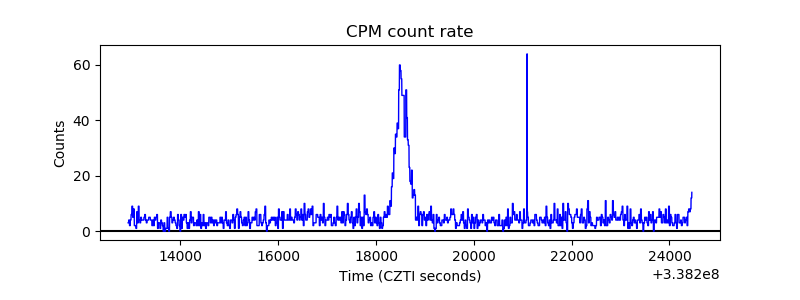 |
| CZT Counter | 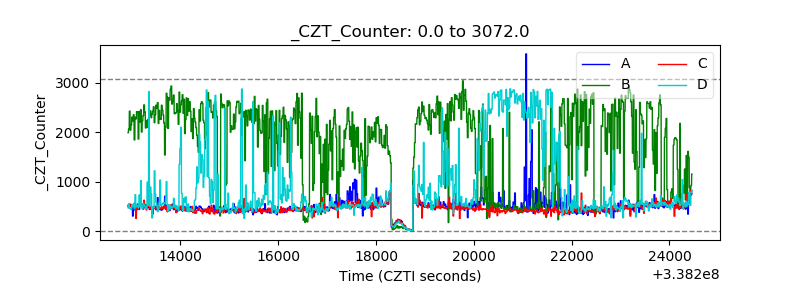 |
| +2.5 Volts monitor | 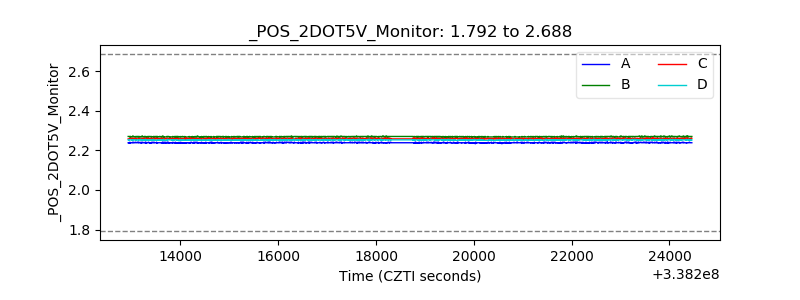 |
| +5 Volts monitor |  |
| _ROLL_ROT | 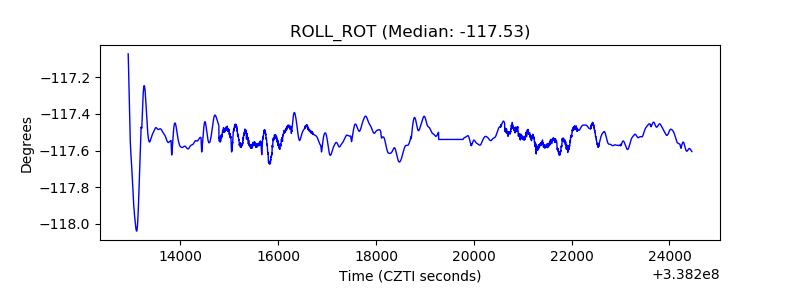 |
| _Roll_DEC | 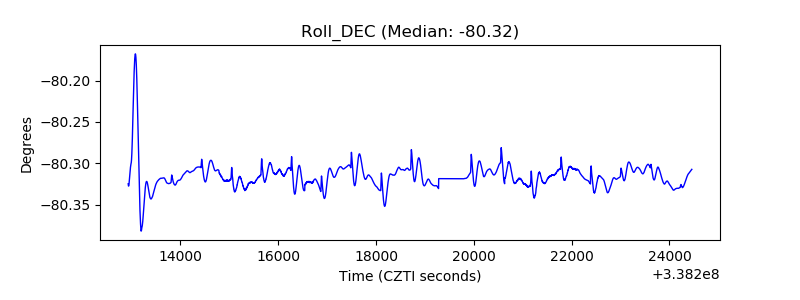 |
| _Roll_RA | 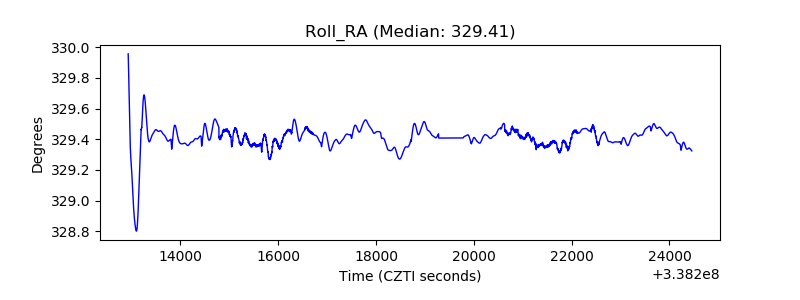 |
| Veto Counter | 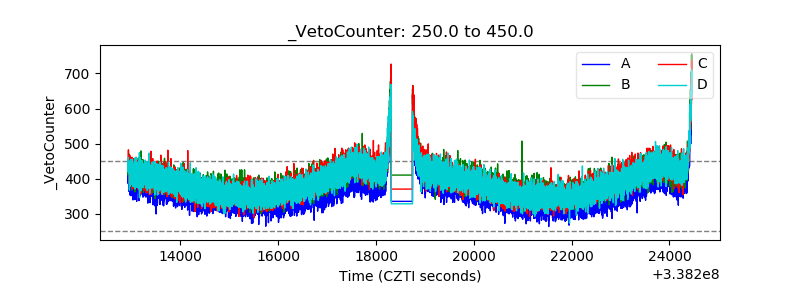 |