| Param | Original file | Final file |
|---|---|---|
| Filename | modeM0/AS1C05_019T03_9000003898cztM0_level2.fits | modeM0/AS1C05_019T03_9000003898cztM0_level2_quad_clean.evt |
| Size (bytes) | 782,072,640 | 989,599,680 |
| Size | 745.8 MB | 943.8 MB |
| Events in quadrant A | 3,797,266 | 4,540,215 |
| Events in quadrant B | 4,599,200 | 6,287,620 |
| Events in quadrant C | 5,014,512 | 6,975,244 |
| Events in quadrant D | 4,337,228 | 6,256,528 |
| Mode M0 | |||
|---|---|---|---|
| Quadrant | BADHDUFLAG | Total packets | Discarded packets |
| A | 0 | 406138 | 0 |
| B | 0 | 302930 | 0 |
| C | 0 | 180911 | 0 |
| D | 0 | 233249 | 0 |
| Mode M9 | |||
|---|---|---|---|
| Quadrant | BADHDUFLAG | Total packets | Discarded packets |
| A | 0 | 123 | 0 |
| B | 0 | 123 | 0 |
| C | 0 | 123 | 0 |
| D | 0 | 123 | 0 |
| Mode SS | |||
|---|---|---|---|
| Quadrant | BADHDUFLAG | Total packets | Discarded packets |
| A | 0 | 1764 | 0 |
| B | 0 | 1764 | 0 |
| C | 0 | 1764 | 0 |
| D | 0 | 1764 | 0 |
| Quadrant | Total seconds | Saturated seconds | Saturation percentage |
|---|---|---|---|
| A | 86193 | 36117 | 41.902475% |
| B | 86188 | 15952 | 18.508377% |
| C | 86228 | 1447 | 1.678109% |
| D | 86219 | 4305 | 4.993099% |
Noise dominated data is calculated using 1-second bins in cleaned event files. If a bin has >2000 counts, and if more than 50% of those come from <1% of pixels, then it is considered to be noise-dominated and hence unusable.
| Quadrant | # 1 sec bins | Bins with >0 counts | Bins with >2000 counts | High rate bins dominated by noise | Noise dominated (total time) | Noise dominated (detector-on time) | Marked lightcurve |
|---|---|---|---|---|---|---|---|
| A | 99083 | 85731 | 0 | 0 | 0.00% | 0.00% |  |
| B | 99083 | 86156 | 0 | 0 | 0.00% | 0.00% |  |
| C | 99083 | 86252 | 0 | 0 | 0.00% | 0.00% |  |
| D | 99083 | 86204 | 0 | 0 | 0.00% | 0.00% |  |
Top three noisy pixels from each quadrant. If the there are fewer than three noisy pixels in the level2.evt file, extra rows are filled as -1
| Pixel properties | Quadrant properties | ||||||
|---|---|---|---|---|---|---|---|
| Quadrant | DetID | PixID | Counts | Sigma | Mean | Median | Sigma |
| A | 0 | 29 | 3221 | 9.49 | 990 | 934 | 241.0 |
| A | 7 | 110 | 3084 | 8.92 | 990 | 934 | 241.0 |
| A | 0 | 30 | 2876 | 8.06 | 990 | 934 | 241.0 |
| B | 2 | 9 | 3657 | 10.48 | 1216 | 1164 | 237.8 |
| B | 5 | 128 | 3152 | 8.36 | 1216 | 1164 | 237.8 |
| B | 5 | 255 | 3082 | 8.06 | 1216 | 1164 | 237.8 |
| C | 12 | 241 | 3601 | 7.04 | 1327 | 1247 | 334.2 |
| C | 9 | 209 | 3394 | 6.42 | 1327 | 1247 | 334.2 |
| C | 3 | 126 | 3368 | 6.35 | 1327 | 1247 | 334.2 |
| D | 4 | 246 | 3451 | 7.06 | 1236 | 1128 | 329.2 |
| D | 3 | 14 | 3196 | 6.28 | 1236 | 1128 | 329.2 |
| D | 10 | 189 | 3140 | 6.11 | 1236 | 1128 | 329.2 |
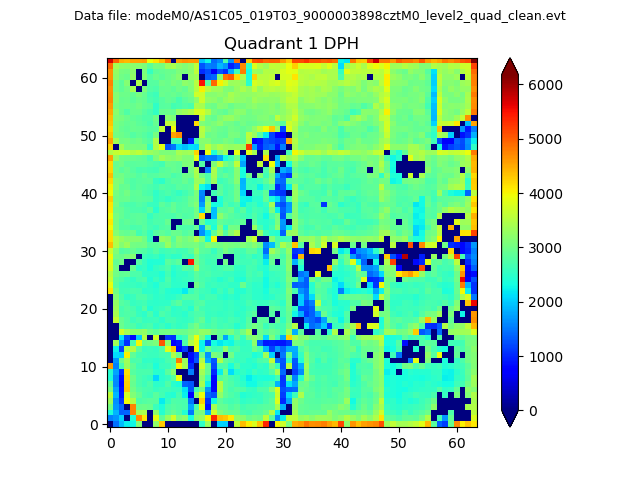
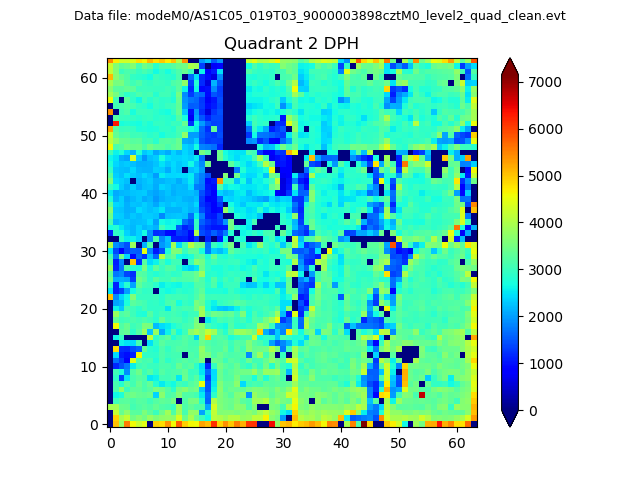
Histogram calculated using DETX and DETY for each event in the final _common_clean file
| Quadrant A |  |
 |
Quadrant B |
|---|---|---|---|
| Quadrant D | 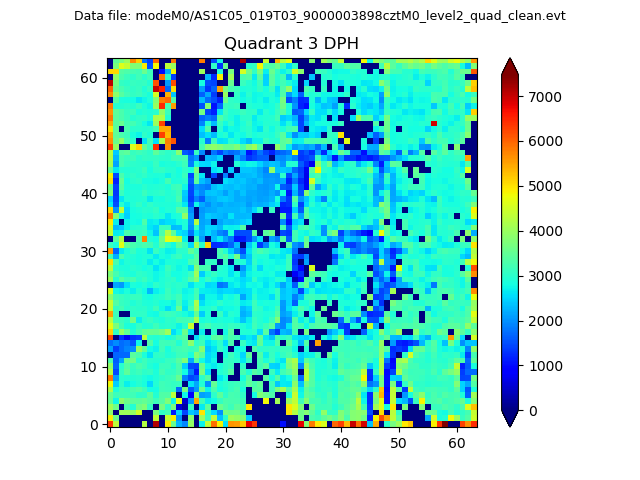 |
 |
Quadrant C |
| Plot type | Count rate plots | Images |
|---|---|---|
| Comparison with Poisson distribution Blue bars denote a histogram of data divided into 1 sec bins. Red curve is a Poisson curve with rate = median count rate of data. |
 |
 |
| Quadrant-wise count rates Data is divided into 100 sec bins |
 |
|
| Module-wise count rates for Quadrant A Data is divided into 100 sec bins |
 |
 |
| Module-wise count rates for Quadrant B Data is divided into 100 sec bins |
 |
 |
| Module-wise count rates for Quadrant C Data is divided into 100 sec bins |
 |
 |
| Module-wise count rates for Quadrant D Data is divided into 100 sec bins |
 |
 |
| Parameter | Plot |
|---|---|
| CZT HV Monitor |  |
| D_VDD |  |
| Temperature 1 |  |
| Veto HV Monitor |  |
| Veto LLD |  |
| Alpha Counter |  |
| _CPM_Rate |  |
| CZT Counter |  |
| +2.5 Volts monitor |  |
| +5 Volts monitor |  |
| _ROLL_ROT |  |
| _Roll_DEC |  |
| _Roll_RA |  |
| Veto Counter |  |