| Param | Original file | Final file |
|---|---|---|
| Filename | modeM0/AS1C05_019T03_9000003898_26957cztM0_level2.evt | modeM0/AS1C05_019T03_9000003898_26957cztM0_level2_quad_clean.evt |
| Size (bytes) | 486,645,120 | 84,156,480 |
| Size | 464.1 MB | 80.3 MB |
| Events in quadrant A | 3,074,160 | 566,342 |
| Events in quadrant B | 6,550,388 | 513,808 |
| Events in quadrant C | 2,249,068 | 580,860 |
| Events in quadrant D | 2,554,275 | 565,782 |
| Mode M0 | |||
|---|---|---|---|
| Quadrant | BADHDUFLAG | Total packets | Discarded packets |
| A | 0 | 12112 | 0 |
| B | 0 | 22585 | 0 |
| C | 0 | 9531 | 0 |
| D | 0 | 10616 | 0 |
| Mode M9 | |||
|---|---|---|---|
| Quadrant | BADHDUFLAG | Total packets | Discarded packets |
| A | 0 | 1 | 0 |
| B | 0 | 1 | 0 |
| C | 0 | 1 | 0 |
| D | 0 | 1 | 0 |
| Quadrant | Total seconds | Saturated seconds | Saturation percentage |
|---|---|---|---|
| A | 4559 | 449 | 9.848651% |
| B | 4559 | 1878 | 41.193244% |
| C | 4559 | 147 | 3.224391% |
| D | 4558 | 139 | 3.049583% |
Noise dominated data is calculated using 1-second bins in cleaned event files. If a bin has >2000 counts, and if more than 50% of those come from <1% of pixels, then it is considered to be noise-dominated and hence unusable.
| Quadrant | # 1 sec bins | Bins with >0 counts | Bins with >2000 counts | High rate bins dominated by noise | Noise dominated (total time) | Noise dominated (detector-on time) | Marked lightcurve |
|---|---|---|---|---|---|---|---|
| A | 4699 | 4559 | 193 | 193 | 4.11% | 4.23% | 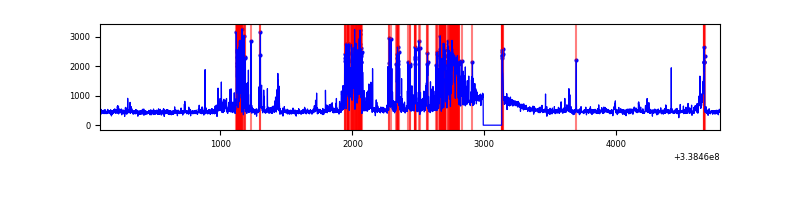 |
| B | 4699 | 4559 | 1186 | 1186 | 25.24% | 26.01% | 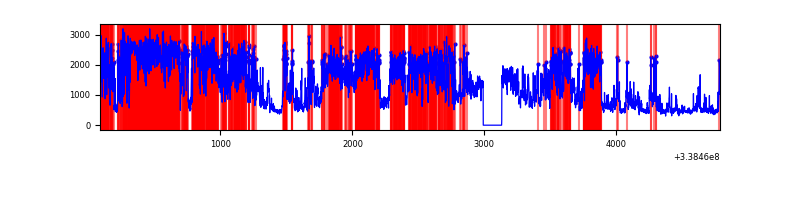 |
| C | 4699 | 4560 | 0 | 0 | 0.00% | 0.00% | 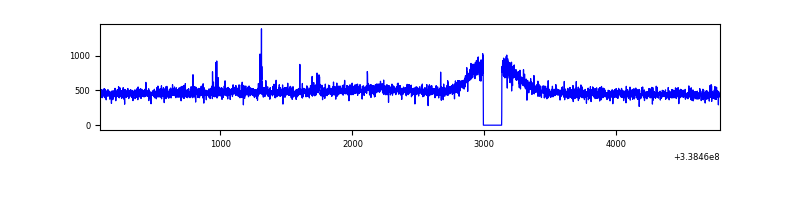 |
| D | 4698 | 4558 | 45 | 45 | 0.96% | 0.99% | 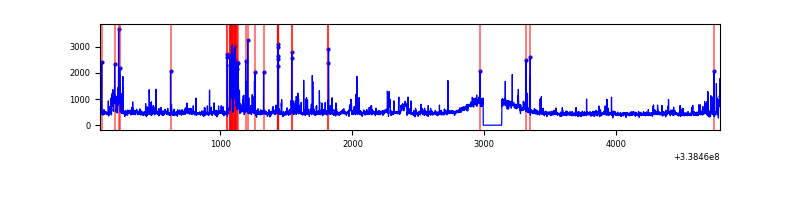 |
Top three noisy pixels from each quadrant. If the there are fewer than three noisy pixels in the level2.evt file, extra rows are filled as -1
| Pixel properties | Quadrant properties | ||||||
|---|---|---|---|---|---|---|---|
| Quadrant | DetID | PixID | Counts | Sigma | Mean | Median | Sigma |
| A | 14 | 235 | 853094 | 7666.11 | 549 | 536 | 111.2 |
| A | 6 | 16 | 64539 | 575.51 | 549 | 536 | 111.2 |
| A | 8 | 192 | 22548 | 197.93 | 549 | 536 | 111.2 |
| B | 0 | 189 | 4522156 | 45831.12 | 507 | 493 | 98.7 |
| B | 5 | 172 | 22084 | 218.84 | 507 | 493 | 98.7 |
| B | 12 | 111 | 11658 | 113.17 | 507 | 493 | 98.7 |
| C | 14 | 238 | 85667 | 660.32 | 548 | 550 | 128.9 |
| C | 15 | 208 | 10929 | 80.52 | 548 | 550 | 128.9 |
| C | 2 | 16 | 9894 | 72.49 | 548 | 550 | 128.9 |
| D | 1 | 52 | 242923 | 1813.51 | 554 | 537 | 133.7 |
| D | 2 | 250 | 144823 | 1079.54 | 554 | 537 | 133.7 |
| D | 12 | 233 | 36664 | 270.3 | 554 | 537 | 133.7 |
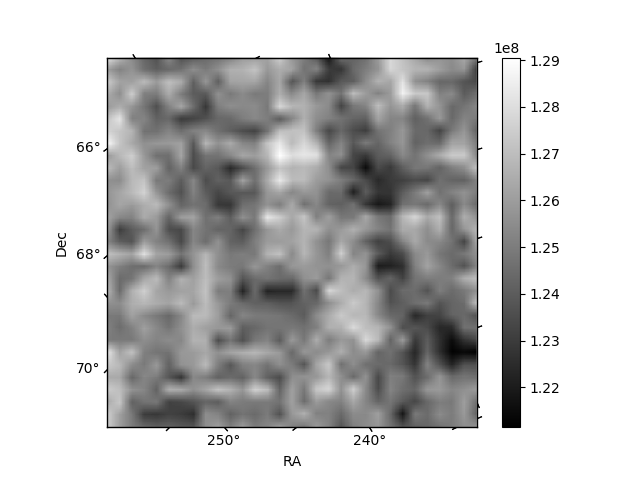
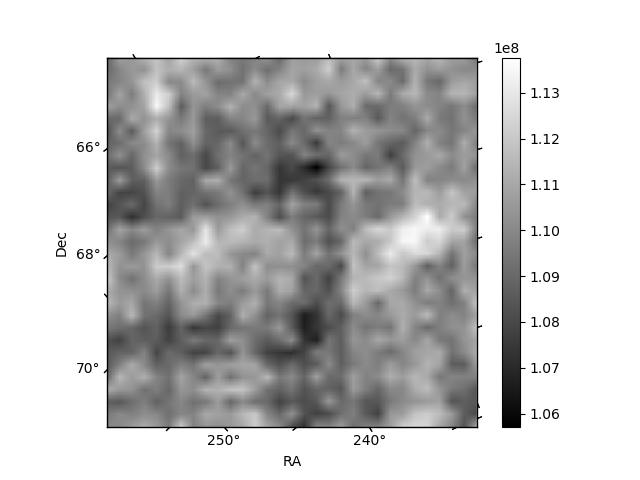
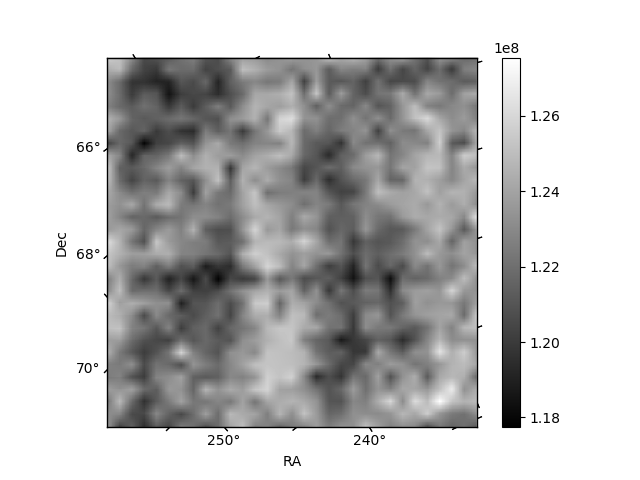
Histogram calculated using DETX and DETY for each event in the final _common_clean file
| Quadrant A | 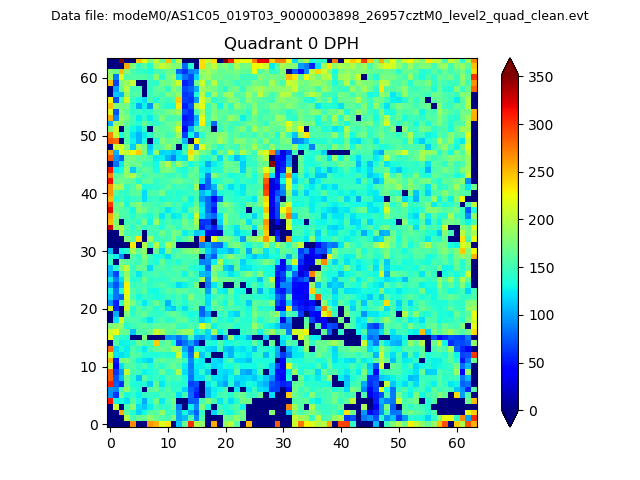 |
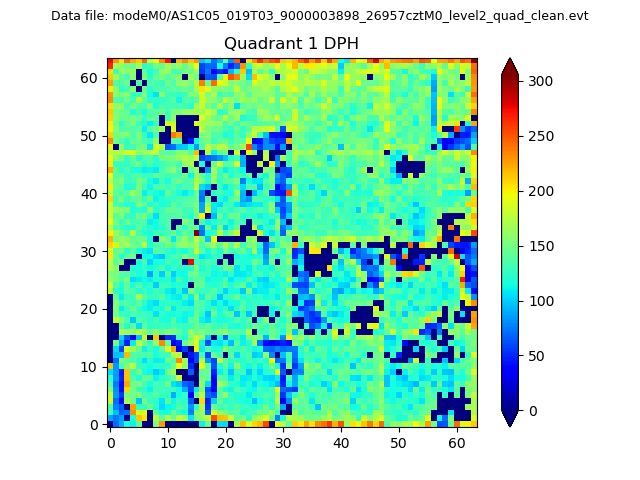 |
Quadrant B |
|---|---|---|---|
| Quadrant D | 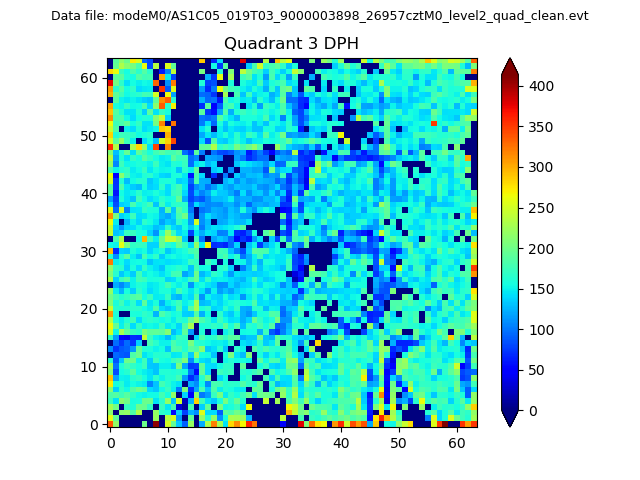 |
 |
Quadrant C |
| Plot type | Count rate plots | Images |
|---|---|---|
| Comparison with Poisson distribution Blue bars denote a histogram of data divided into 1 sec bins. Red curve is a Poisson curve with rate = median count rate of data. |
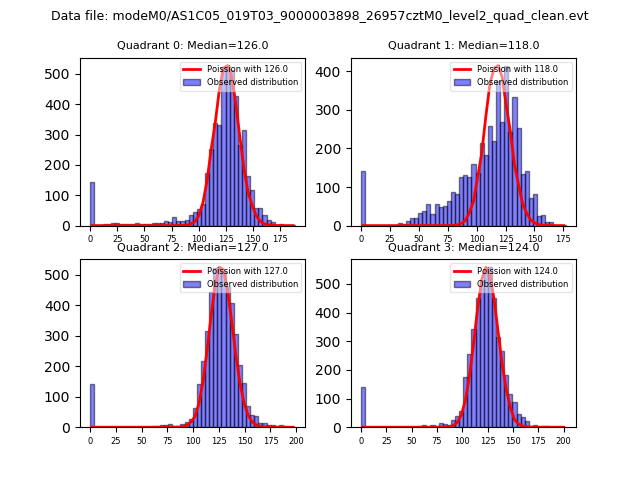 |
 |
| Quadrant-wise count rates Data is divided into 100 sec bins |
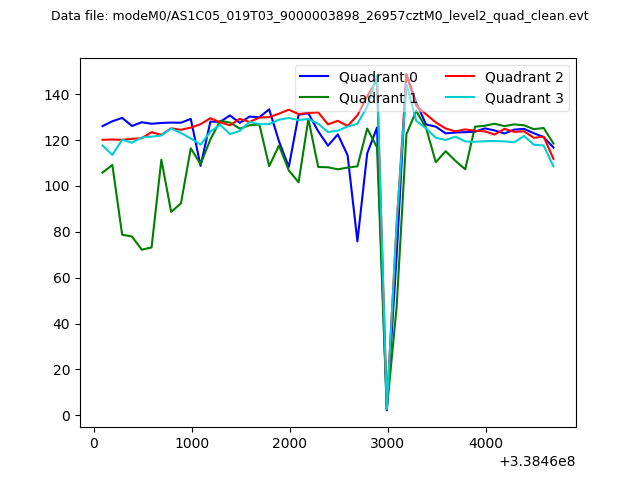 |
|
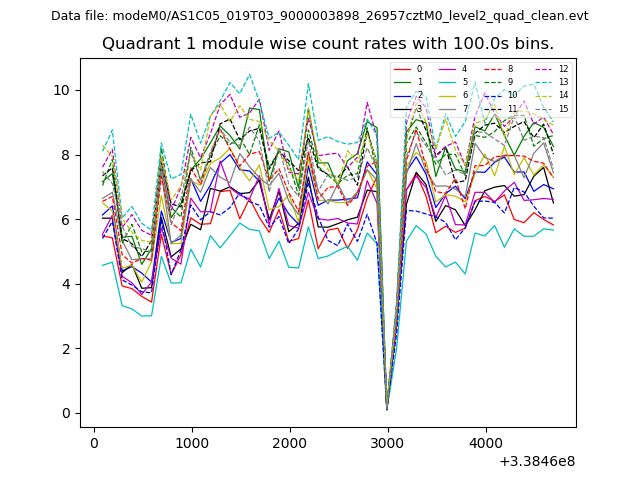
| Module-wise count rates for Quadrant A Data is divided into 100 sec bins |
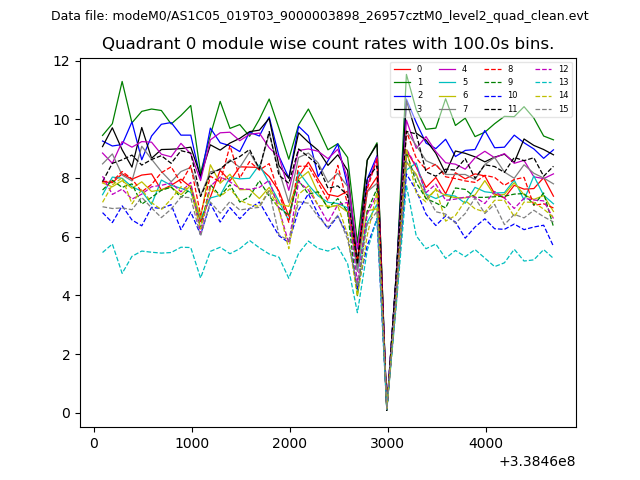 |
 |
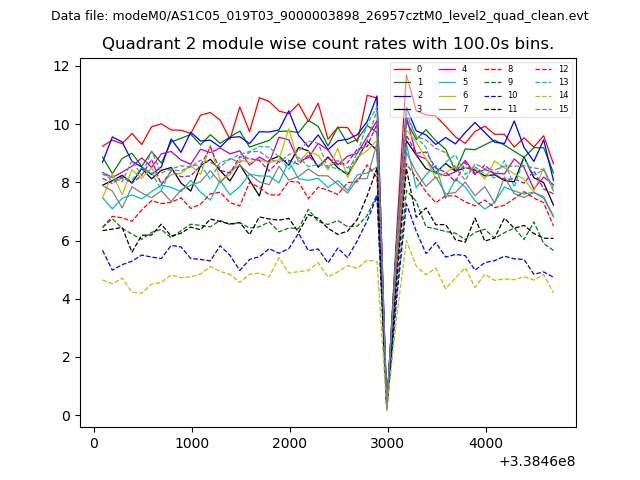
| Module-wise count rates for Quadrant B Data is divided into 100 sec bins |
 |
 |
| Module-wise count rates for Quadrant C Data is divided into 100 sec bins |
 |
 |
| Module-wise count rates for Quadrant D Data is divided into 100 sec bins |
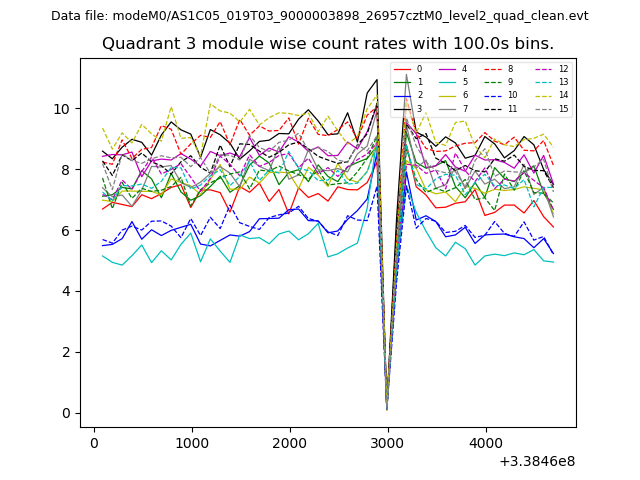 |
 |
| Parameter | Plot |
|---|---|
| CZT HV Monitor | 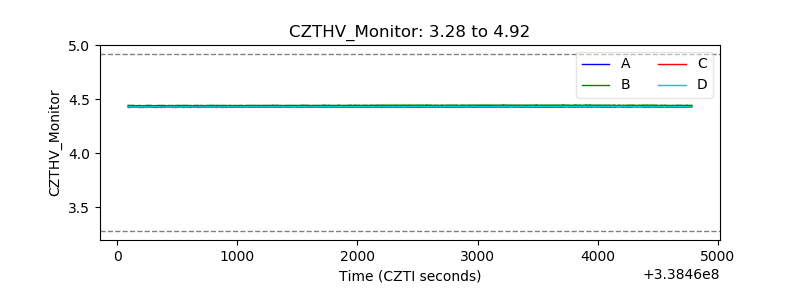 |
| D_VDD | 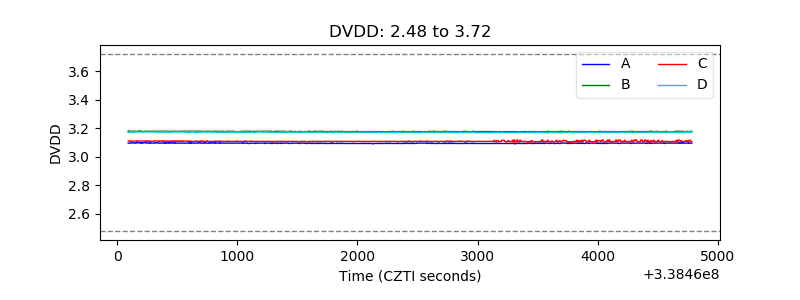 |
| Temperature 1 |  |
| Veto HV Monitor | 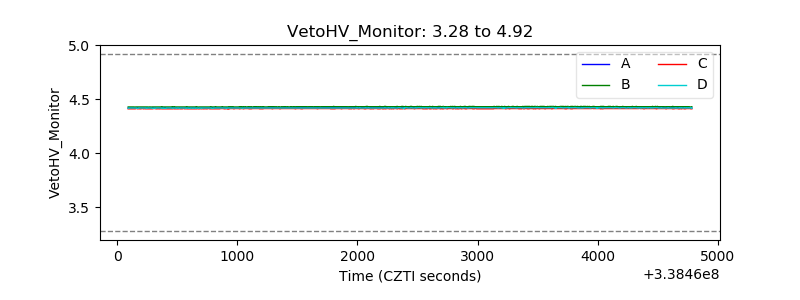 |
| Veto LLD | 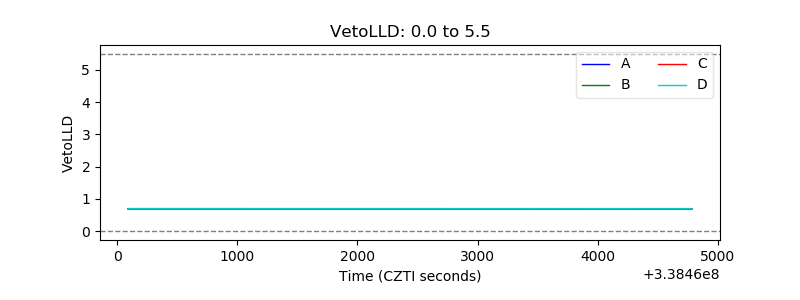 |
| Alpha Counter | 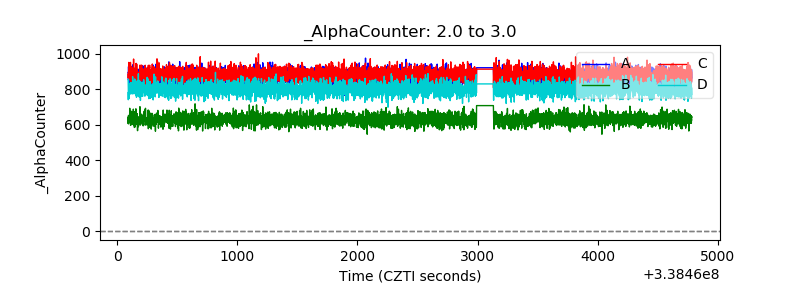 |
| _CPM_Rate | 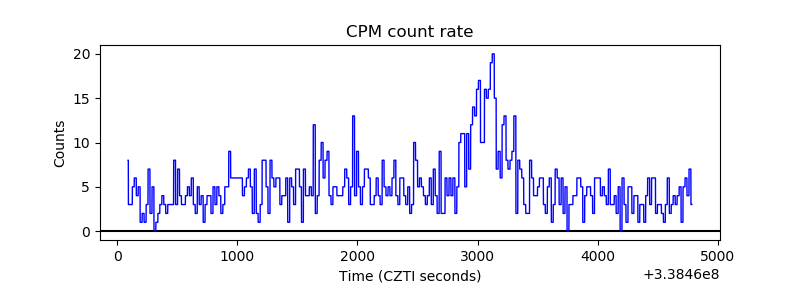 |
| CZT Counter |  |
| +2.5 Volts monitor | 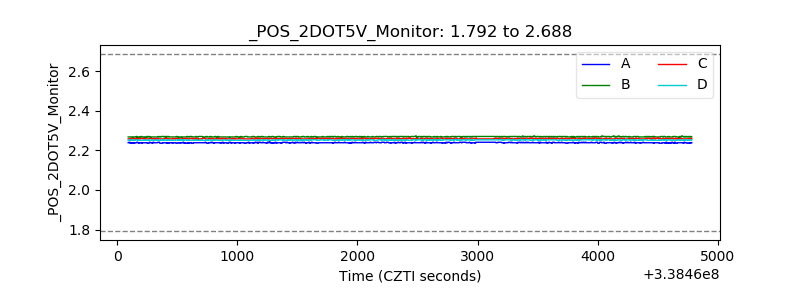 |
| +5 Volts monitor | 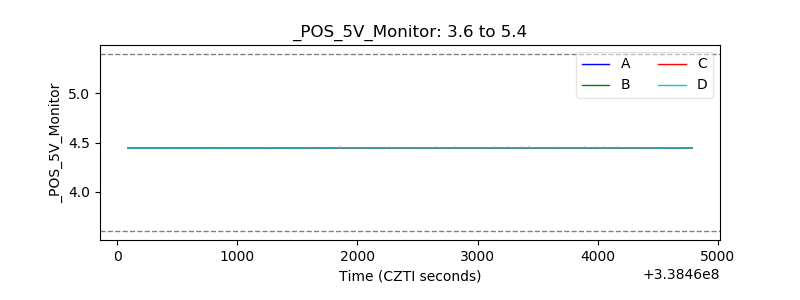 |
| _ROLL_ROT | 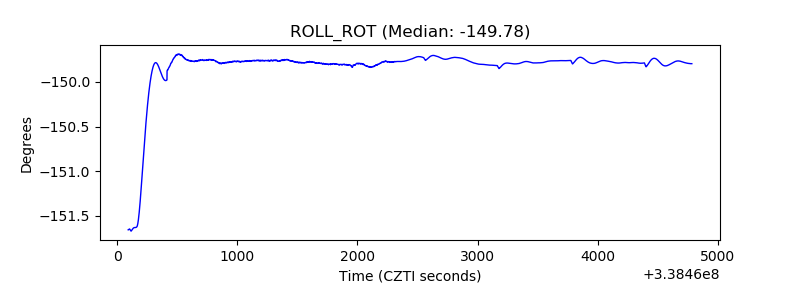 |
| _Roll_DEC | 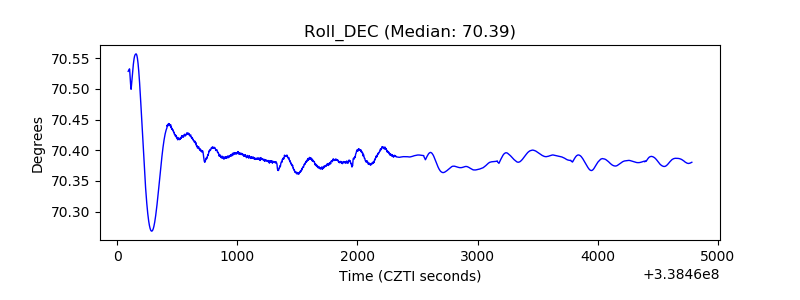 |
| _Roll_RA | 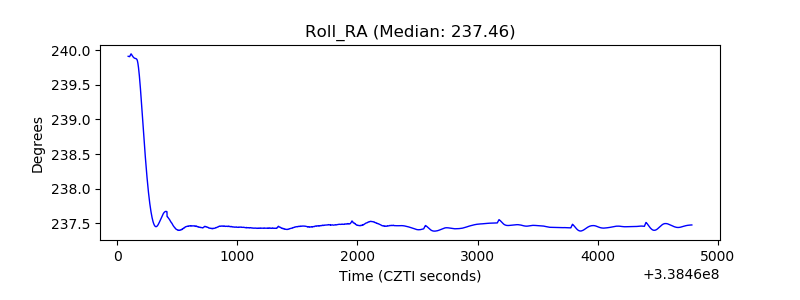 |
| Veto Counter | 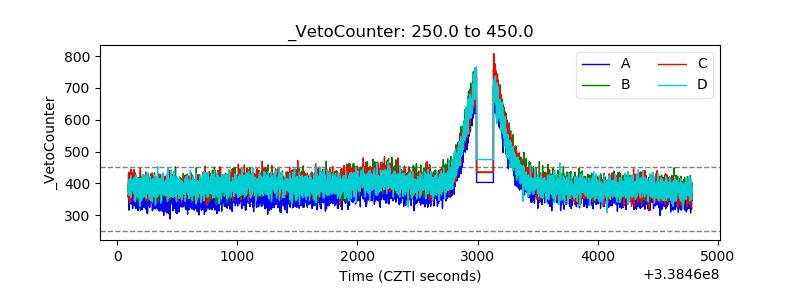 |