| Param | Original file | Final file |
|---|---|---|
| Filename | modeM0/AS1C05_019T03_9000003898_26960cztM0_level2.evt | modeM0/AS1C05_019T03_9000003898_26960cztM0_level2_quad_clean.evt |
| Size (bytes) | 1,550,597,760 | 222,347,520 |
| Size | 1.4 GB | 212.0 MB |
| Events in quadrant A | 8,364,967 | 1,527,475 |
| Events in quadrant B | 20,167,595 | 1,340,107 |
| Events in quadrant C | 6,185,326 | 1,550,614 |
| Events in quadrant D | 11,393,152 | 1,440,891 |
| Mode M0 | |||
|---|---|---|---|
| Quadrant | BADHDUFLAG | Total packets | Discarded packets |
| A | 0 | 33236 | 0 |
| B | 0 | 68403 | 0 |
| C | 0 | 26521 | 0 |
| D | 0 | 42355 | 0 |
| Mode M9 | |||
|---|---|---|---|
| Quadrant | BADHDUFLAG | Total packets | Discarded packets |
| A | 0 | 12 | 0 |
| B | 0 | 12 | 0 |
| C | 0 | 12 | 0 |
| D | 0 | 12 | 0 |
| Quadrant | Total seconds | Saturated seconds | Saturation percentage |
|---|---|---|---|
| A | 12616 | 1026 | 8.132530% |
| B | 12617 | 5845 | 46.326385% |
| C | 12617 | 146 | 1.157169% |
| D | 12617 | 1422 | 11.270508% |
Noise dominated data is calculated using 1-second bins in cleaned event files. If a bin has >2000 counts, and if more than 50% of those come from <1% of pixels, then it is considered to be noise-dominated and hence unusable.
| Quadrant | # 1 sec bins | Bins with >0 counts | Bins with >2000 counts | High rate bins dominated by noise | Noise dominated (total time) | Noise dominated (detector-on time) | Marked lightcurve |
|---|---|---|---|---|---|---|---|
| A | 13871 | 12617 | 636 | 636 | 4.59% | 5.04% | 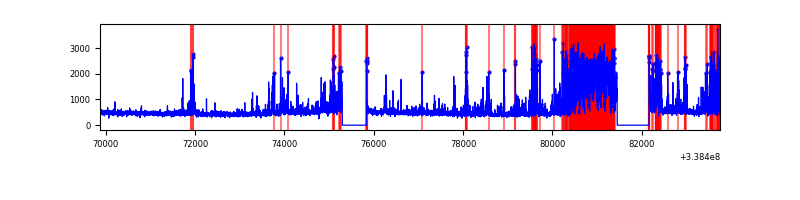 |
| B | 13871 | 12616 | 4691 | 4691 | 33.82% | 37.18% | 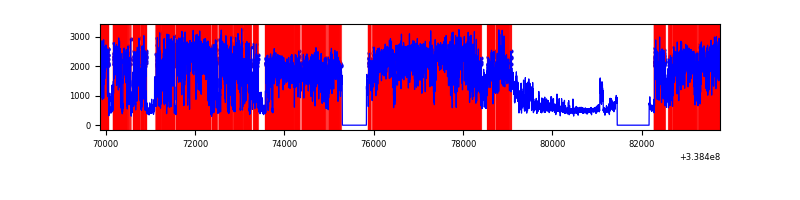 |
| C | 13872 | 12617 | 5 | 5 | 0.04% | 0.04% | 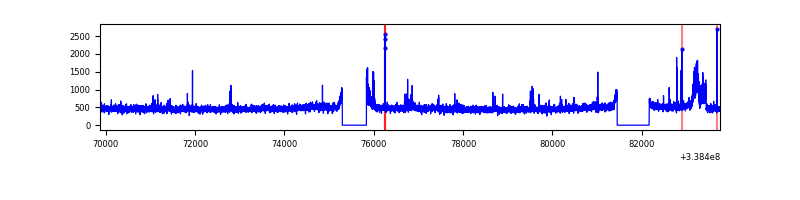 |
| D | 13872 | 12617 | 1265 | 1265 | 9.12% | 10.03% | 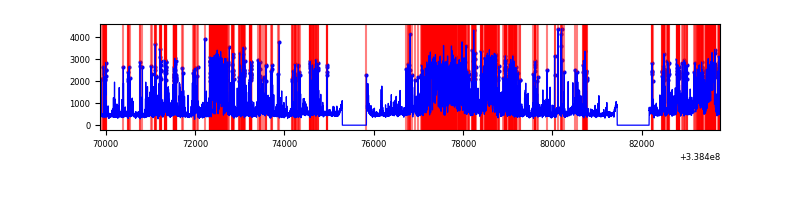 |
Top three noisy pixels from each quadrant. If the there are fewer than three noisy pixels in the level2.evt file, extra rows are filled as -1
| Pixel properties | Quadrant properties | ||||||
|---|---|---|---|---|---|---|---|
| Quadrant | DetID | PixID | Counts | Sigma | Mean | Median | Sigma |
| A | 14 | 235 | 2632821 | 9162.03 | 1444 | 1413 | 287.2 |
| A | 6 | 16 | 71334 | 243.45 | 1444 | 1413 | 287.2 |
| A | 8 | 192 | 29773 | 98.74 | 1444 | 1413 | 287.2 |
| B | 0 | 189 | 14492914 | 59055.92 | 1311 | 1277 | 245.4 |
| B | 5 | 172 | 447400 | 1818.03 | 1311 | 1277 | 245.4 |
| B | 12 | 111 | 29568 | 115.29 | 1311 | 1277 | 245.4 |
| C | 2 | 16 | 243208 | 722.72 | 1436 | 1440 | 334.5 |
| C | 14 | 238 | 229380 | 681.39 | 1436 | 1440 | 334.5 |
| C | 15 | 208 | 56010 | 163.13 | 1436 | 1440 | 334.5 |
| D | 2 | 250 | 2822405 | 8397.17 | 1402 | 1361 | 336.0 |
| D | 1 | 52 | 2189898 | 6514.44 | 1402 | 1361 | 336.0 |
| D | 12 | 233 | 826078 | 2454.87 | 1402 | 1361 | 336.0 |
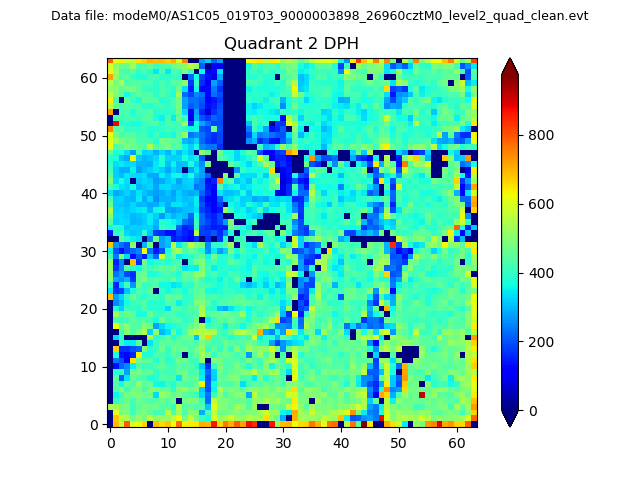
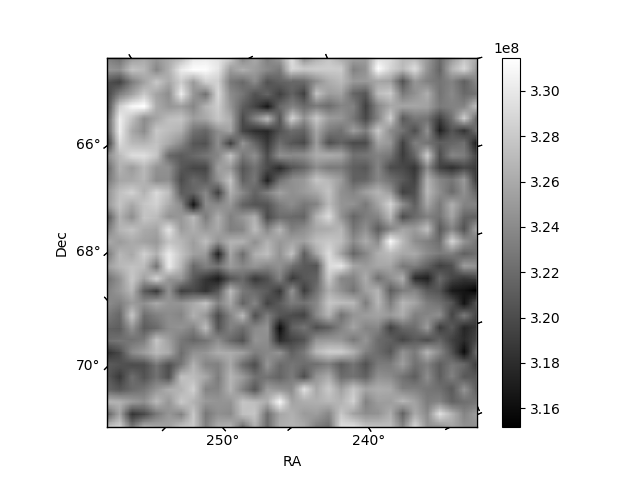
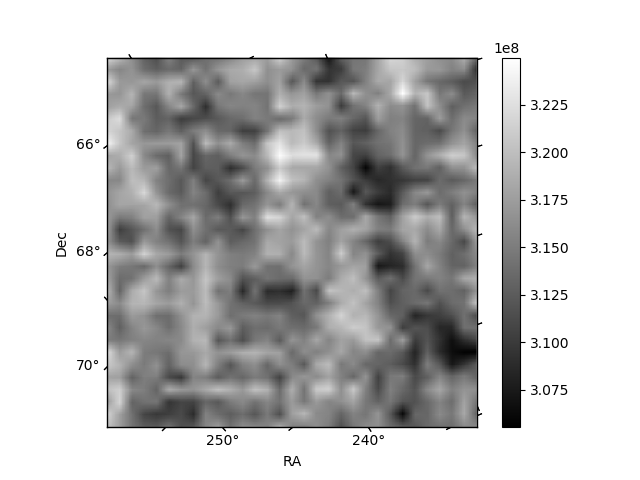
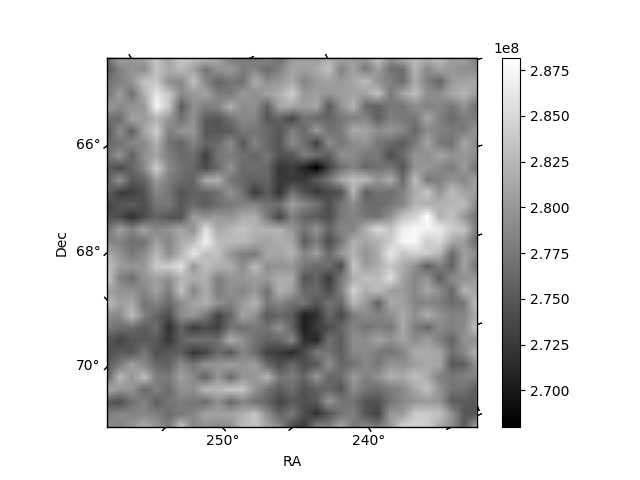
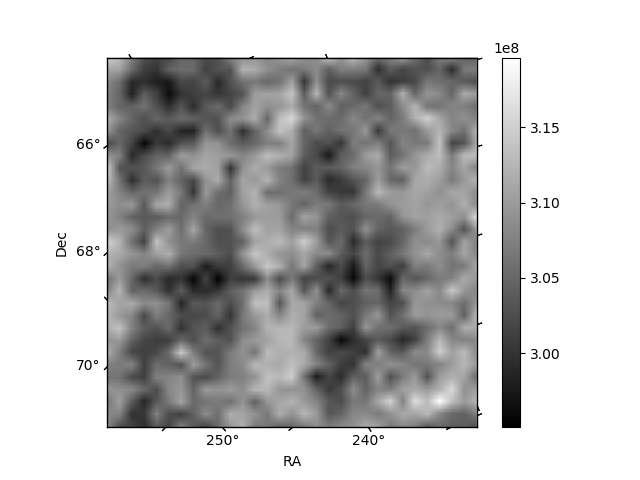
Histogram calculated using DETX and DETY for each event in the final _common_clean file
| Quadrant A | 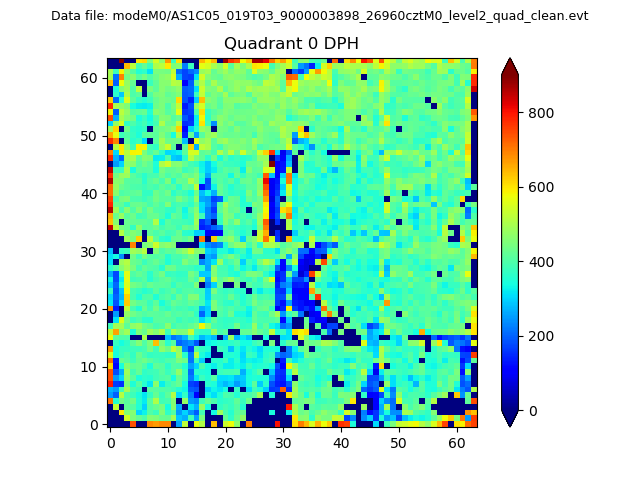 |
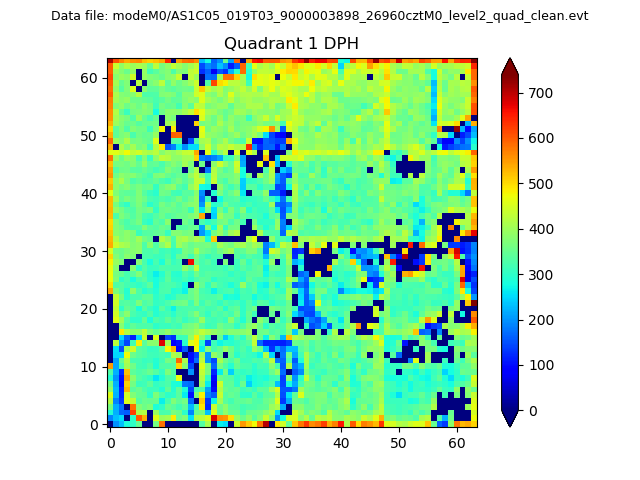 |
Quadrant B |
|---|---|---|---|
| Quadrant D | 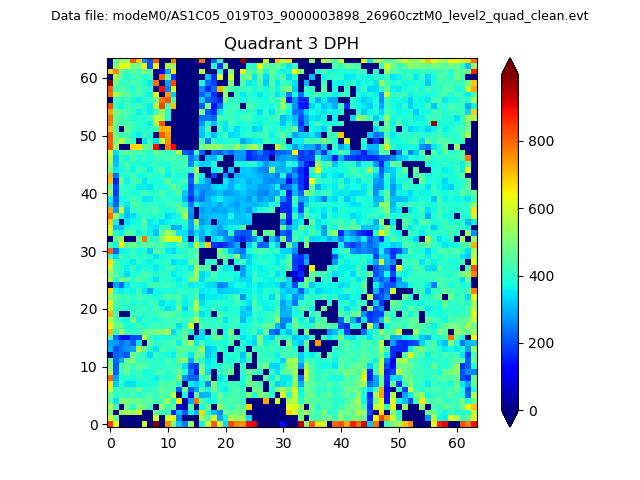 |
 |
Quadrant C |
| Plot type | Count rate plots | Images |
|---|---|---|
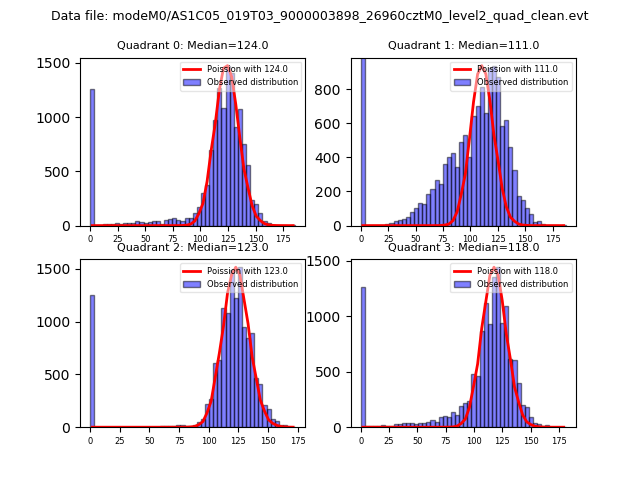
| Comparison with Poisson distribution Blue bars denote a histogram of data divided into 1 sec bins. Red curve is a Poisson curve with rate = median count rate of data. |
 |
 |
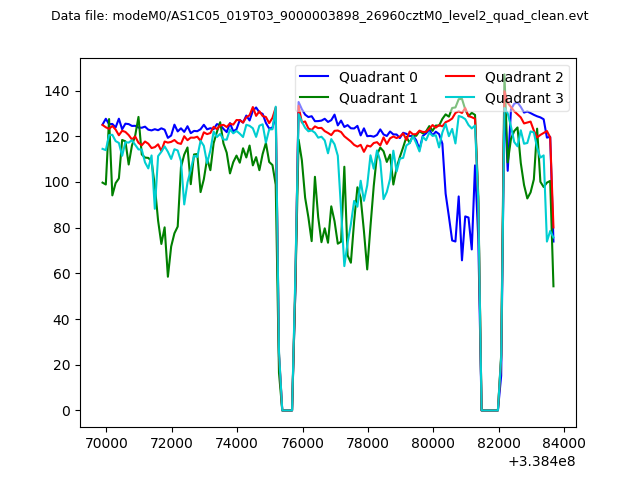
| Quadrant-wise count rates Data is divided into 100 sec bins |
 |
|
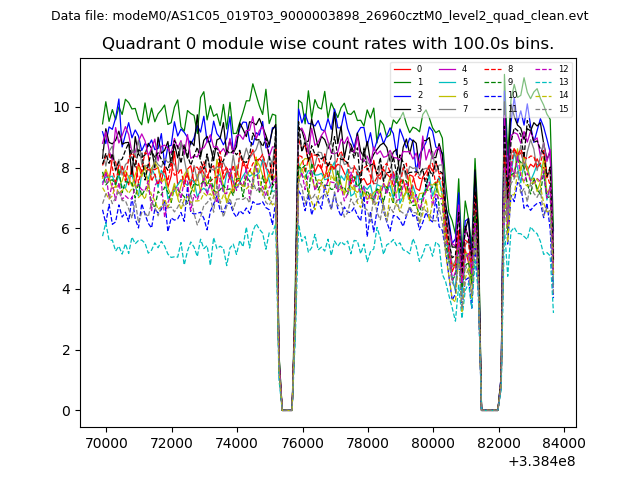
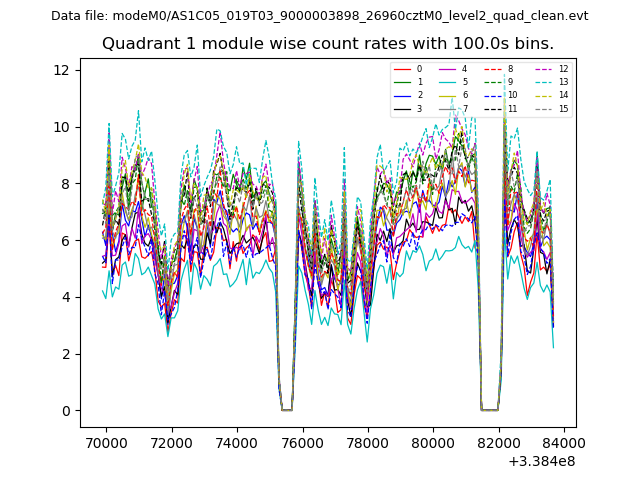
| Module-wise count rates for Quadrant A Data is divided into 100 sec bins |
 |
 |
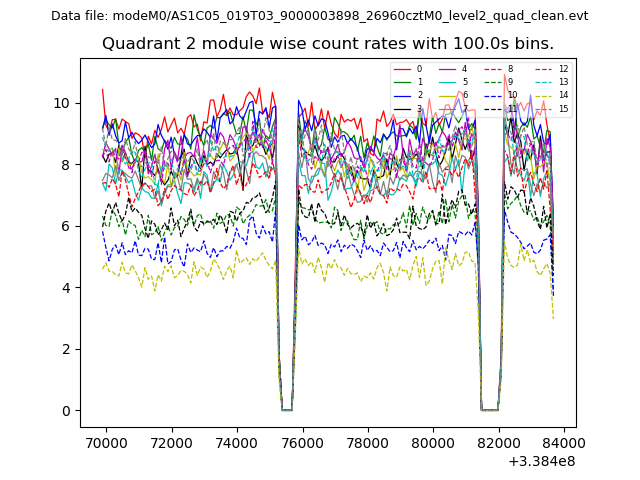
| Module-wise count rates for Quadrant B Data is divided into 100 sec bins |
 |
 |
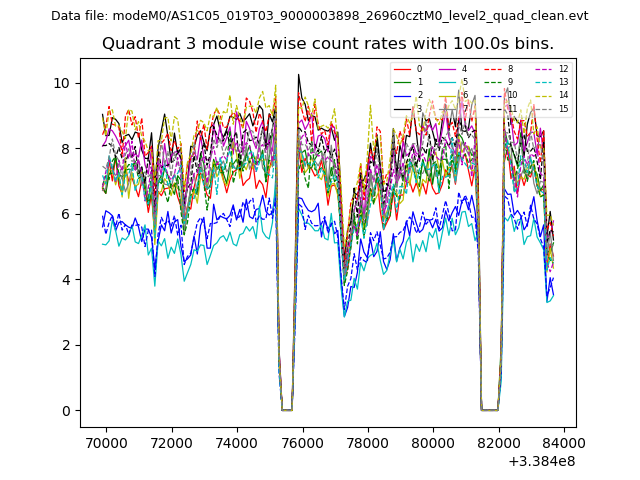
| Module-wise count rates for Quadrant C Data is divided into 100 sec bins |
 |
 |
| Module-wise count rates for Quadrant D Data is divided into 100 sec bins |
 |
 |
| Parameter | Plot |
|---|---|
| CZT HV Monitor | 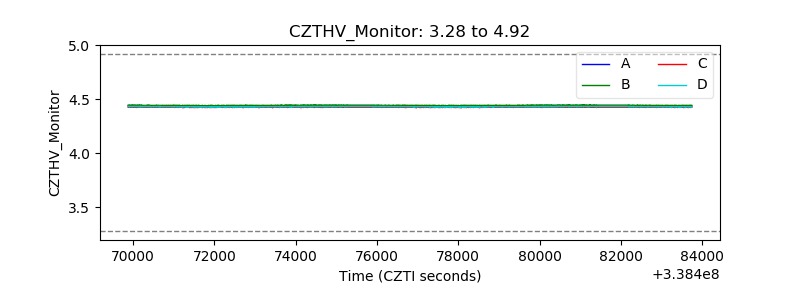 |
| D_VDD | 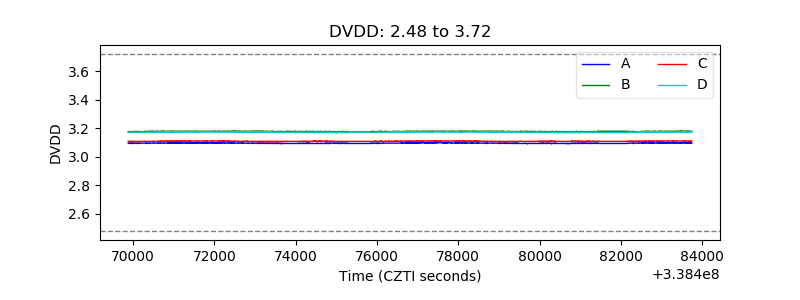 |
| Temperature 1 | 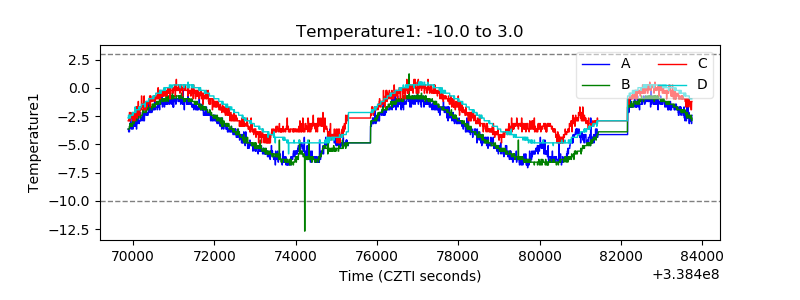 |
| Veto HV Monitor | 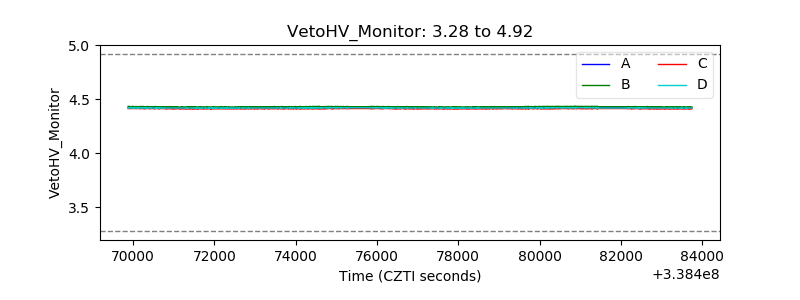 |
| Veto LLD |  |
| Alpha Counter | 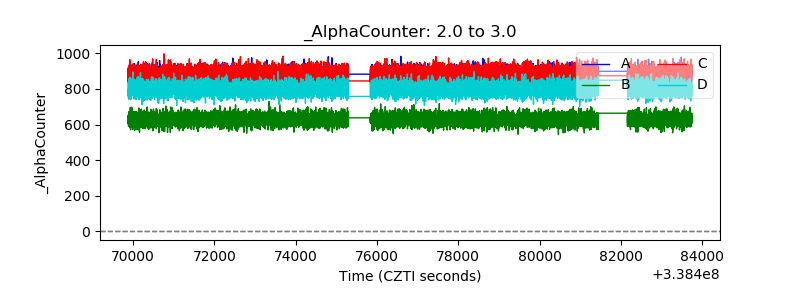 |
| _CPM_Rate |  |
| CZT Counter | 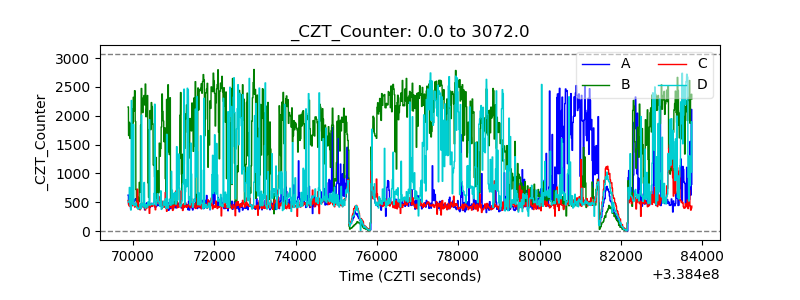 |
| +2.5 Volts monitor |  |
| +5 Volts monitor |  |
| _ROLL_ROT | 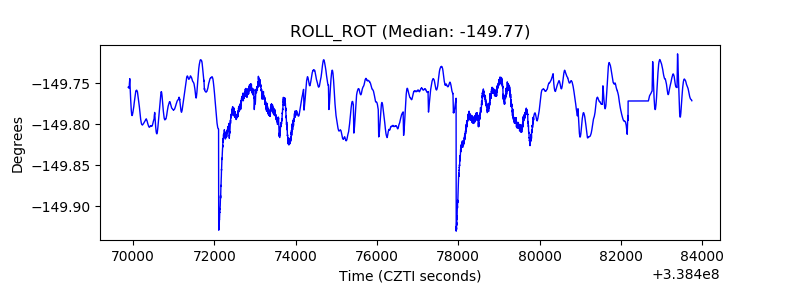 |
| _Roll_DEC | 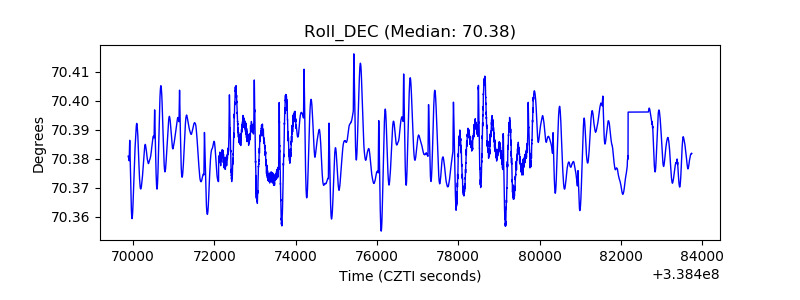 |
| _Roll_RA |  |
| Veto Counter | 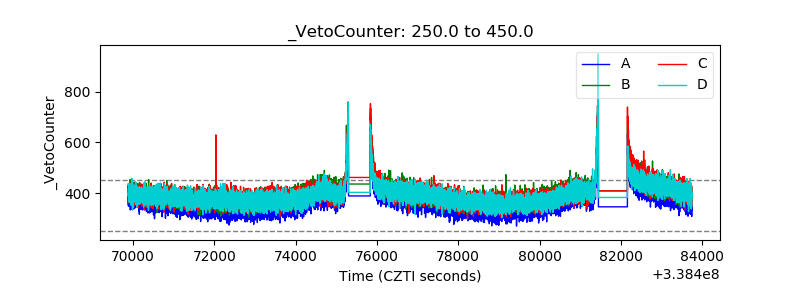 |