| Param | Original file | Final file |
|---|---|---|
| Filename | modeM0/AS1C05_019T03_9000003898_26961cztM0_level2.evt | modeM0/AS1C05_019T03_9000003898_26961cztM0_level2_quad_clean.evt |
| Size (bytes) | 644,549,760 | 119,972,160 |
| Size | 614.7 MB | 114.4 MB |
| Events in quadrant A | 3,667,739 | 822,691 |
| Events in quadrant B | 6,889,749 | 776,545 |
| Events in quadrant C | 3,326,744 | 811,288 |
| Events in quadrant D | 5,196,683 | 769,614 |
| Mode M0 | |||
|---|---|---|---|
| Quadrant | BADHDUFLAG | Total packets | Discarded packets |
| A | 0 | 15079 | 0 |
| B | 0 | 24733 | 0 |
| C | 0 | 14082 | 0 |
| D | 0 | 19912 | 0 |
| Mode M9 | |||
|---|---|---|---|
| Quadrant | BADHDUFLAG | Total packets | Discarded packets |
| A | 0 | 8 | 0 |
| B | 0 | 8 | 0 |
| C | 0 | 8 | 0 |
| D | 0 | 8 | 0 |
| Quadrant | Total seconds | Saturated seconds | Saturation percentage |
|---|---|---|---|
| A | 6481 | 133 | 2.052152% |
| B | 6481 | 1487 | 22.943990% |
| C | 6481 | 113 | 1.743558% |
| D | 6482 | 481 | 7.420549% |
Noise dominated data is calculated using 1-second bins in cleaned event files. If a bin has >2000 counts, and if more than 50% of those come from <1% of pixels, then it is considered to be noise-dominated and hence unusable.
| Quadrant | # 1 sec bins | Bins with >0 counts | Bins with >2000 counts | High rate bins dominated by noise | Noise dominated (total time) | Noise dominated (detector-on time) | Marked lightcurve |
|---|---|---|---|---|---|---|---|
| A | 7376 | 6481 | 76 | 76 | 1.03% | 1.17% | 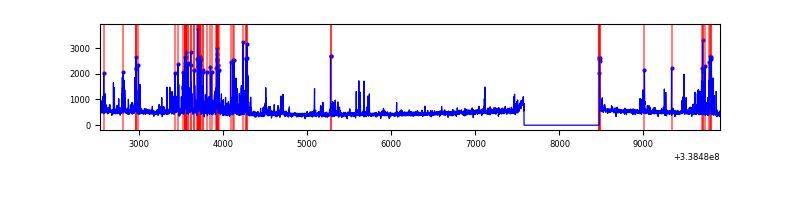 |
| B | 7376 | 6481 | 1212 | 1212 | 16.43% | 18.70% | 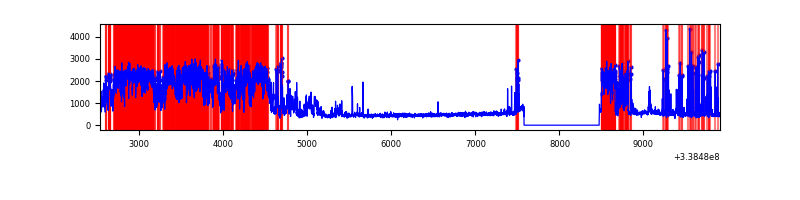 |
| C | 7376 | 6481 | 15 | 15 | 0.20% | 0.23% | 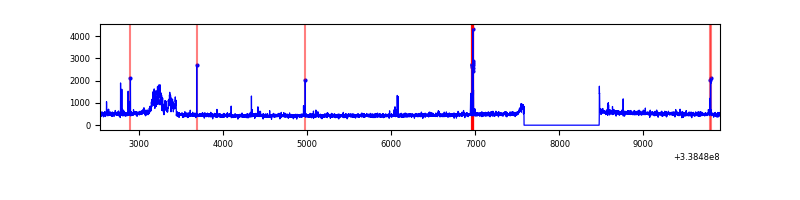 |
| D | 7377 | 6482 | 433 | 433 | 5.87% | 6.68% | 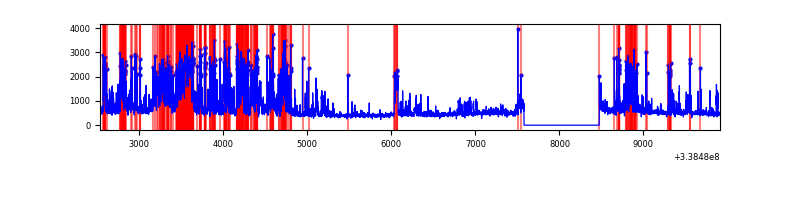 |
Top three noisy pixels from each quadrant. If the there are fewer than three noisy pixels in the level2.evt file, extra rows are filled as -1
| Pixel properties | Quadrant properties | ||||||
|---|---|---|---|---|---|---|---|
| Quadrant | DetID | PixID | Counts | Sigma | Mean | Median | Sigma |
| A | 14 | 235 | 614802 | 3961.3 | 769 | 753 | 155.0 |
| A | 12 | 16 | 41971 | 265.9 | 769 | 753 | 155.0 |
| A | 8 | 192 | 16632 | 102.44 | 769 | 753 | 155.0 |
| B | 0 | 189 | 3687864 | 26907.05 | 731 | 711 | 137.0 |
| B | 5 | 172 | 222023 | 1615.03 | 731 | 711 | 137.0 |
| B | 0 | 230 | 41241 | 295.77 | 731 | 711 | 137.0 |
| C | 2 | 16 | 219350 | 1251.81 | 749 | 755 | 174.6 |
| C | 14 | 238 | 120103 | 683.46 | 749 | 755 | 174.6 |
| C | 15 | 208 | 54077 | 305.35 | 749 | 755 | 174.6 |
| D | 1 | 52 | 892570 | 5059.79 | 739 | 717 | 176.3 |
| D | 12 | 233 | 679800 | 3852.67 | 739 | 717 | 176.3 |
| D | 2 | 250 | 646512 | 3663.82 | 739 | 717 | 176.3 |
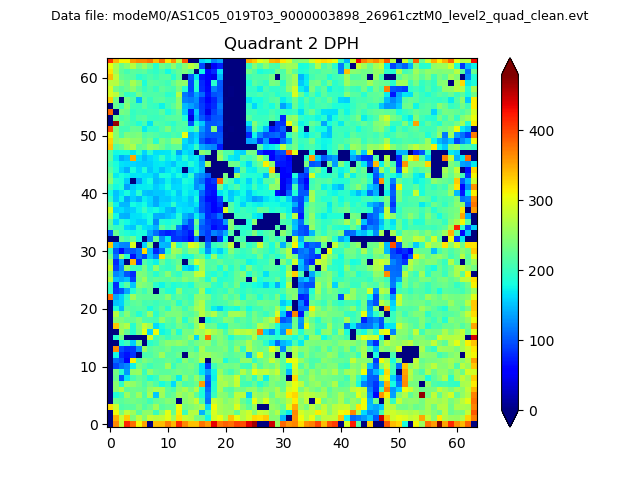
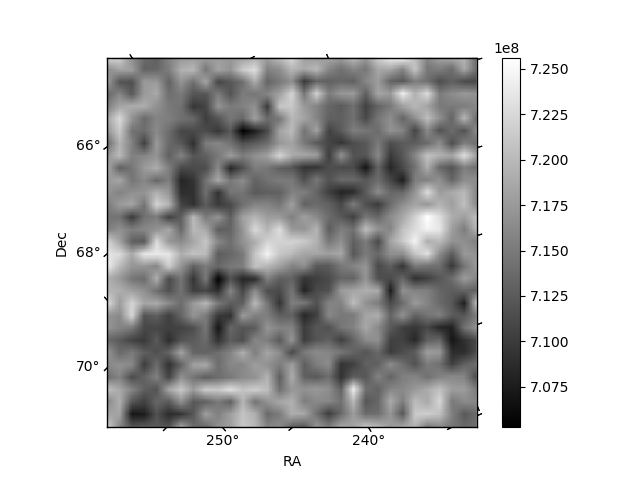
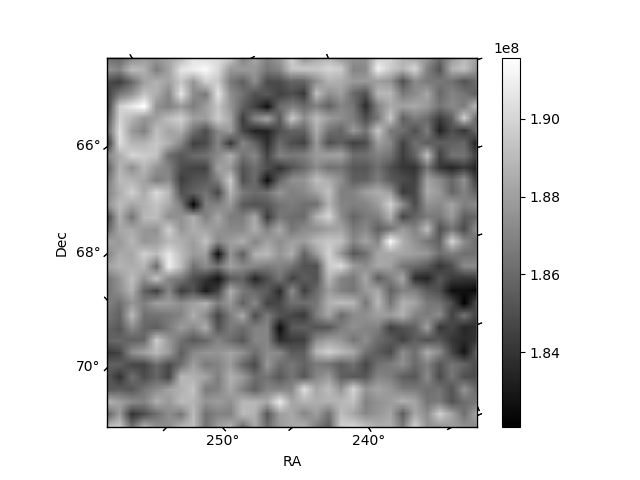
Histogram calculated using DETX and DETY for each event in the final _common_clean file
| Quadrant A | 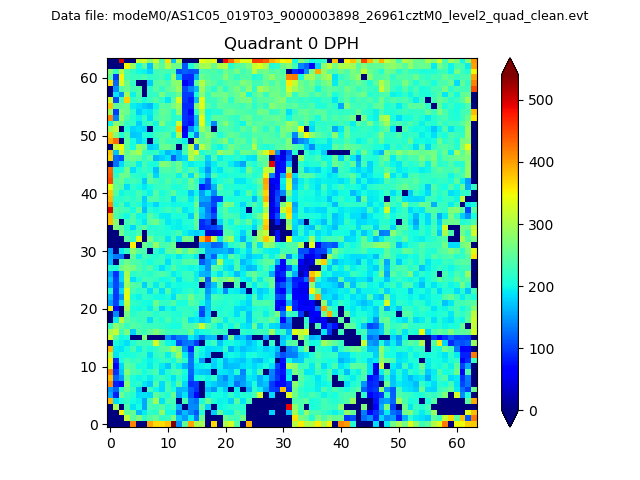 |
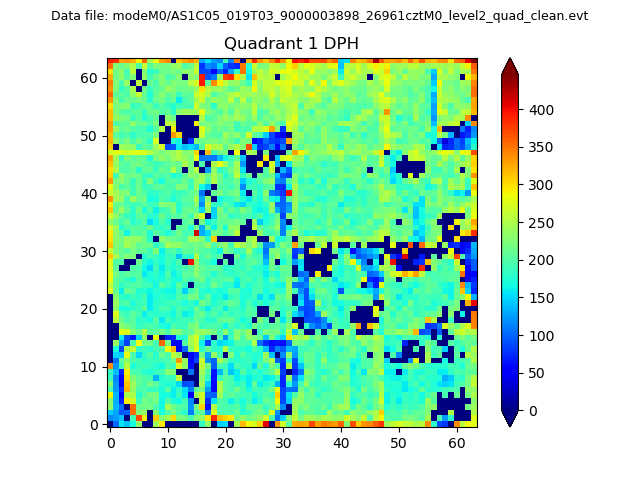 |
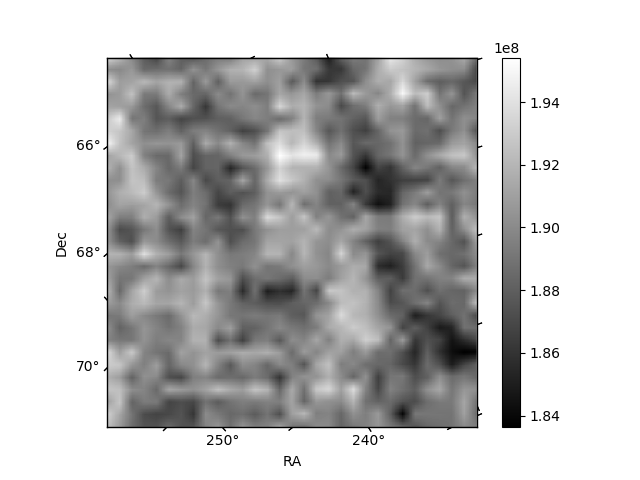
Quadrant B |
|---|---|---|---|
| Quadrant D | 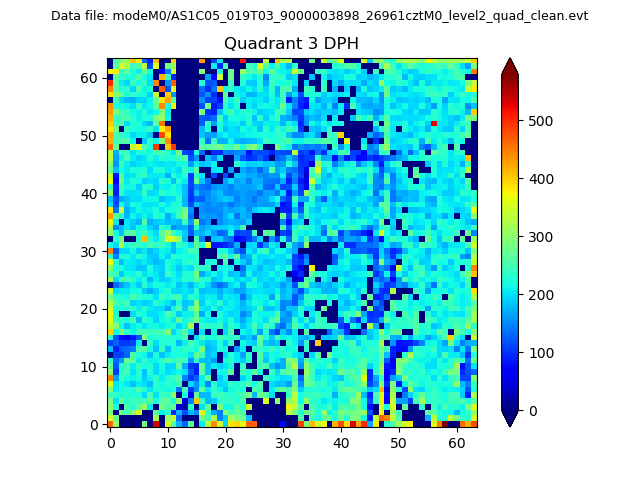 |
 |
Quadrant C |
| Plot type | Count rate plots | Images |
|---|---|---|
| Comparison with Poisson distribution Blue bars denote a histogram of data divided into 1 sec bins. Red curve is a Poisson curve with rate = median count rate of data. |
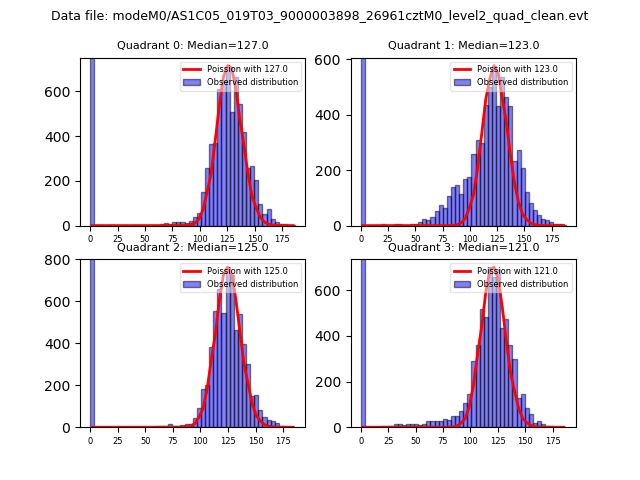 |
 |
| Quadrant-wise count rates Data is divided into 100 sec bins |
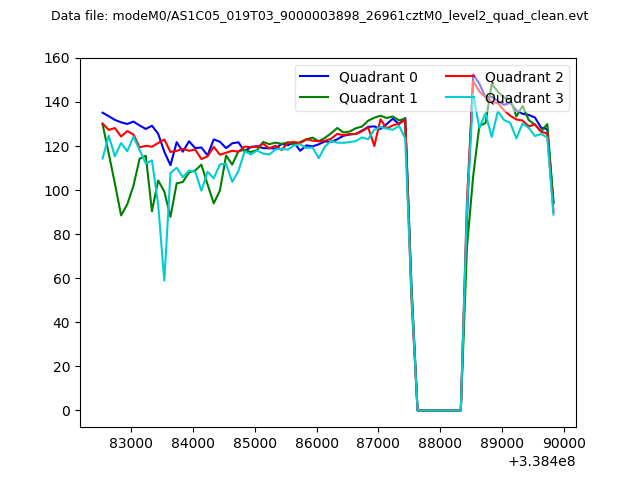 |
|
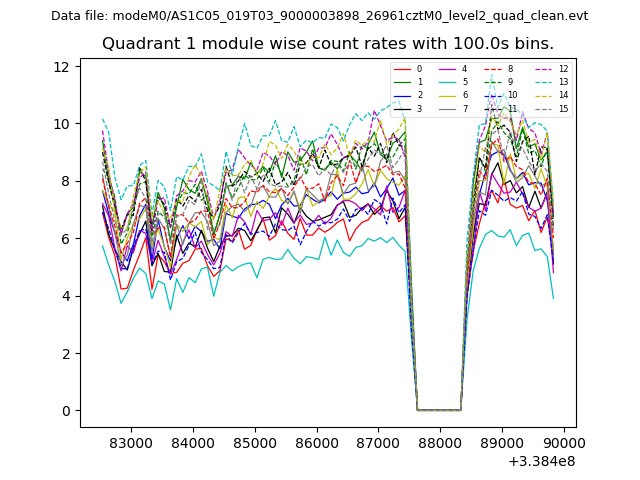
| Module-wise count rates for Quadrant A Data is divided into 100 sec bins |
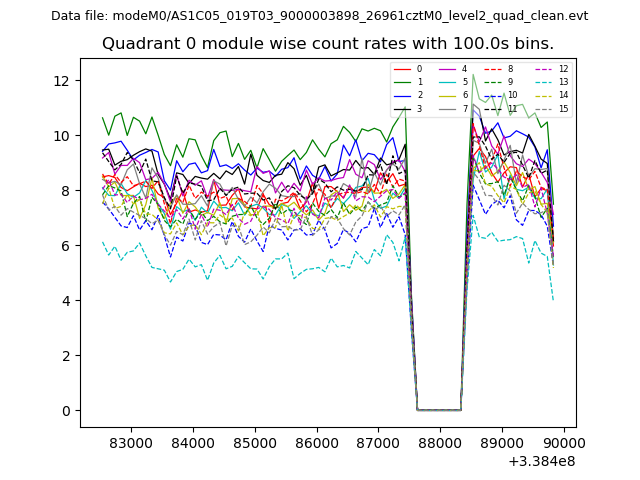 |
 |
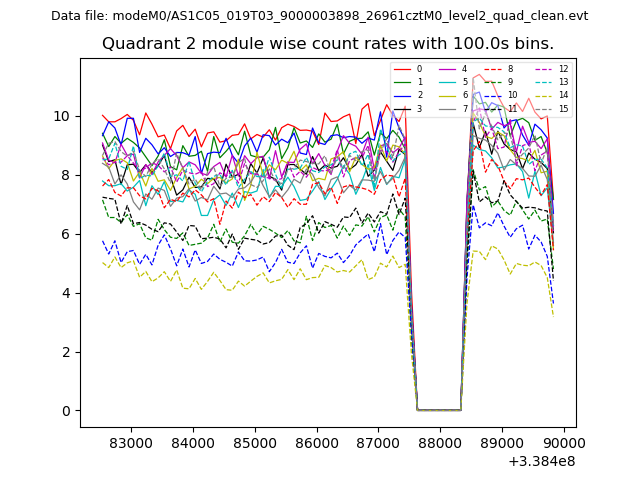
| Module-wise count rates for Quadrant B Data is divided into 100 sec bins |
 |
 |
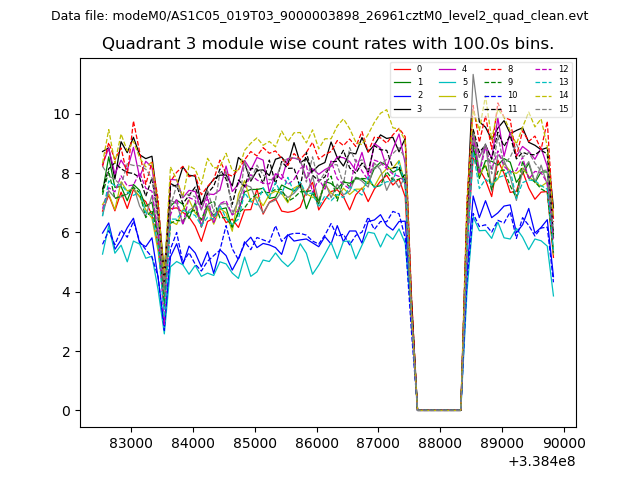
| Module-wise count rates for Quadrant C Data is divided into 100 sec bins |
 |
 |
| Module-wise count rates for Quadrant D Data is divided into 100 sec bins |
 |
 |
| Parameter | Plot |
|---|---|
| CZT HV Monitor | 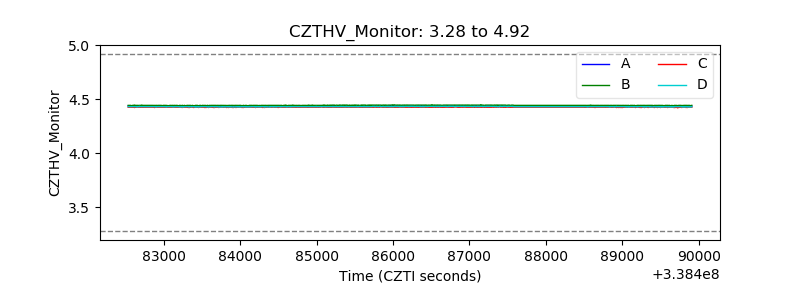 |
| D_VDD | 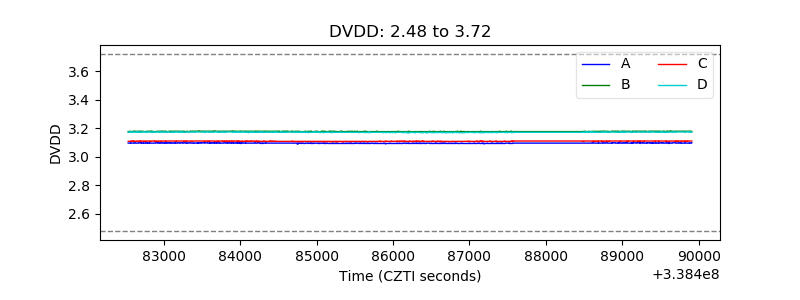 |
| Temperature 1 | 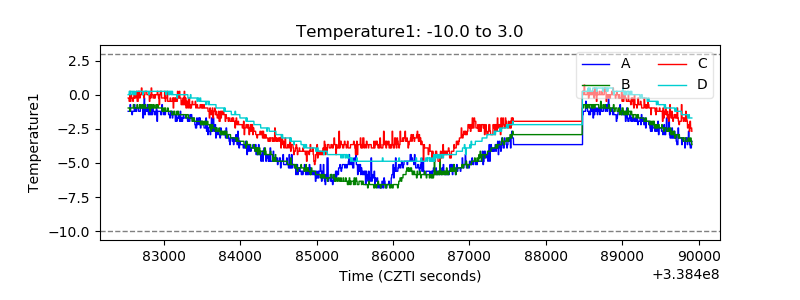 |
| Veto HV Monitor |  |
| Veto LLD | 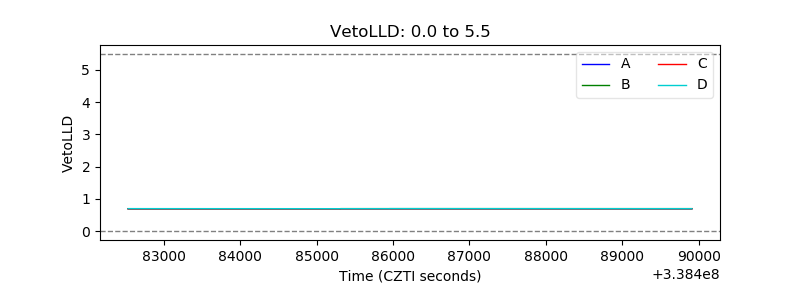 |
| Alpha Counter | 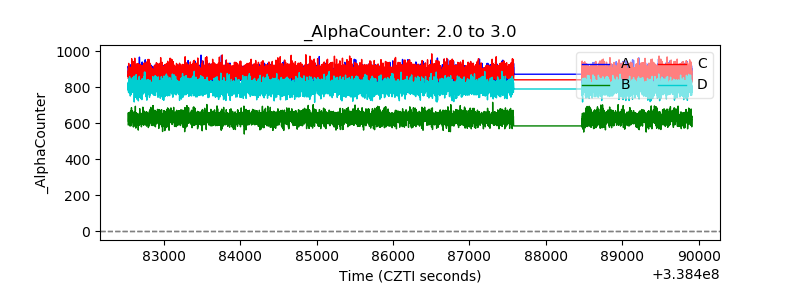 |
| _CPM_Rate | 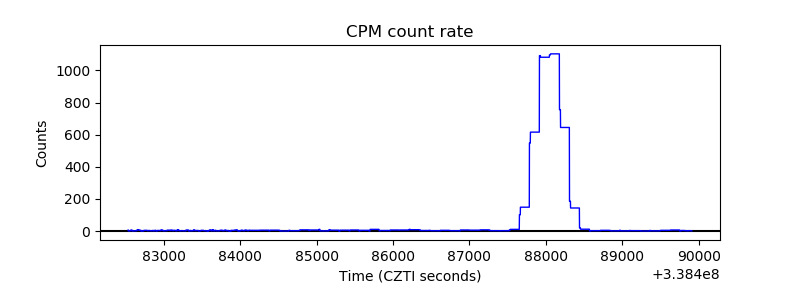 |
| CZT Counter | 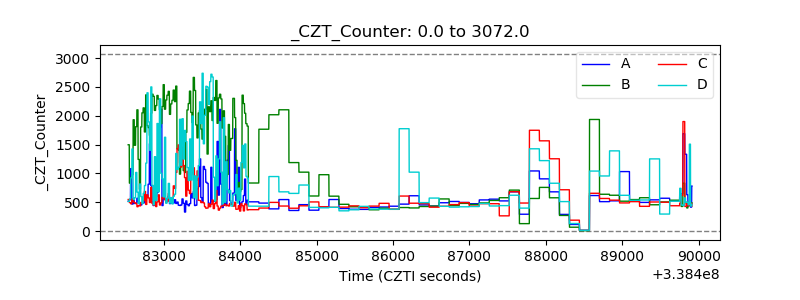 |
| +2.5 Volts monitor |  |
| +5 Volts monitor |  |
| _ROLL_ROT | 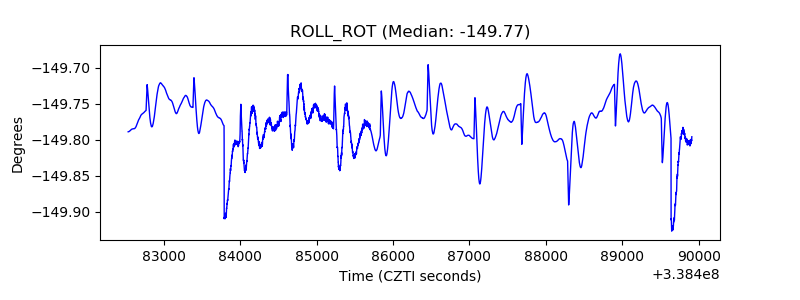 |
| _Roll_DEC |  |
| _Roll_RA | 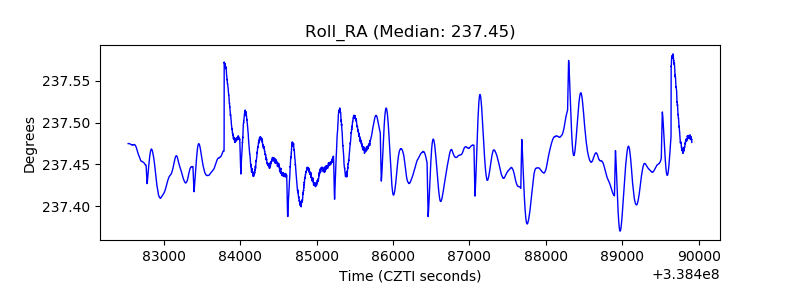 |
| Veto Counter | 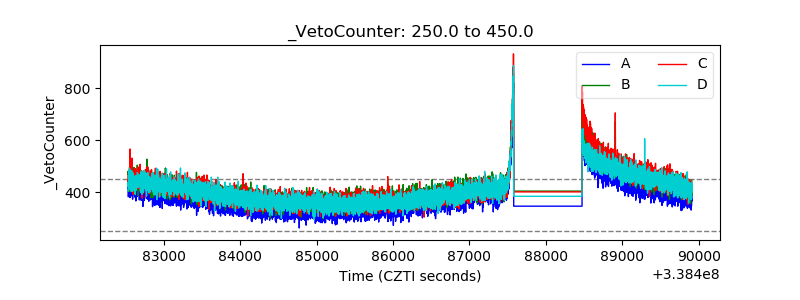 |