| Param | Original file | Final file |
|---|---|---|
| Filename | modeM0/AS1C05_019T03_9000003898_26962cztM0_level2.evt | modeM0/AS1C05_019T03_9000003898_26962cztM0_level2_quad_clean.evt |
| Size (bytes) | 570,695,040 | 117,996,480 |
| Size | 544.3 MB | 112.5 MB |
| Events in quadrant A | 6,315,605 | 727,196 |
| Events in quadrant B | 3,525,289 | 824,356 |
| Events in quadrant C | 3,040,323 | 809,404 |
| Events in quadrant D | 3,982,994 | 780,520 |
| Mode M0 | |||
|---|---|---|---|
| Quadrant | BADHDUFLAG | Total packets | Discarded packets |
| A | 0 | 22902 | 0 |
| B | 0 | 14485 | 0 |
| C | 0 | 13040 | 0 |
| D | 0 | 15994 | 0 |
| Mode M9 | |||
|---|---|---|---|
| Quadrant | BADHDUFLAG | Total packets | Discarded packets |
| A | 0 | 10 | 0 |
| B | 0 | 10 | 0 |
| C | 0 | 10 | 0 |
| D | 0 | 10 | 0 |
| Quadrant | Total seconds | Saturated seconds | Saturation percentage |
|---|---|---|---|
| A | 6182 | 1279 | 20.689097% |
| B | 6182 | 188 | 3.041087% |
| C | 6182 | 86 | 1.391136% |
| D | 6182 | 213 | 3.445487% |
Noise dominated data is calculated using 1-second bins in cleaned event files. If a bin has >2000 counts, and if more than 50% of those come from <1% of pixels, then it is considered to be noise-dominated and hence unusable.
| Quadrant | # 1 sec bins | Bins with >0 counts | Bins with >2000 counts | High rate bins dominated by noise | Noise dominated (total time) | Noise dominated (detector-on time) | Marked lightcurve |
|---|---|---|---|---|---|---|---|
| A | 7227 | 6182 | 877 | 877 | 12.14% | 14.19% | 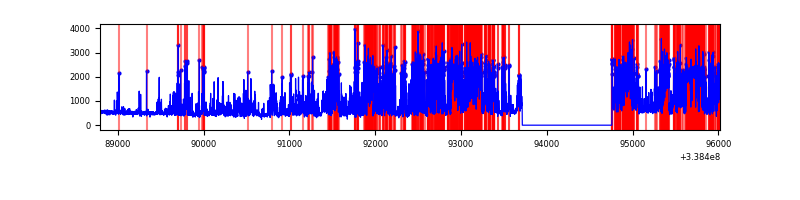 |
| B | 7227 | 6182 | 128 | 128 | 1.77% | 2.07% | 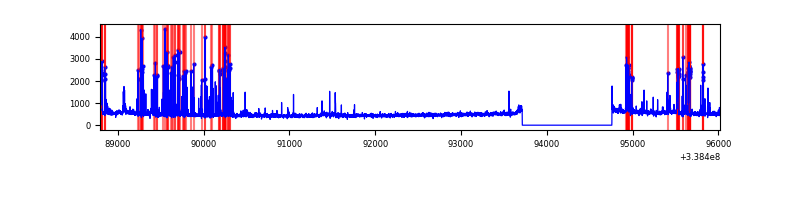 |
| C | 7227 | 6182 | 3 | 3 | 0.04% | 0.05% | 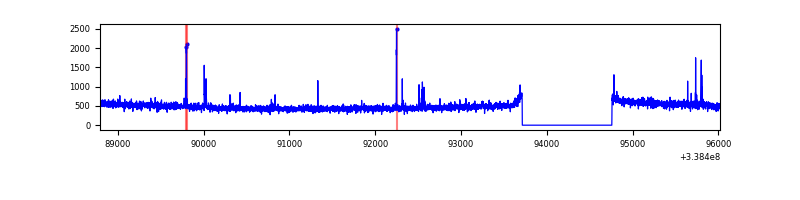 |
| D | 7227 | 6182 | 162 | 162 | 2.24% | 2.62% | 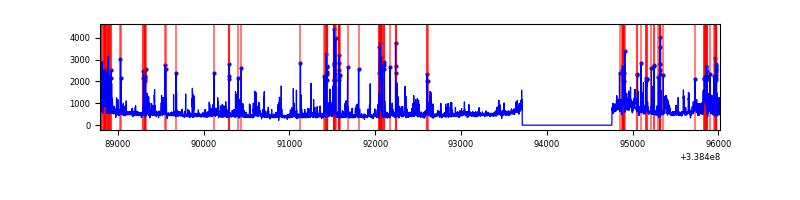 |
Top three noisy pixels from each quadrant. If the there are fewer than three noisy pixels in the level2.evt file, extra rows are filled as -1
| Pixel properties | Quadrant properties | ||||||
|---|---|---|---|---|---|---|---|
| Quadrant | DetID | PixID | Counts | Sigma | Mean | Median | Sigma |
| A | 14 | 235 | 3645219 | 27091.66 | 676 | 662 | 134.5 |
| A | 6 | 16 | 26430 | 191.55 | 676 | 662 | 134.5 |
| A | 8 | 192 | 17612 | 126.0 | 676 | 662 | 134.5 |
| B | 5 | 172 | 303902 | 2208.73 | 740 | 723 | 137.3 |
| B | 0 | 189 | 193627 | 1405.35 | 740 | 723 | 137.3 |
| B | 3 | 64 | 33004 | 235.17 | 740 | 723 | 137.3 |
| C | 14 | 238 | 117367 | 689.27 | 729 | 734 | 169.2 |
| C | 2 | 16 | 56939 | 332.16 | 729 | 734 | 169.2 |
| C | 15 | 208 | 25429 | 145.94 | 729 | 734 | 169.2 |
| D | 1 | 52 | 941934 | 5443.2 | 725 | 705 | 172.9 |
| D | 2 | 250 | 235233 | 1356.29 | 725 | 705 | 172.9 |
| D | 2 | 234 | 34163 | 193.49 | 725 | 705 | 172.9 |
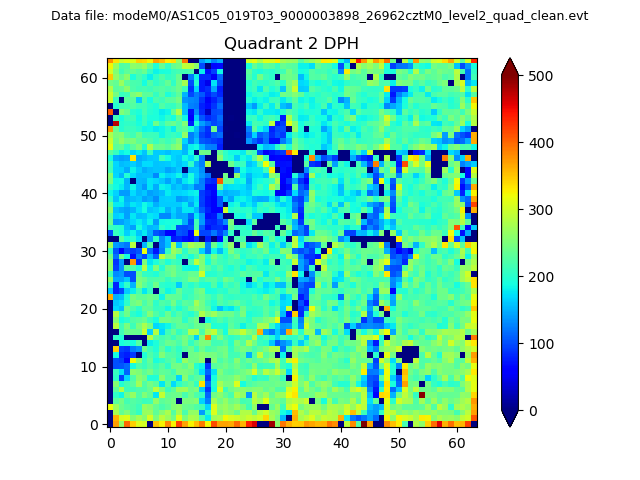
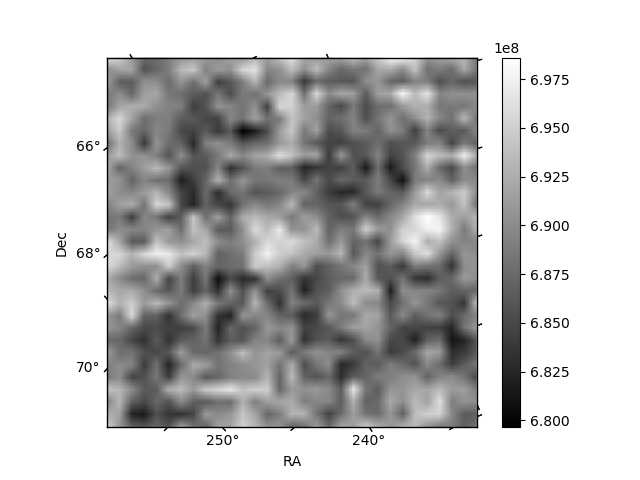
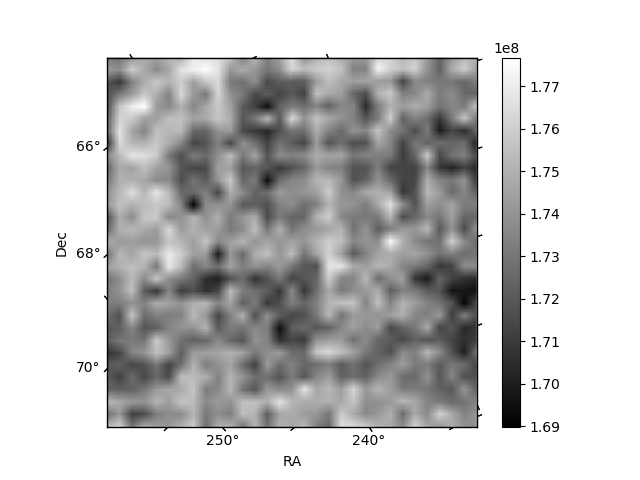
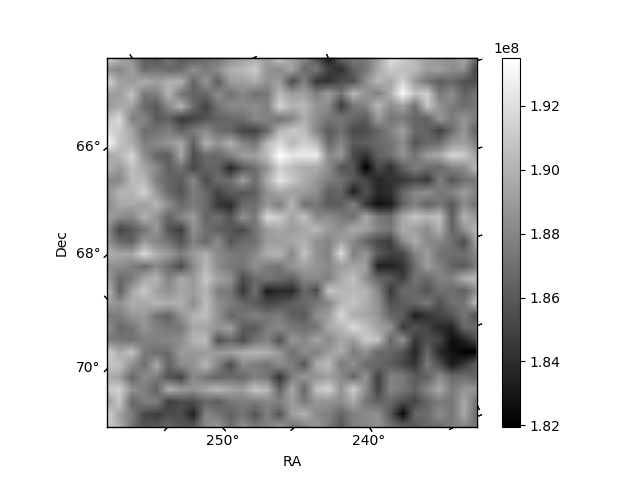
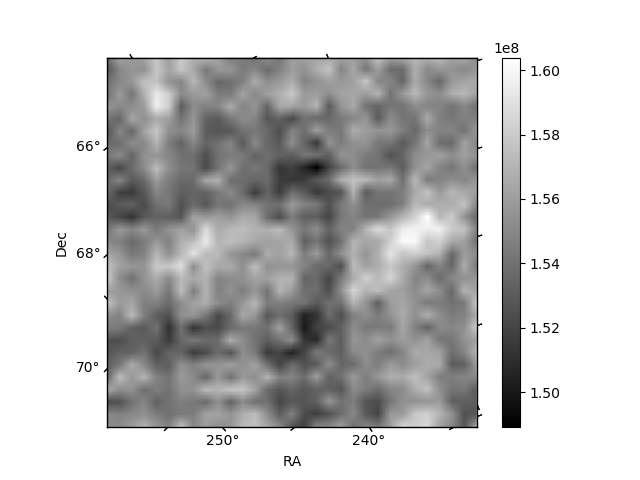
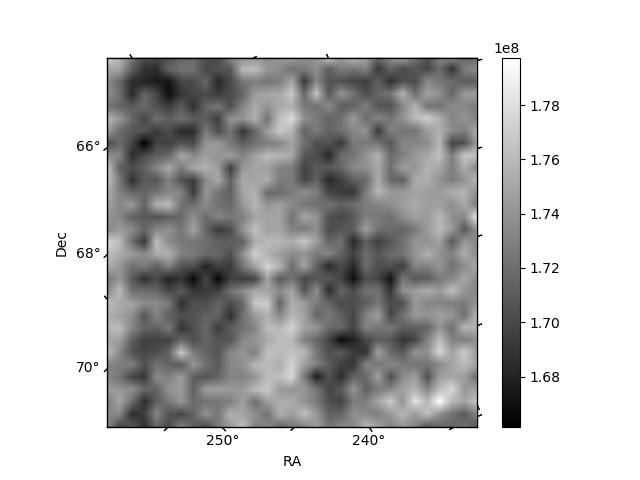
Histogram calculated using DETX and DETY for each event in the final _common_clean file
| Quadrant A | 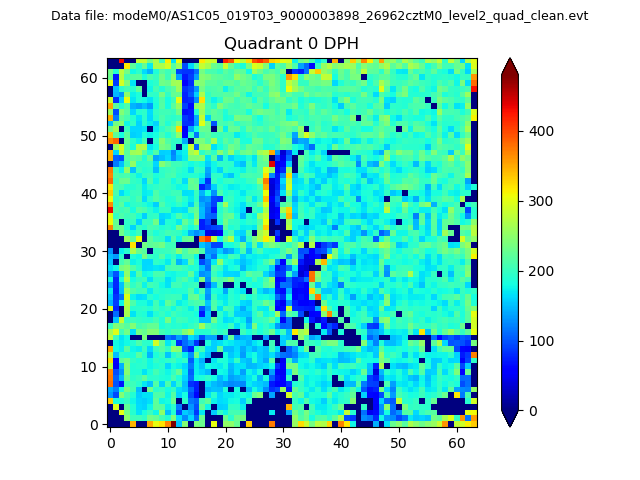 |
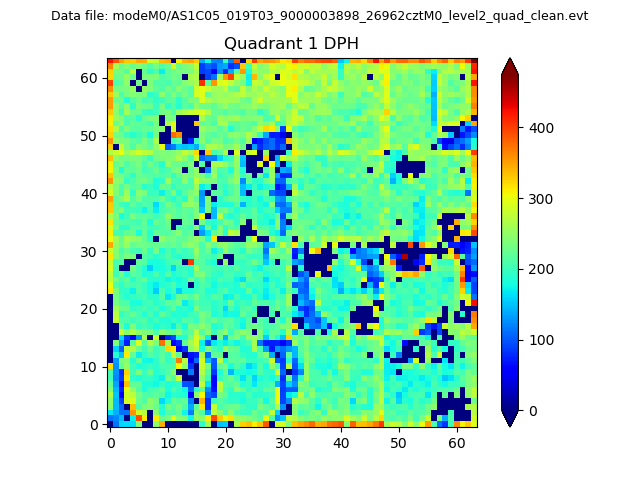 |
Quadrant B |
|---|---|---|---|
| Quadrant D | 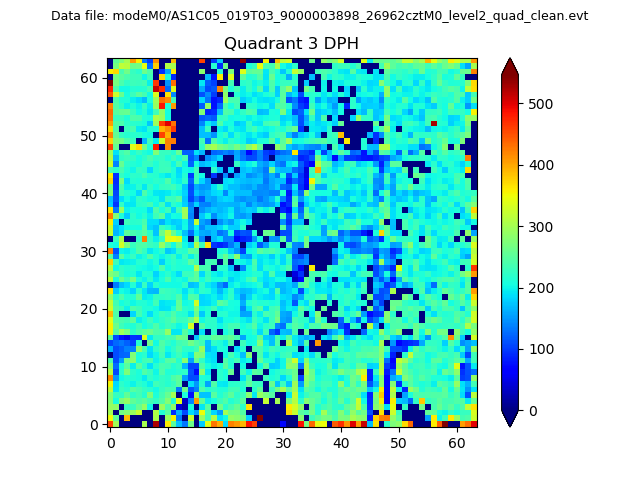 |
 |
Quadrant C |
| Plot type | Count rate plots | Images |
|---|---|---|
| Comparison with Poisson distribution Blue bars denote a histogram of data divided into 1 sec bins. Red curve is a Poisson curve with rate = median count rate of data. |
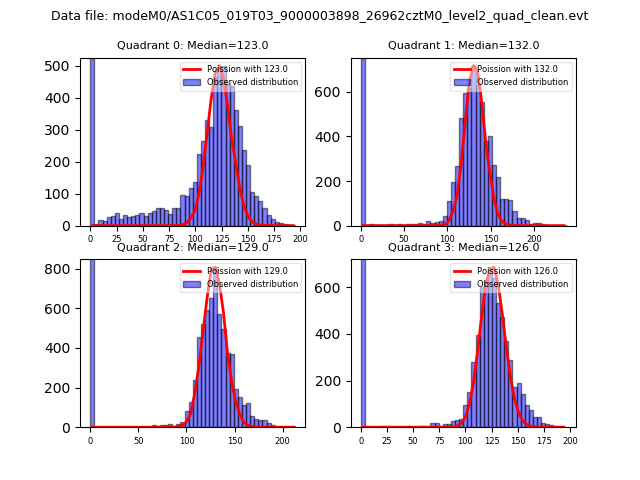 |
 |
| Quadrant-wise count rates Data is divided into 100 sec bins |
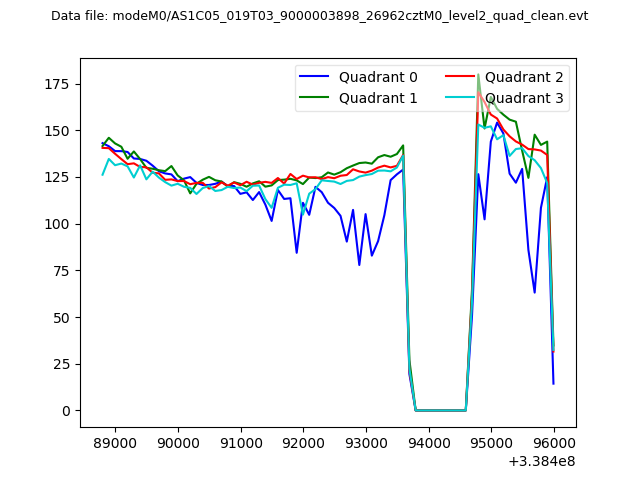 |
|
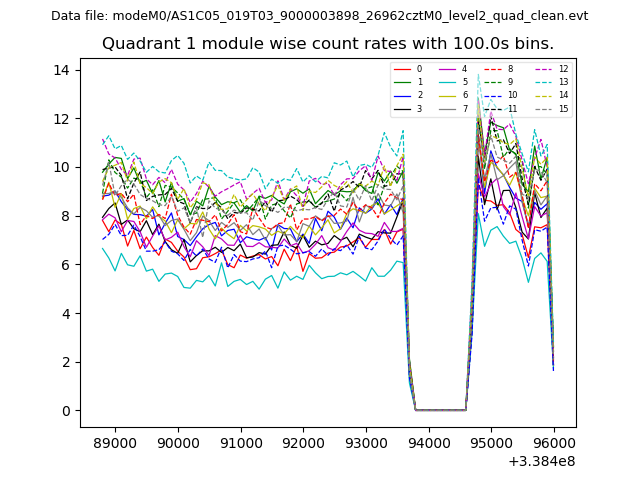
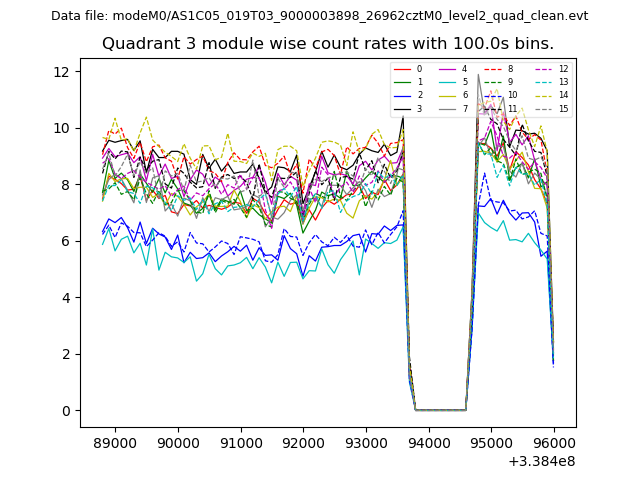
| Module-wise count rates for Quadrant A Data is divided into 100 sec bins |
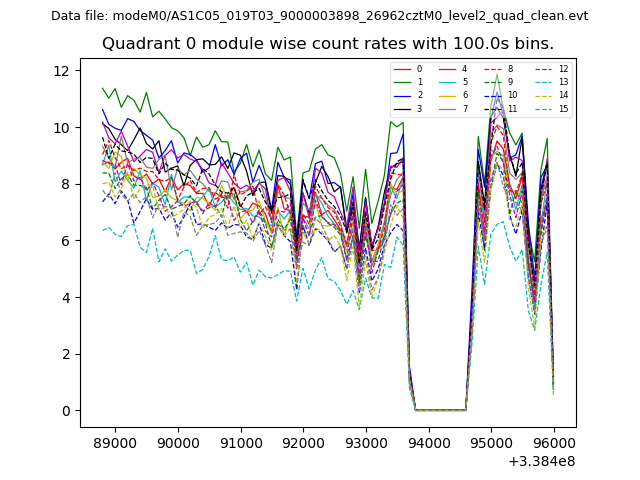 |
 |
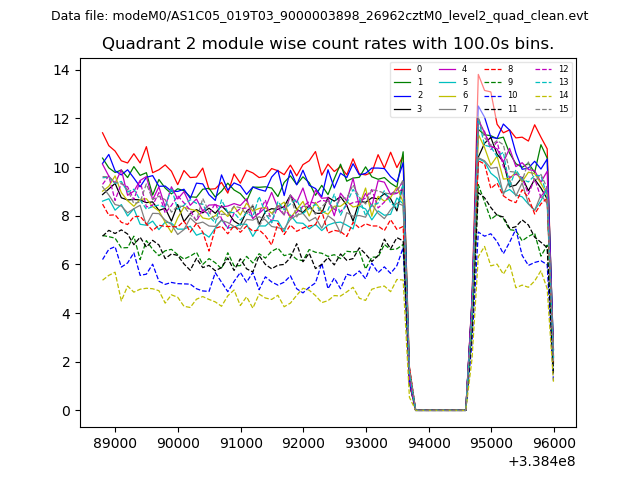
| Module-wise count rates for Quadrant B Data is divided into 100 sec bins |
 |
 |
| Module-wise count rates for Quadrant C Data is divided into 100 sec bins |
 |
 |
| Module-wise count rates for Quadrant D Data is divided into 100 sec bins |
 |
 |
| Parameter | Plot |
|---|---|
| CZT HV Monitor |  |
| D_VDD | 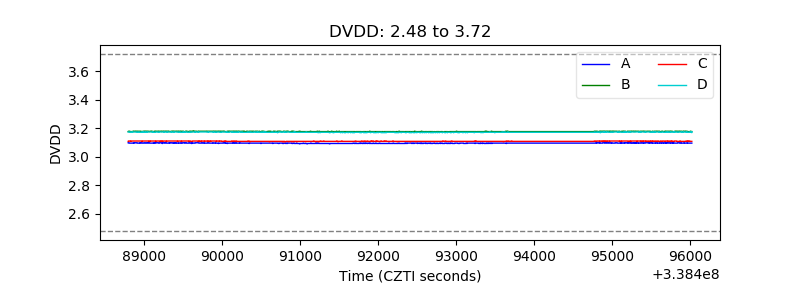 |
| Temperature 1 |  |
| Veto HV Monitor | 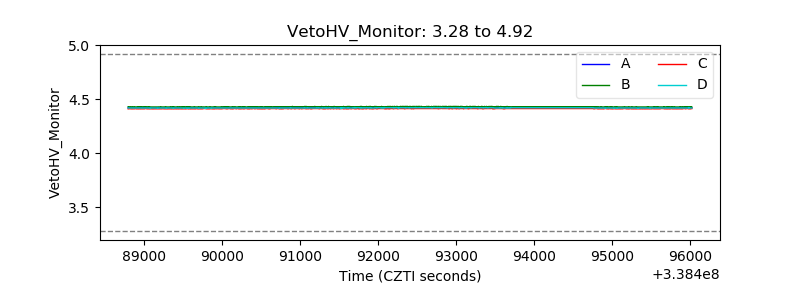 |
| Veto LLD | 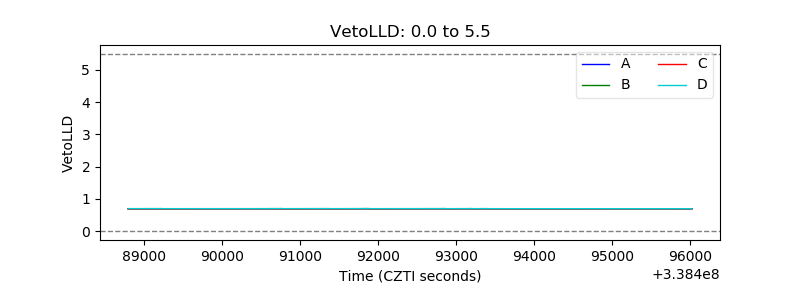 |
| Alpha Counter | 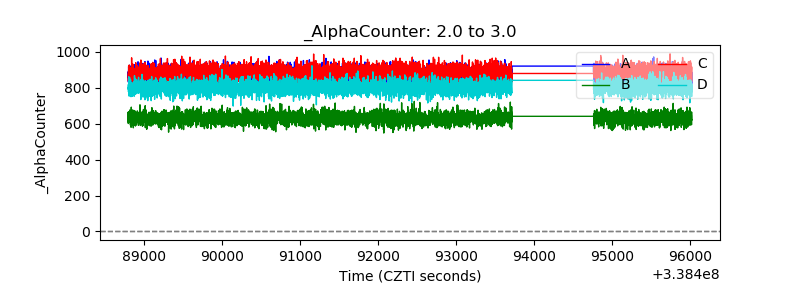 |
| _CPM_Rate | 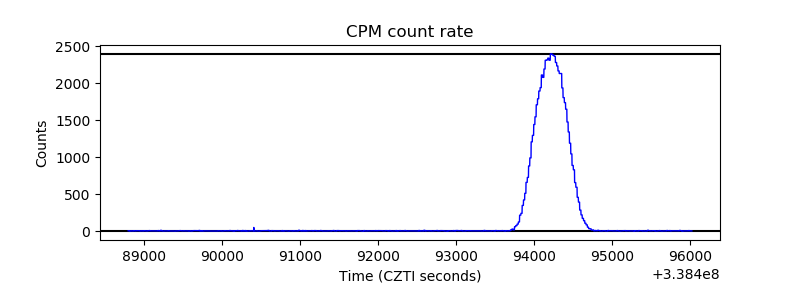 |
| CZT Counter | 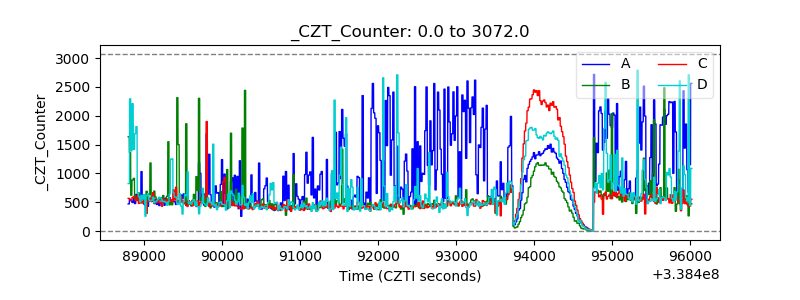 |
| +2.5 Volts monitor |  |
| +5 Volts monitor |  |
| _ROLL_ROT |  |
| _Roll_DEC |  |
| _Roll_RA | 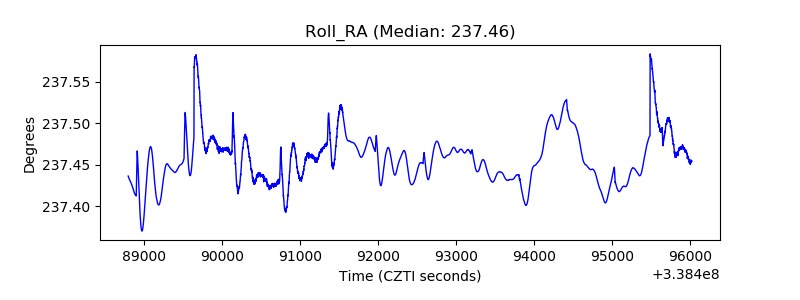 |
| Veto Counter |  |