| Param | Original file | Final file |
|---|---|---|
| Filename | modeM0/AS1C05_019T03_9000003898_26964cztM0_level2.evt | modeM0/AS1C05_019T03_9000003898_26964cztM0_level2_quad_clean.evt |
| Size (bytes) | 777,703,680 | 119,914,560 |
| Size | 741.7 MB | 114.4 MB |
| Events in quadrant A | 11,729,396 | 533,230 |
| Events in quadrant B | 3,831,244 | 910,735 |
| Events in quadrant C | 3,224,340 | 890,202 |
| Events in quadrant D | 4,335,436 | 849,938 |
| Mode M0 | |||
|---|---|---|---|
| Quadrant | BADHDUFLAG | Total packets | Discarded packets |
| A | 0 | 39261 | 0 |
| B | 0 | 15604 | 0 |
| C | 0 | 13802 | 0 |
| D | 0 | 17331 | 0 |
| Mode M9 | |||
|---|---|---|---|
| Quadrant | BADHDUFLAG | Total packets | Discarded packets |
| A | 0 | 14 | 0 |
| B | 0 | 15 | 0 |
| C | 0 | 15 | 0 |
| D | 0 | 15 | 0 |
| Quadrant | Total seconds | Saturated seconds | Saturation percentage |
|---|---|---|---|
| A | 6388 | 4232 | 66.249217% |
| B | 6388 | 157 | 2.457733% |
| C | 6388 | 88 | 1.377583% |
| D | 6388 | 202 | 3.162179% |
Noise dominated data is calculated using 1-second bins in cleaned event files. If a bin has >2000 counts, and if more than 50% of those come from <1% of pixels, then it is considered to be noise-dominated and hence unusable.
| Quadrant | # 1 sec bins | Bins with >0 counts | Bins with >2000 counts | High rate bins dominated by noise | Noise dominated (total time) | Noise dominated (detector-on time) | Marked lightcurve |
|---|---|---|---|---|---|---|---|
| A | 7548 | 6388 | 3531 | 3531 | 46.78% | 55.28% | 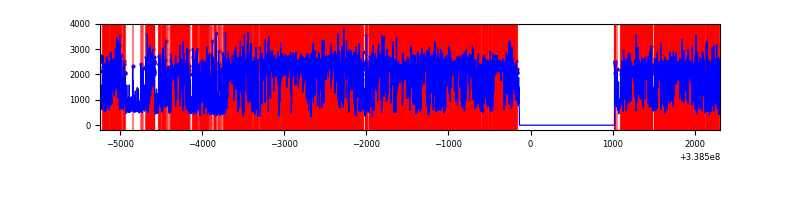 |
| B | 7548 | 6388 | 93 | 93 | 1.23% | 1.46% | 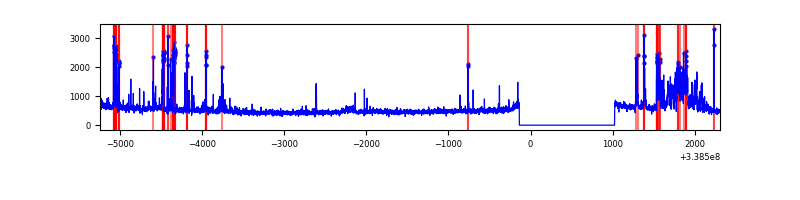 |
| C | 7548 | 6388 | 0 | 0 | 0.00% | 0.00% | 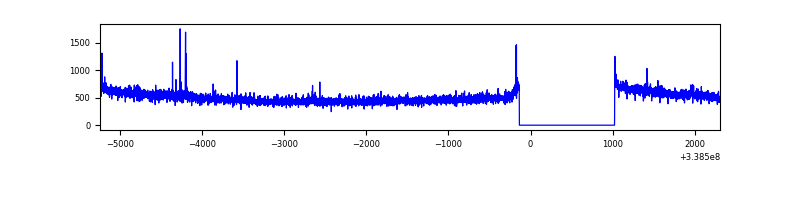 |
| D | 7548 | 6388 | 138 | 138 | 1.83% | 2.16% | 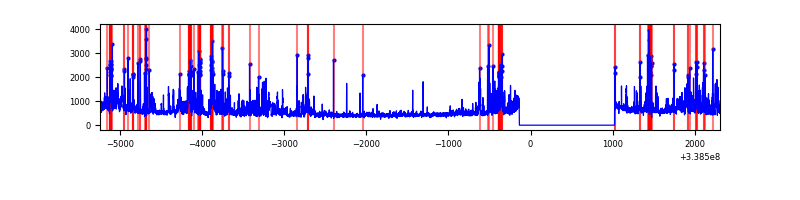 |
Top three noisy pixels from each quadrant. If the there are fewer than three noisy pixels in the level2.evt file, extra rows are filled as -1
| Pixel properties | Quadrant properties | ||||||
|---|---|---|---|---|---|---|---|
| Quadrant | DetID | PixID | Counts | Sigma | Mean | Median | Sigma |
| A | 14 | 235 | 9550764 | 92539.04 | 512 | 501 | 103.2 |
| A | 6 | 16 | 110519 | 1066.04 | 512 | 501 | 103.2 |
| A | 0 | 13 | 64032 | 615.6 | 512 | 501 | 103.2 |
| B | 0 | 189 | 334741 | 2257.29 | 795 | 777 | 147.9 |
| B | 5 | 172 | 261697 | 1763.58 | 795 | 777 | 147.9 |
| B | 3 | 64 | 48126 | 320.04 | 795 | 777 | 147.9 |
| C | 14 | 238 | 126198 | 687.54 | 782 | 787 | 182.4 |
| C | 2 | 16 | 23906 | 126.75 | 782 | 787 | 182.4 |
| C | 15 | 208 | 12093 | 61.98 | 782 | 787 | 182.4 |
| D | 1 | 52 | 1040370 | 5694.02 | 776 | 756 | 182.6 |
| D | 2 | 250 | 291909 | 1594.66 | 776 | 756 | 182.6 |
| D | 12 | 233 | 43483 | 234.02 | 776 | 756 | 182.6 |
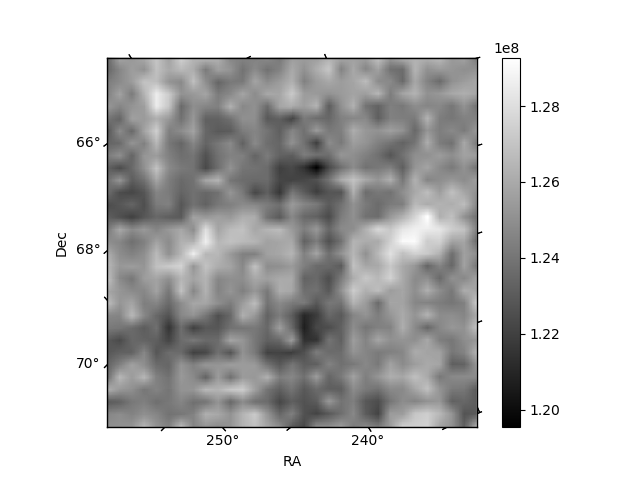
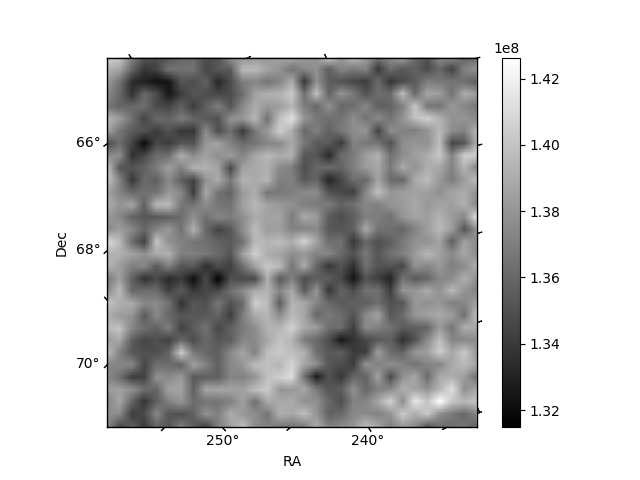
Histogram calculated using DETX and DETY for each event in the final _common_clean file
| Quadrant A | 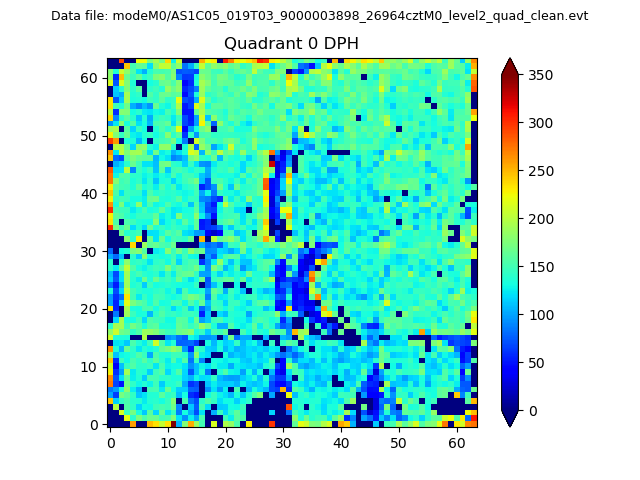 |
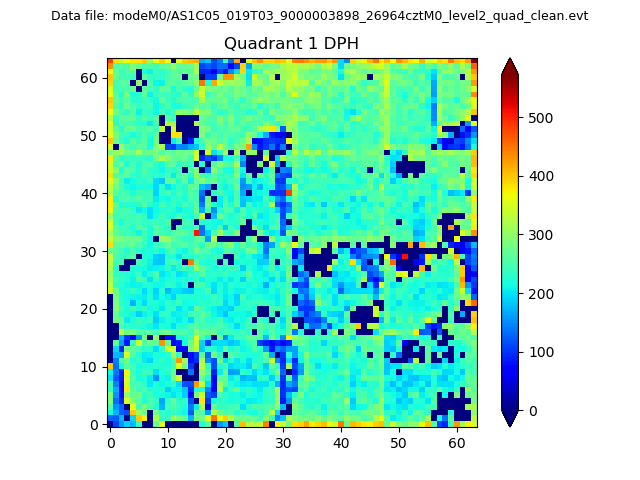 |
Quadrant B |
|---|---|---|---|
| Quadrant D | 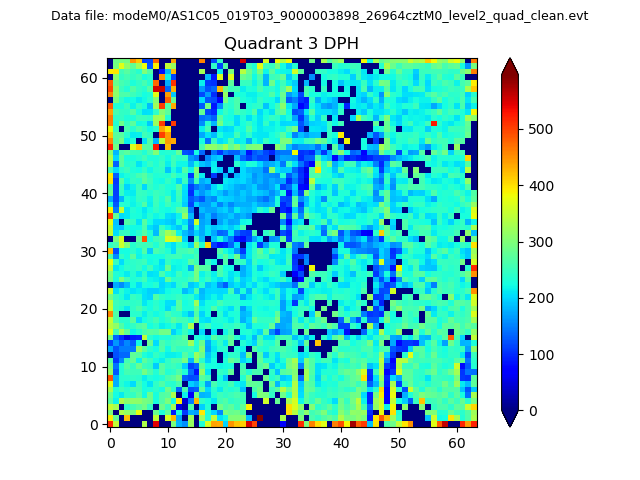 |
 |
Quadrant C |
| Plot type | Count rate plots | Images |
|---|---|---|
| Comparison with Poisson distribution Blue bars denote a histogram of data divided into 1 sec bins. Red curve is a Poisson curve with rate = median count rate of data. |
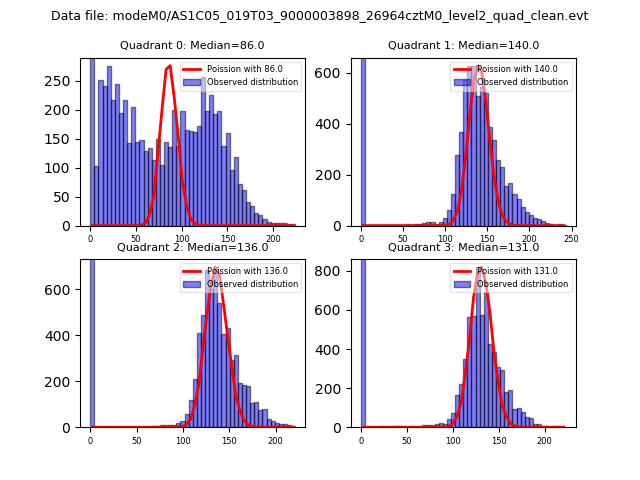 |
 |
| Quadrant-wise count rates Data is divided into 100 sec bins |
 |
|
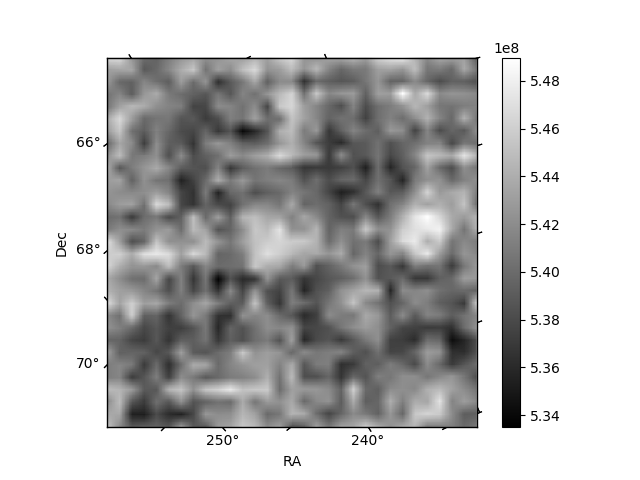
| Module-wise count rates for Quadrant A Data is divided into 100 sec bins |
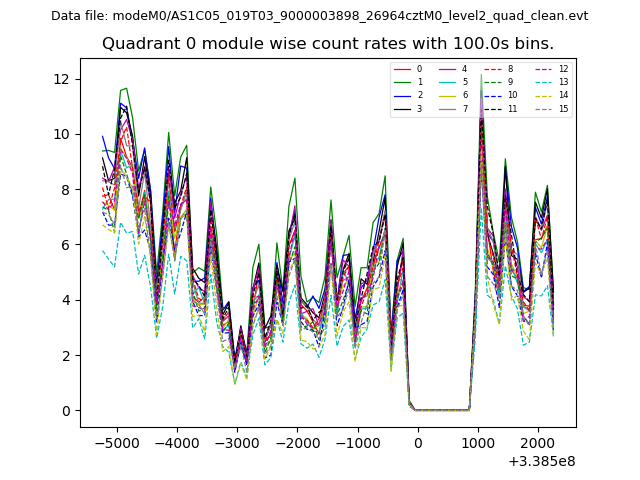 |
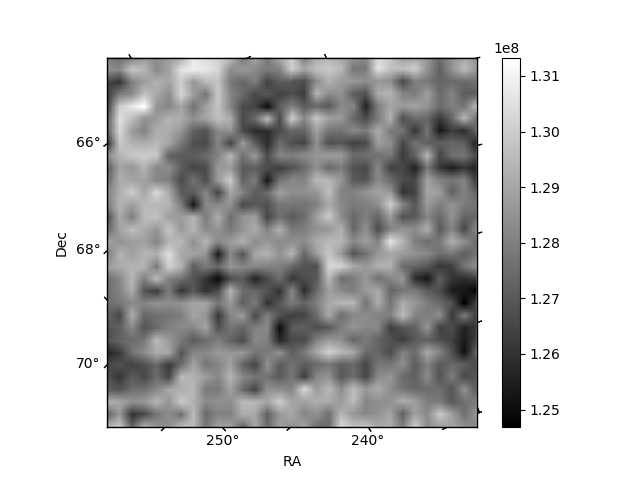 |
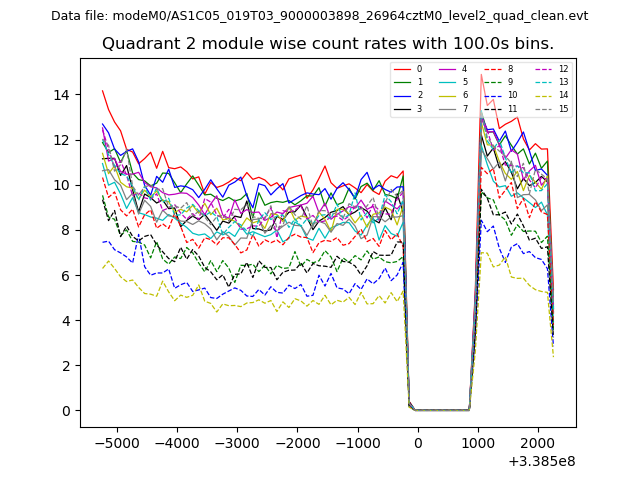
| Module-wise count rates for Quadrant B Data is divided into 100 sec bins |
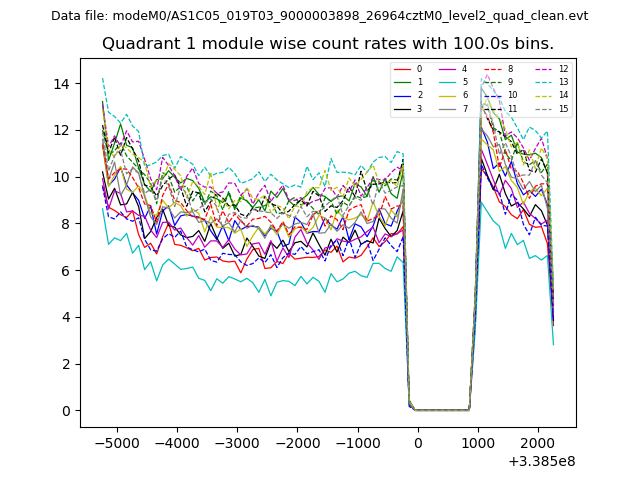 |
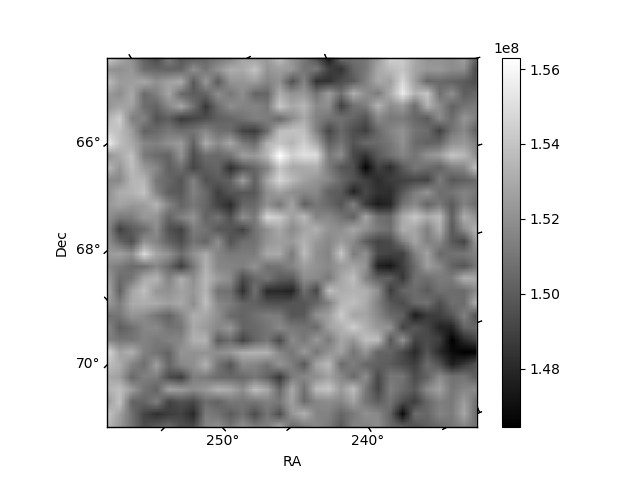 |
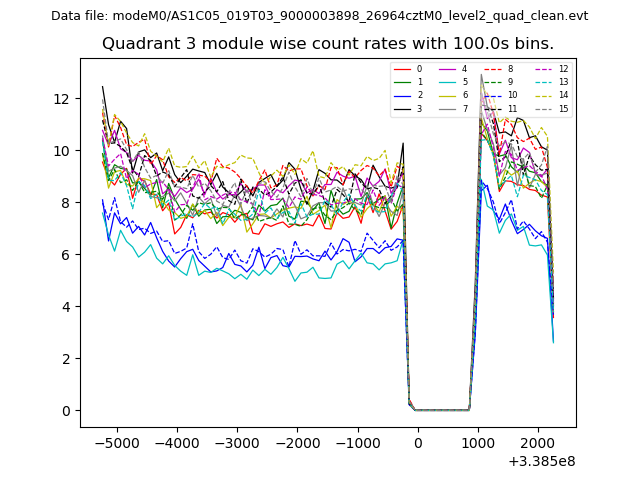
| Module-wise count rates for Quadrant C Data is divided into 100 sec bins |
 |
 |
| Module-wise count rates for Quadrant D Data is divided into 100 sec bins |
 |
 |
| Parameter | Plot |
|---|---|
| CZT HV Monitor | 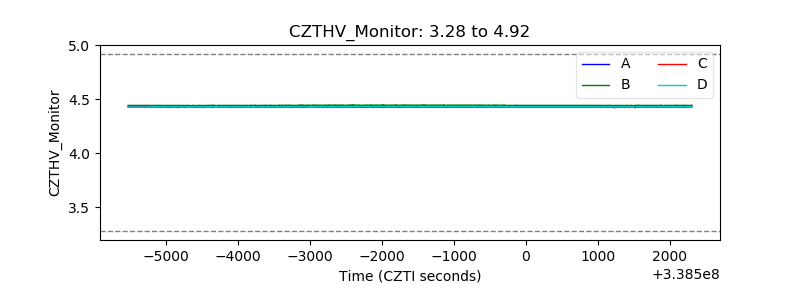 |
| D_VDD | 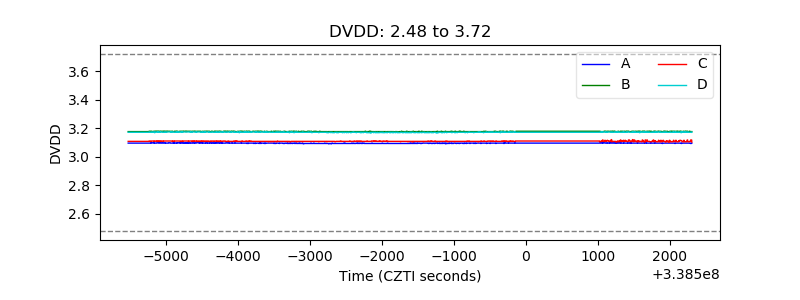 |
| Temperature 1 | 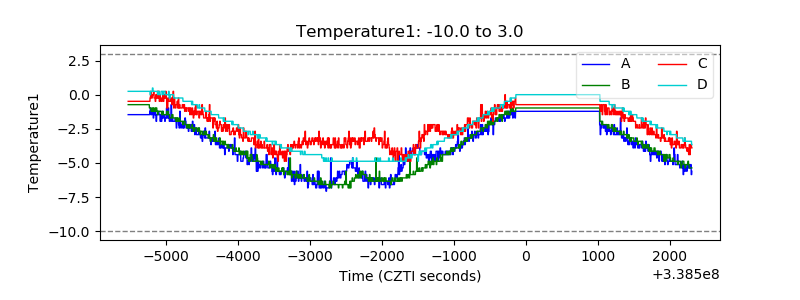 |
| Veto HV Monitor |  |
| Veto LLD | 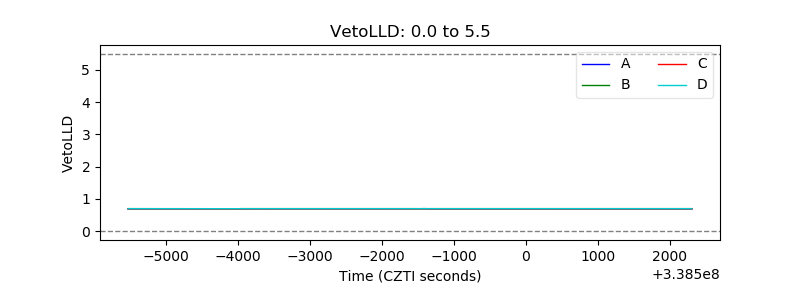 |
| Alpha Counter | 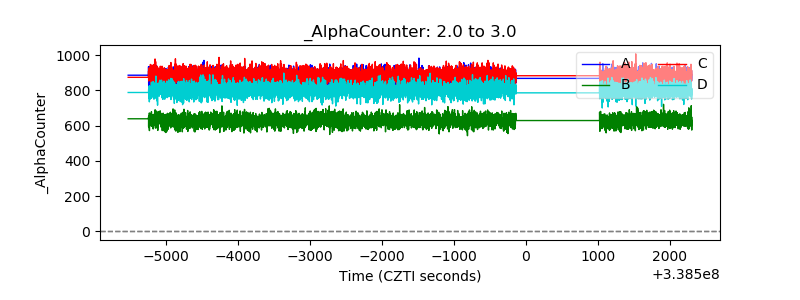 |
| _CPM_Rate |  |
| CZT Counter | 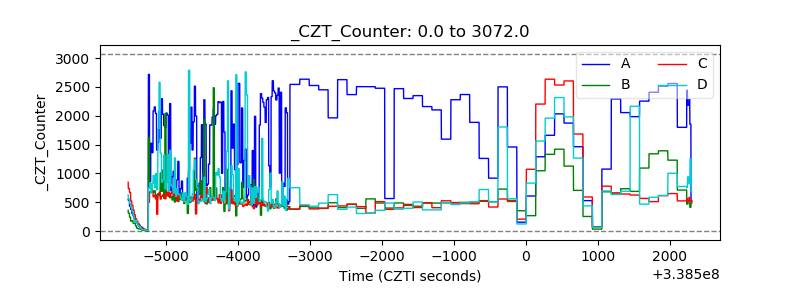 |
| +2.5 Volts monitor | 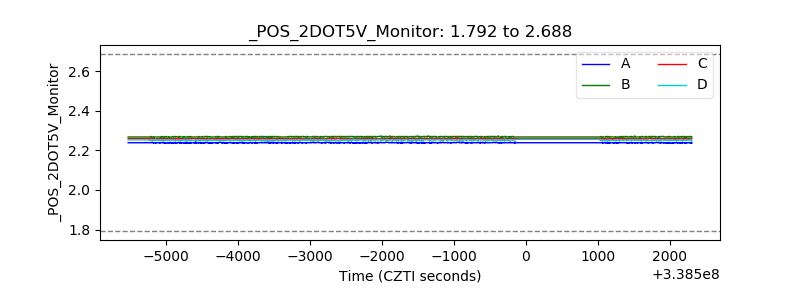 |
| +5 Volts monitor |  |
| _ROLL_ROT | 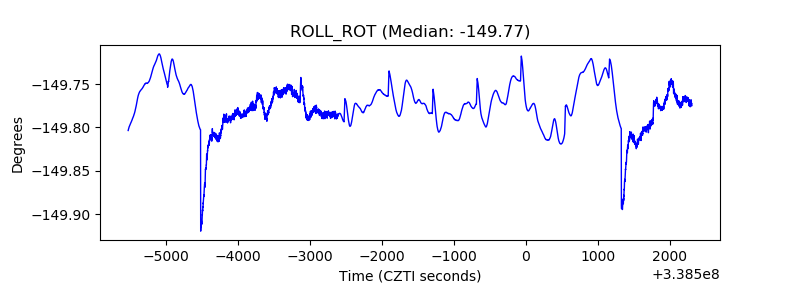 |
| _Roll_DEC | 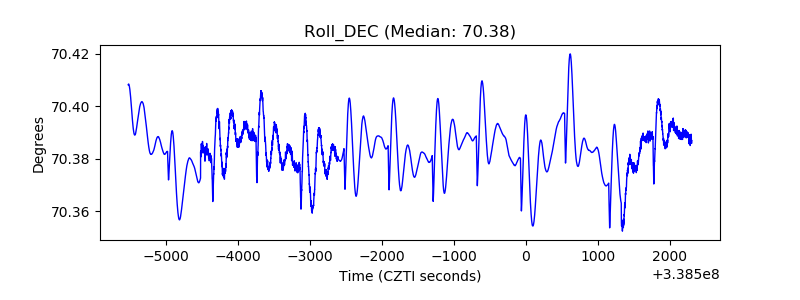 |
| _Roll_RA | 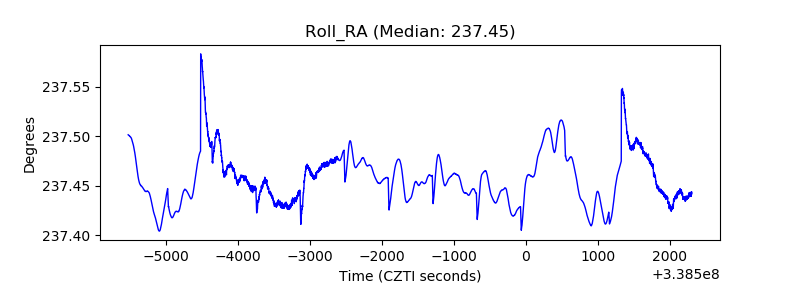 |
| Veto Counter | 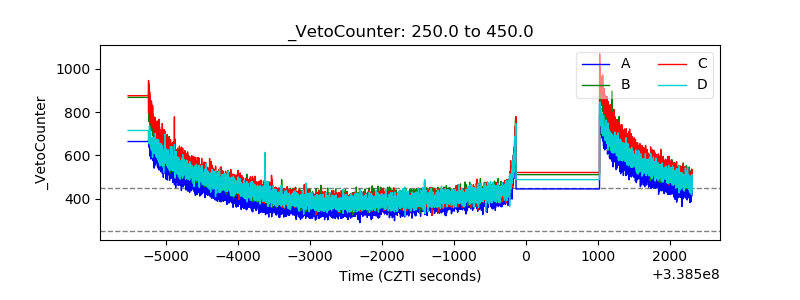 |