| Param | Original file | Final file |
|---|---|---|
| Filename | modeM0/AS1C05_019T03_9000003898_26965cztM0_level2.evt | modeM0/AS1C05_019T03_9000003898_26965cztM0_level2_quad_clean.evt |
| Size (bytes) | 856,056,960 | 119,410,560 |
| Size | 816.4 MB | 113.9 MB |
| Events in quadrant A | 11,445,795 | 512,580 |
| Events in quadrant B | 5,922,684 | 899,008 |
| Events in quadrant C | 3,265,895 | 915,891 |
| Events in quadrant D | 4,867,359 | 848,400 |
| Mode M0 | |||
|---|---|---|---|
| Quadrant | BADHDUFLAG | Total packets | Discarded packets |
| A | 0 | 38333 | 0 |
| B | 0 | 21870 | 0 |
| C | 0 | 13840 | 0 |
| D | 0 | 18761 | 0 |
| Mode M9 | |||
|---|---|---|---|
| Quadrant | BADHDUFLAG | Total packets | Discarded packets |
| A | 0 | 19 | 0 |
| B | 0 | 20 | 0 |
| C | 0 | 20 | 0 |
| D | 0 | 20 | 0 |
| Quadrant | Total seconds | Saturated seconds | Saturation percentage |
|---|---|---|---|
| A | 6277 | 4374 | 69.682970% |
| B | 6277 | 821 | 13.079497% |
| C | 6277 | 71 | 1.131114% |
| D | 6277 | 434 | 6.914131% |
Noise dominated data is calculated using 1-second bins in cleaned event files. If a bin has >2000 counts, and if more than 50% of those come from <1% of pixels, then it is considered to be noise-dominated and hence unusable.
| Quadrant | # 1 sec bins | Bins with >0 counts | Bins with >2000 counts | High rate bins dominated by noise | Noise dominated (total time) | Noise dominated (detector-on time) | Marked lightcurve |
|---|---|---|---|---|---|---|---|
| A | 7561 | 6277 | 3443 | 3443 | 45.54% | 54.85% | 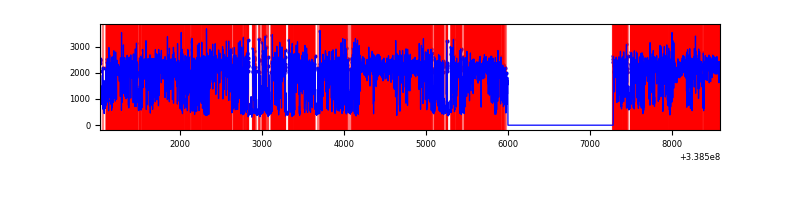 |
| B | 7562 | 6278 | 525 | 525 | 6.94% | 8.36% | 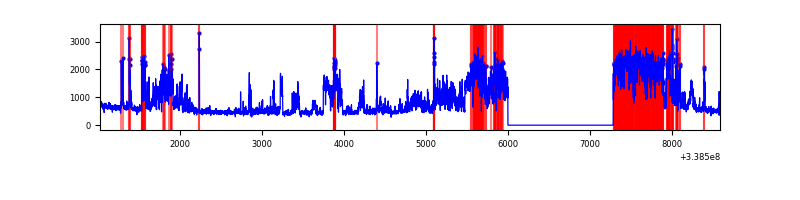 |
| C | 7562 | 6278 | 3 | 3 | 0.04% | 0.05% | 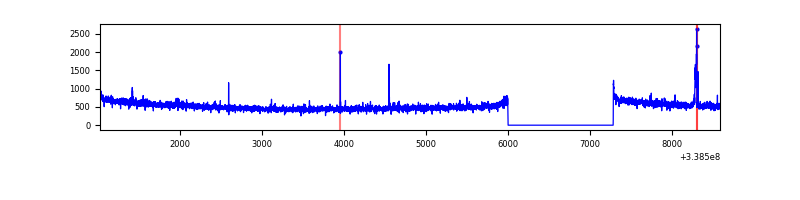 |
| D | 7562 | 6278 | 354 | 354 | 4.68% | 5.64% | 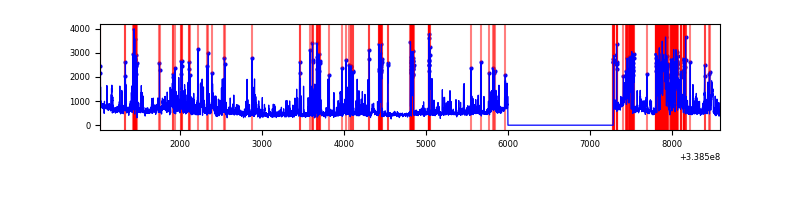 |
Top three noisy pixels from each quadrant. If the there are fewer than three noisy pixels in the level2.evt file, extra rows are filled as -1
| Pixel properties | Quadrant properties | ||||||
|---|---|---|---|---|---|---|---|
| Quadrant | DetID | PixID | Counts | Sigma | Mean | Median | Sigma |
| A | 14 | 235 | 9450947 | 98427.58 | 479 | 470 | 96.0 |
| A | 0 | 13 | 95209 | 986.72 | 479 | 470 | 96.0 |
| A | 6 | 16 | 25682 | 262.59 | 479 | 470 | 96.0 |
| B | 0 | 189 | 2724361 | 19066.1 | 777 | 759 | 142.9 |
| B | 5 | 172 | 91276 | 633.65 | 777 | 759 | 142.9 |
| B | 0 | 244 | 27017 | 183.81 | 777 | 759 | 142.9 |
| C | 14 | 238 | 126384 | 690.09 | 785 | 789 | 182.0 |
| C | 15 | 208 | 47066 | 254.27 | 785 | 789 | 182.0 |
| C | 8 | 128 | 9487 | 47.79 | 785 | 789 | 182.0 |
| D | 1 | 52 | 1206219 | 6740.63 | 758 | 739 | 178.8 |
| D | 2 | 250 | 532247 | 2972.01 | 758 | 739 | 178.8 |
| D | 11 | 176 | 125702 | 698.75 | 758 | 739 | 178.8 |
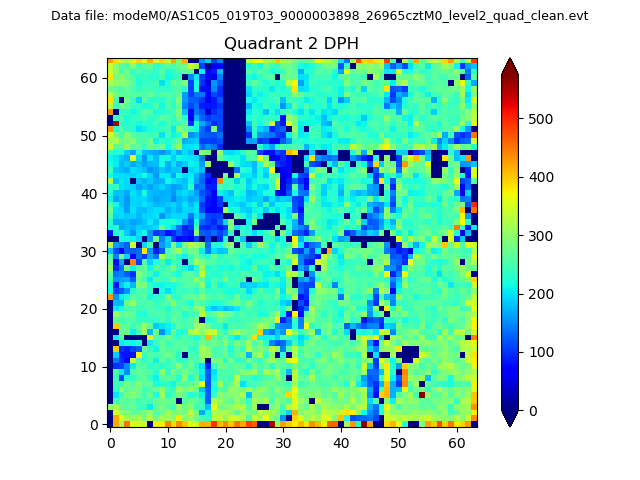
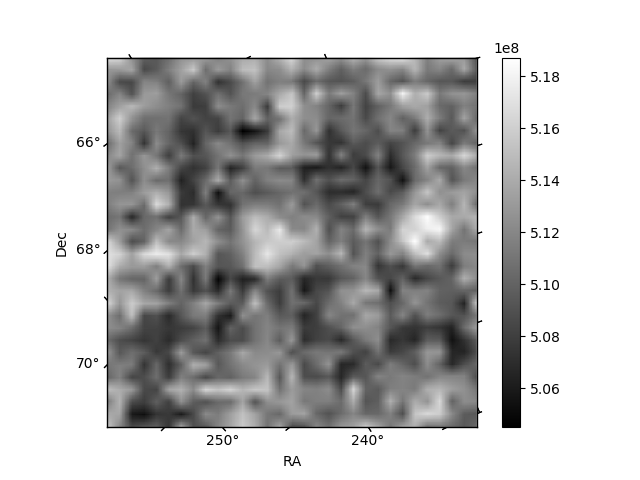
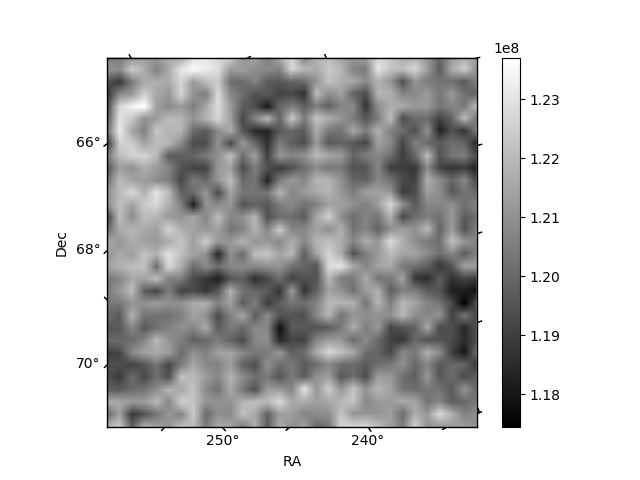
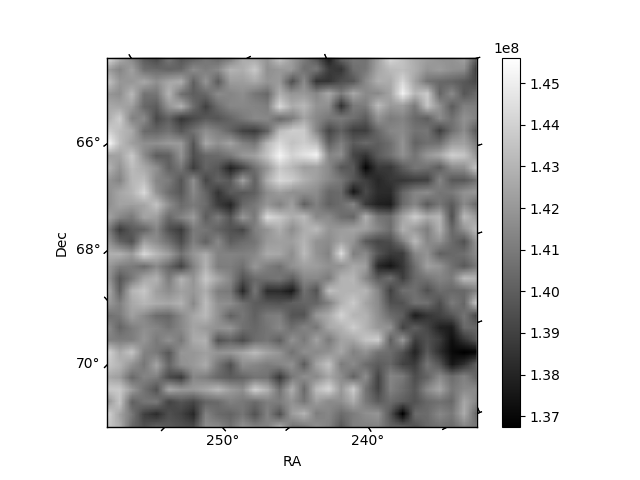
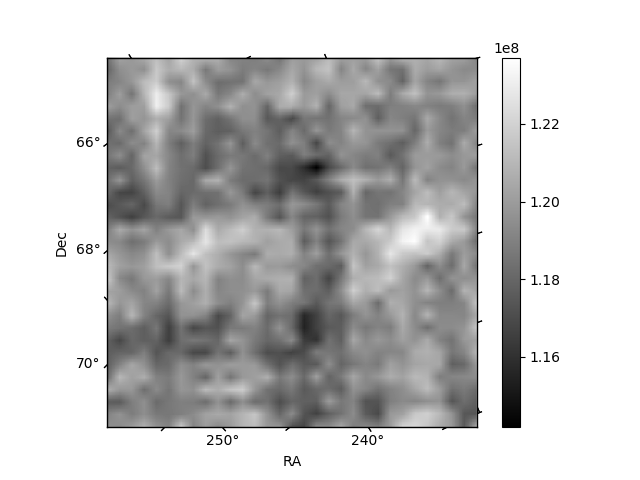
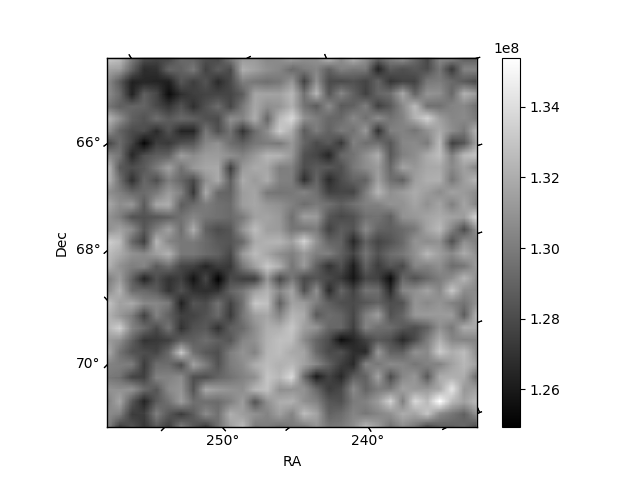
Histogram calculated using DETX and DETY for each event in the final _common_clean file
| Quadrant A | 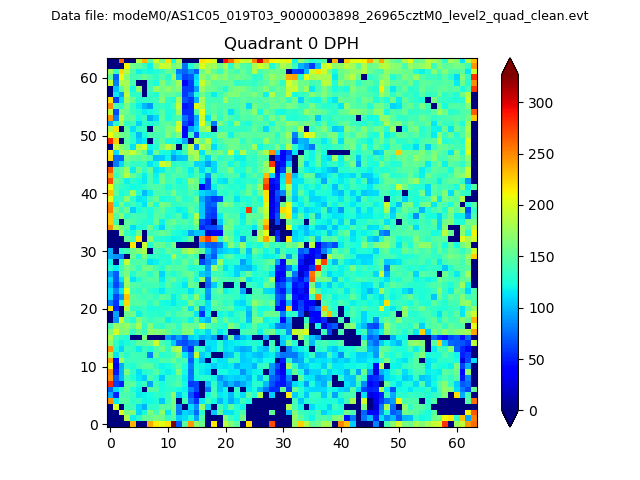 |
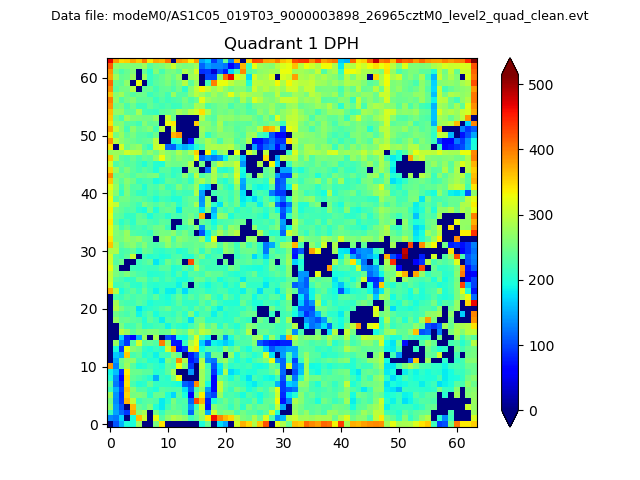 |
Quadrant B |
|---|---|---|---|
| Quadrant D | 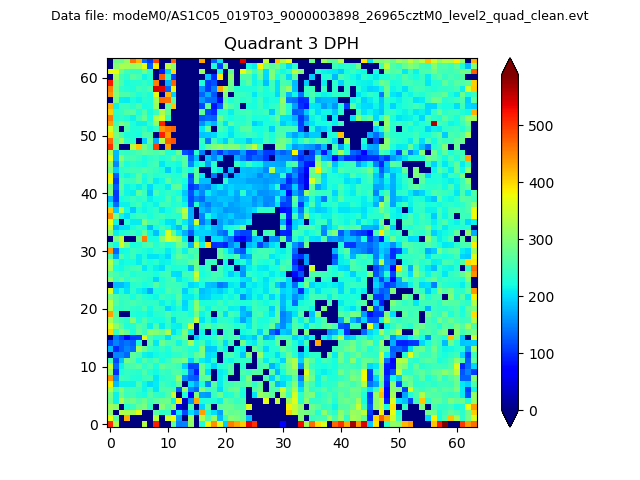 |
 |
Quadrant C |
| Plot type | Count rate plots | Images |
|---|---|---|
| Comparison with Poisson distribution Blue bars denote a histogram of data divided into 1 sec bins. Red curve is a Poisson curve with rate = median count rate of data. |
 |
 |
| Quadrant-wise count rates Data is divided into 100 sec bins |
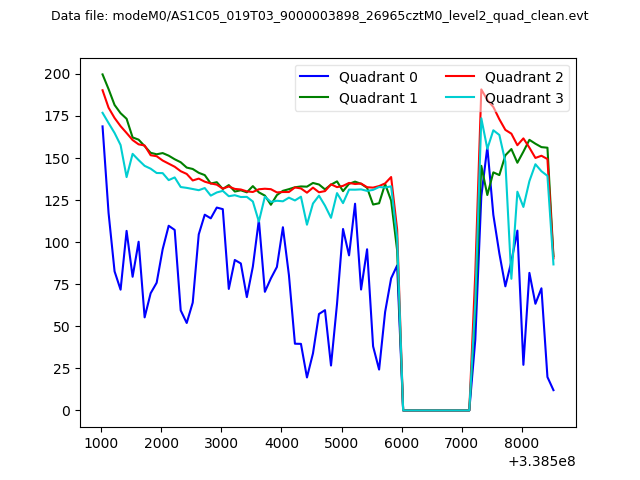 |
|
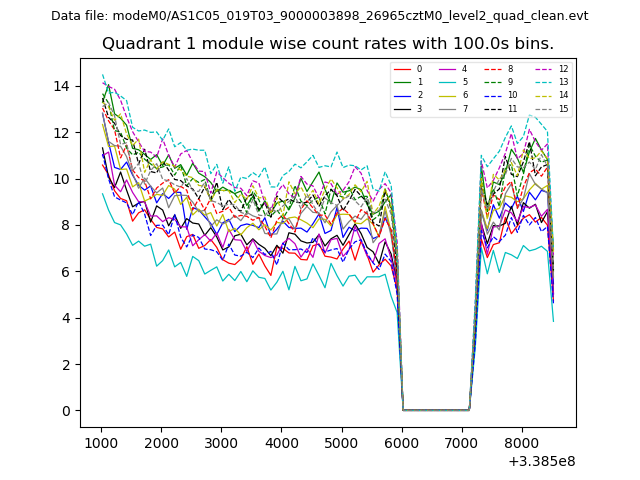
| Module-wise count rates for Quadrant A Data is divided into 100 sec bins |
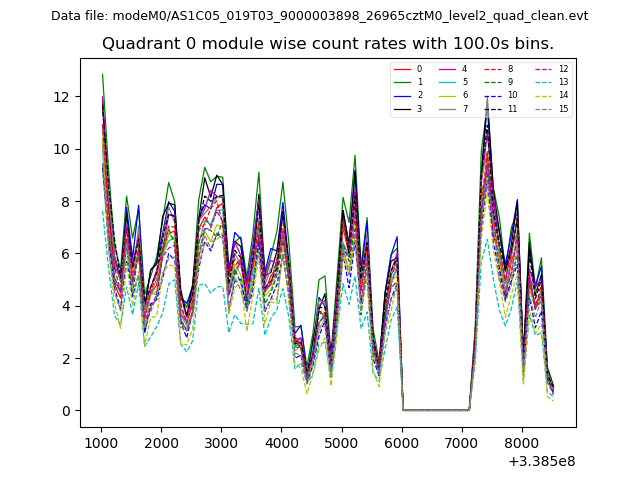 |
 |
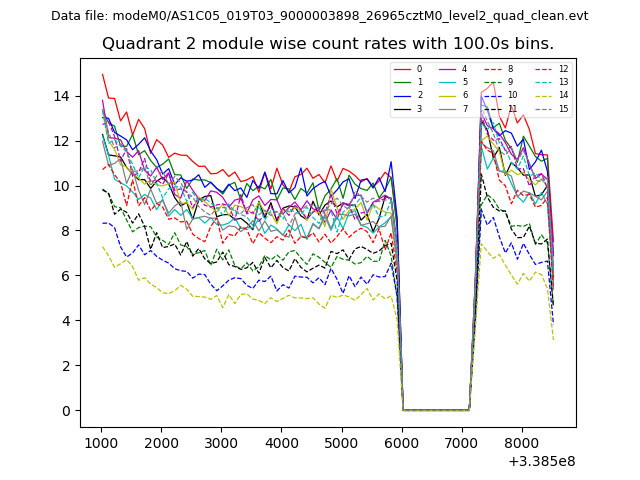
| Module-wise count rates for Quadrant B Data is divided into 100 sec bins |
 |
 |
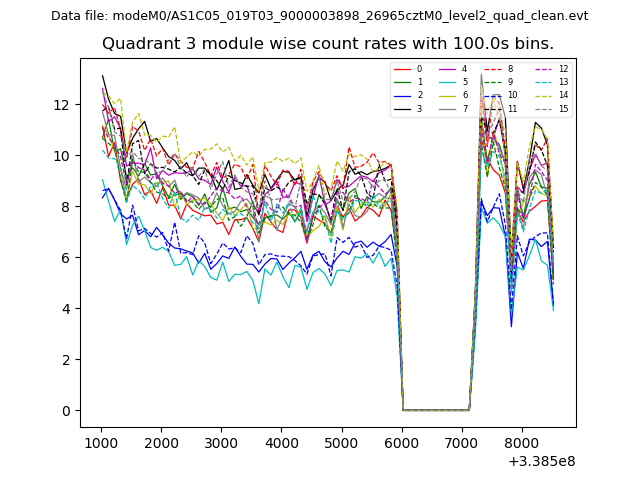
| Module-wise count rates for Quadrant C Data is divided into 100 sec bins |
 |
 |
| Module-wise count rates for Quadrant D Data is divided into 100 sec bins |
 |
 |
| Parameter | Plot |
|---|---|
| CZT HV Monitor | 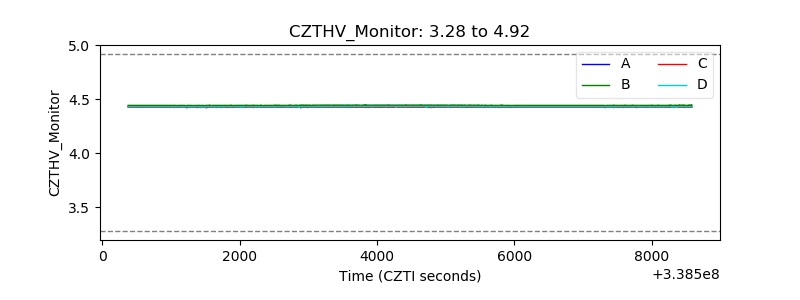 |
| D_VDD | 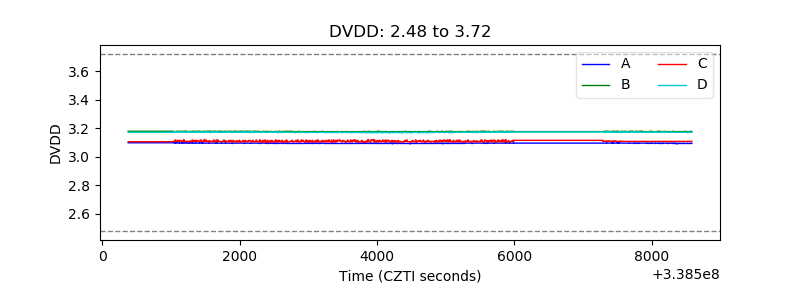 |
| Temperature 1 | 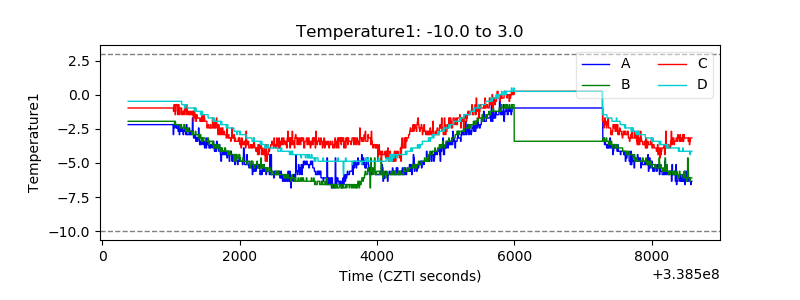 |
| Veto HV Monitor |  |
| Veto LLD | 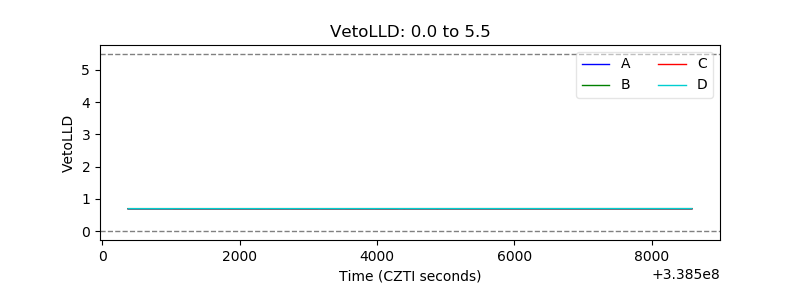 |
| Alpha Counter | 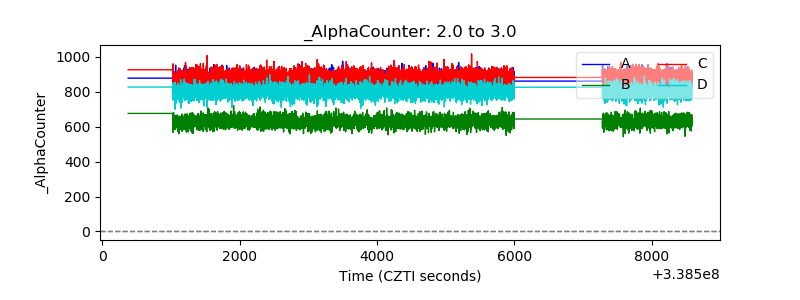 |
| _CPM_Rate | 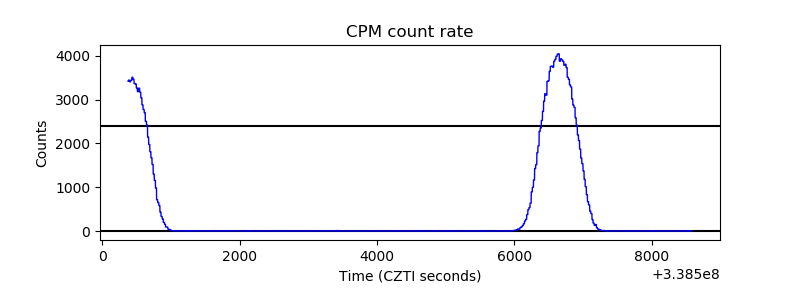 |
| CZT Counter | 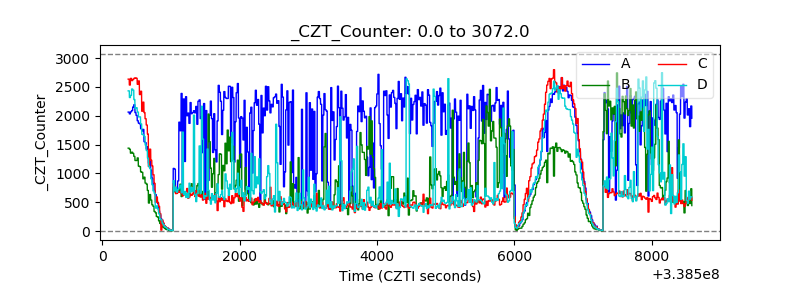 |
| +2.5 Volts monitor | 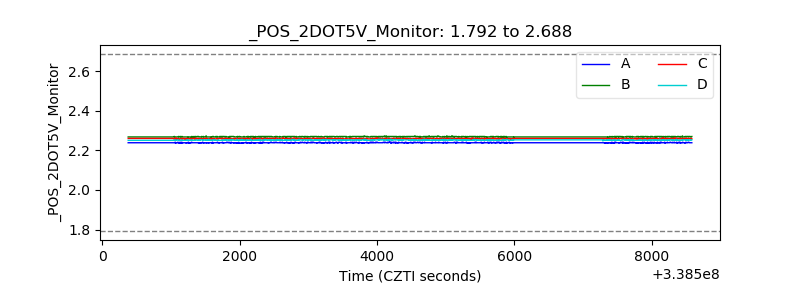 |
| +5 Volts monitor |  |
| _ROLL_ROT | 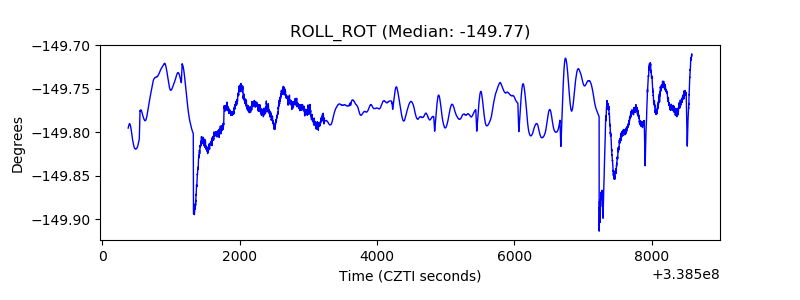 |
| _Roll_DEC | 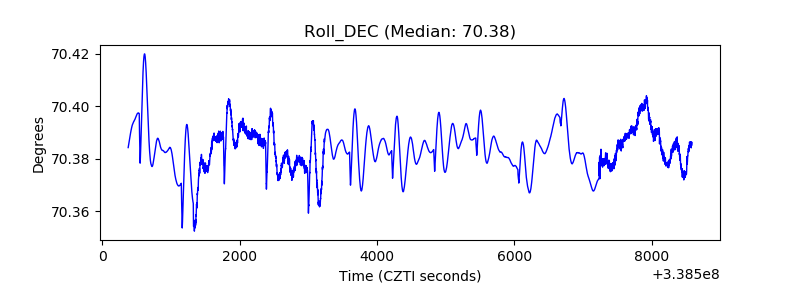 |
| _Roll_RA | 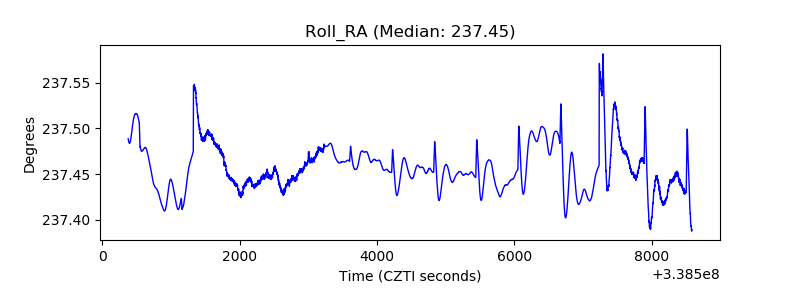 |
| Veto Counter | 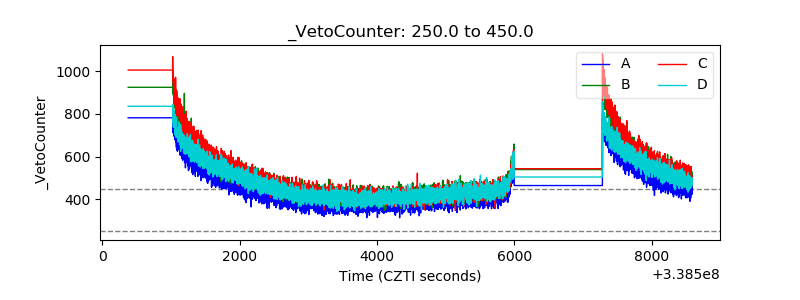 |