| Param | Original file | Final file |
|---|---|---|
| Filename | modeM0/AS1C05_019T03_9000003898_26966cztM0_level2.evt | modeM0/AS1C05_019T03_9000003898_26966cztM0_level2_quad_clean.evt |
| Size (bytes) | 889,320,960 | 120,490,560 |
| Size | 848.1 MB | 114.9 MB |
| Events in quadrant A | 11,329,457 | 535,879 |
| Events in quadrant B | 6,797,345 | 884,927 |
| Events in quadrant C | 3,270,472 | 929,535 |
| Events in quadrant D | 5,109,874 | 855,812 |
| Mode M0 | |||
|---|---|---|---|
| Quadrant | BADHDUFLAG | Total packets | Discarded packets |
| A | 0 | 37971 | 0 |
| B | 0 | 24453 | 0 |
| C | 0 | 13752 | 0 |
| D | 0 | 19429 | 0 |
| Mode M9 | |||
|---|---|---|---|
| Quadrant | BADHDUFLAG | Total packets | Discarded packets |
| A | 0 | 13 | 0 |
| B | 0 | 13 | 0 |
| C | 0 | 13 | 0 |
| D | 0 | 13 | 0 |
| Quadrant | Total seconds | Saturated seconds | Saturation percentage |
|---|---|---|---|
| A | 6309 | 4131 | 65.477889% |
| B | 6309 | 1386 | 21.968616% |
| C | 6308 | 69 | 1.093849% |
| D | 6309 | 516 | 8.178792% |
Noise dominated data is calculated using 1-second bins in cleaned event files. If a bin has >2000 counts, and if more than 50% of those come from <1% of pixels, then it is considered to be noise-dominated and hence unusable.
| Quadrant | # 1 sec bins | Bins with >0 counts | Bins with >2000 counts | High rate bins dominated by noise | Noise dominated (total time) | Noise dominated (detector-on time) | Marked lightcurve |
|---|---|---|---|---|---|---|---|
| A | 7669 | 6309 | 3433 | 3433 | 44.76% | 54.41% | 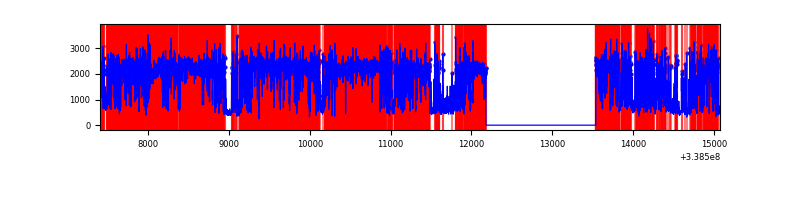 |
| B | 7669 | 6309 | 1118 | 1118 | 14.58% | 17.72% | 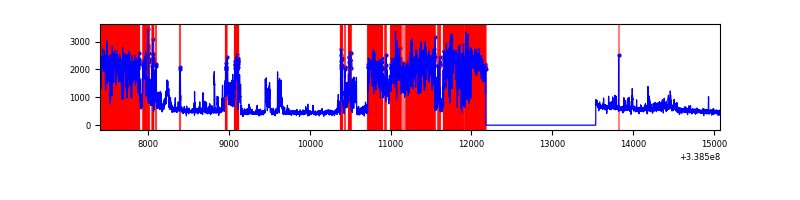 |
| C | 7668 | 6309 | 4 | 4 | 0.05% | 0.06% | 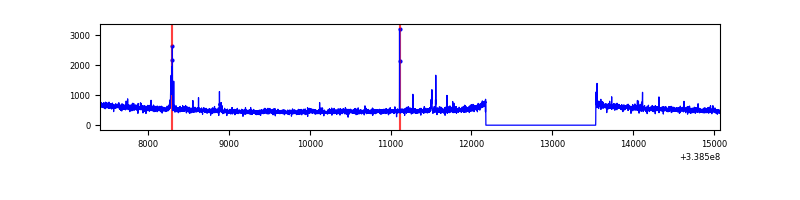 |
| D | 7669 | 6309 | 439 | 439 | 5.72% | 6.96% | 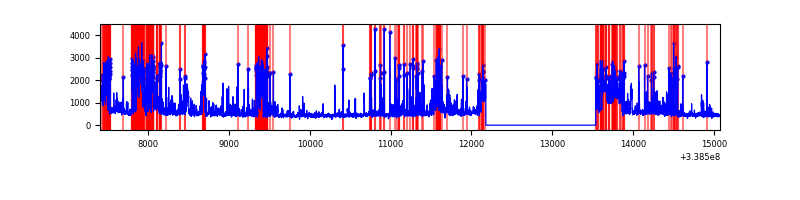 |
Top three noisy pixels from each quadrant. If the there are fewer than three noisy pixels in the level2.evt file, extra rows are filled as -1
| Pixel properties | Quadrant properties | ||||||
|---|---|---|---|---|---|---|---|
| Quadrant | DetID | PixID | Counts | Sigma | Mean | Median | Sigma |
| A | 14 | 235 | 9323026 | 94815.29 | 492 | 484 | 98.3 |
| A | 0 | 13 | 79021 | 798.76 | 492 | 484 | 98.3 |
| A | 8 | 192 | 12278 | 119.95 | 492 | 484 | 98.3 |
| B | 0 | 189 | 3712283 | 26758.55 | 755 | 737 | 138.7 |
| B | 5 | 172 | 75457 | 538.7 | 755 | 737 | 138.7 |
| B | 0 | 244 | 19586 | 135.89 | 755 | 737 | 138.7 |
| C | 14 | 238 | 128740 | 705.86 | 785 | 791 | 181.3 |
| C | 15 | 208 | 64029 | 348.87 | 785 | 791 | 181.3 |
| C | 2 | 16 | 5798 | 27.62 | 785 | 791 | 181.3 |
| D | 1 | 52 | 1345543 | 7533.37 | 753 | 732 | 178.5 |
| D | 2 | 250 | 583304 | 3263.46 | 753 | 732 | 178.5 |
| D | 11 | 176 | 121840 | 678.42 | 753 | 732 | 178.5 |
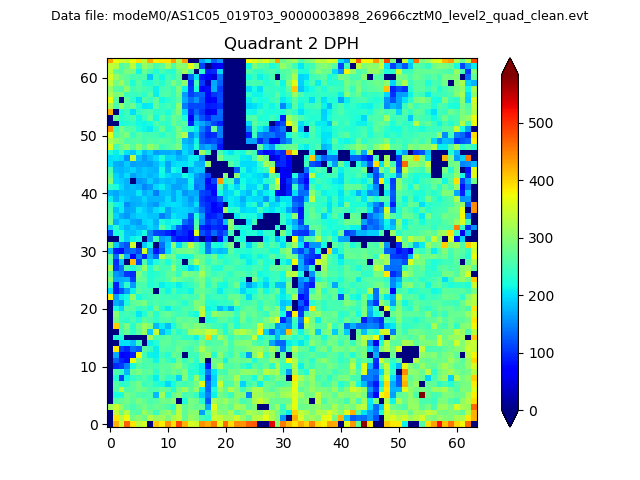
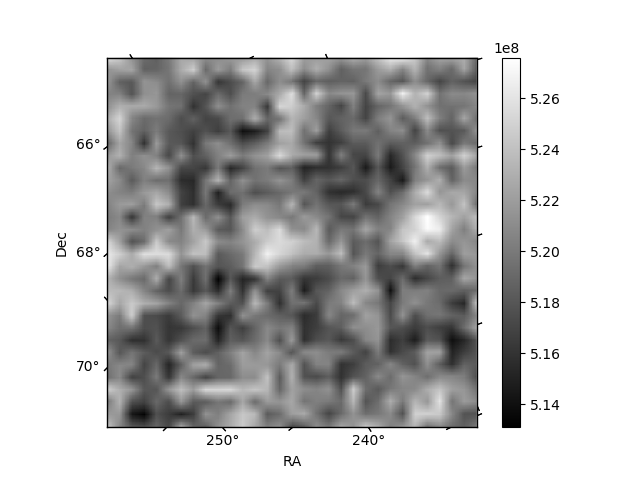
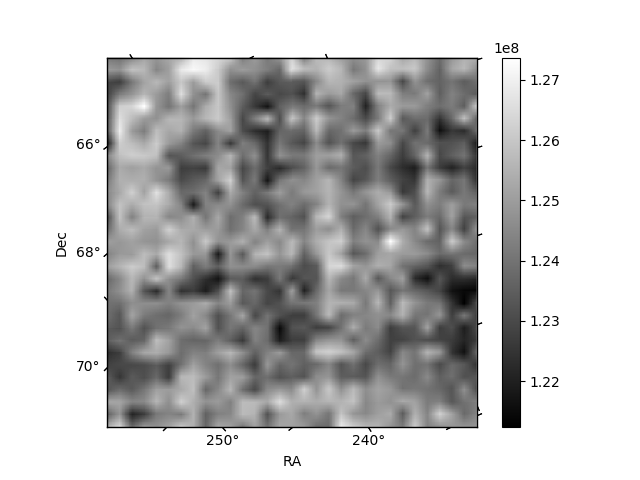
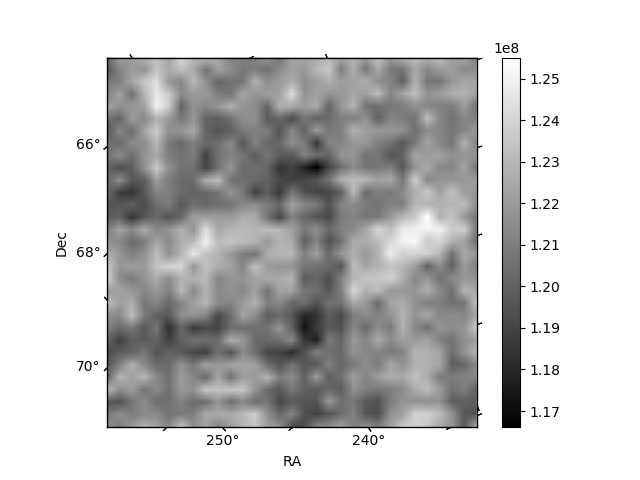
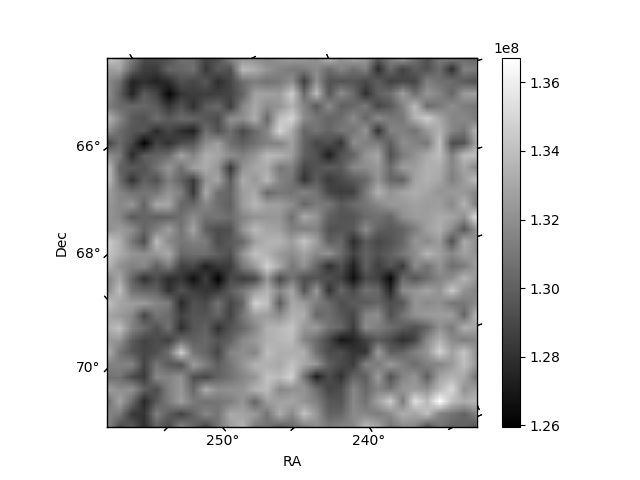
Histogram calculated using DETX and DETY for each event in the final _common_clean file
| Quadrant A | 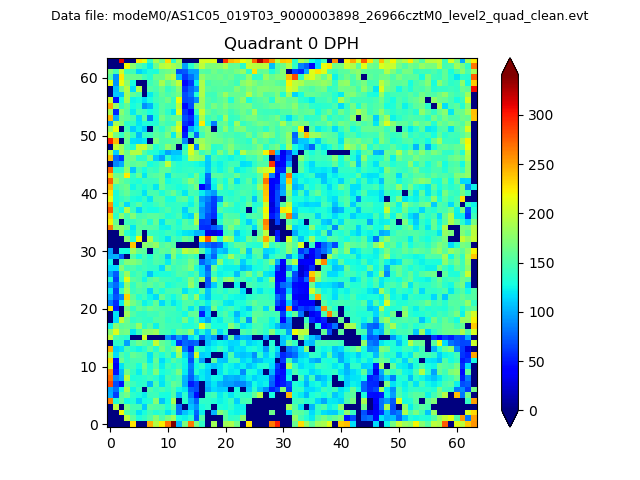 |
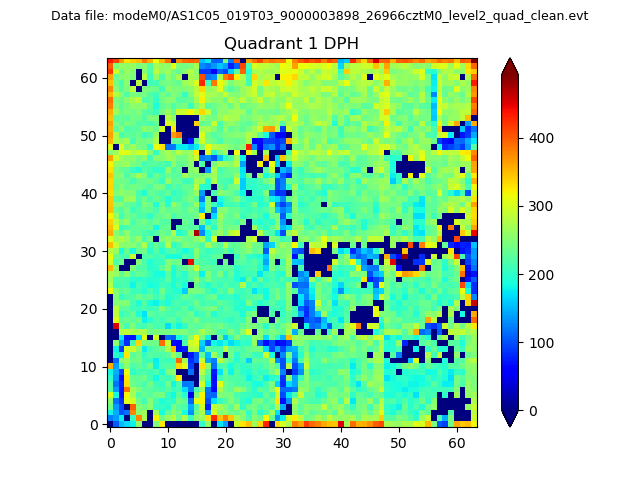 |
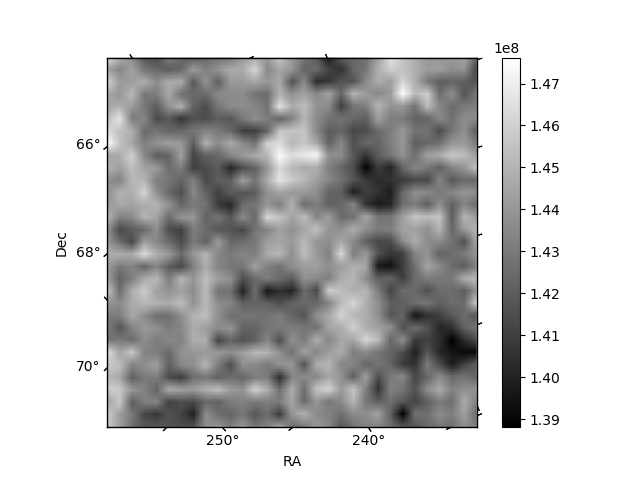
Quadrant B |
|---|---|---|---|
| Quadrant D | 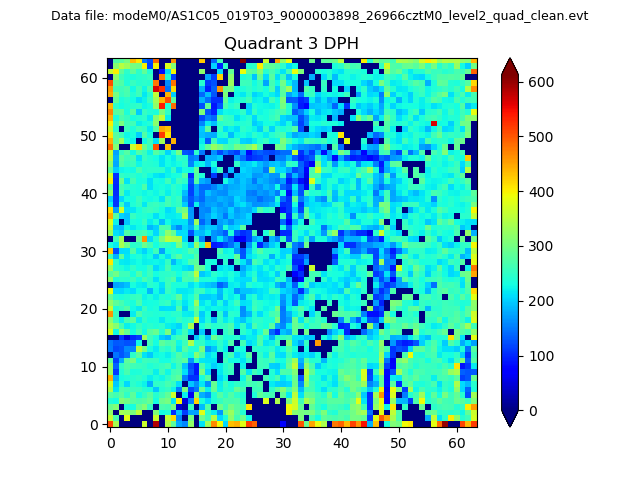 |
 |
Quadrant C |
| Plot type | Count rate plots | Images |
|---|---|---|
| Comparison with Poisson distribution Blue bars denote a histogram of data divided into 1 sec bins. Red curve is a Poisson curve with rate = median count rate of data. |
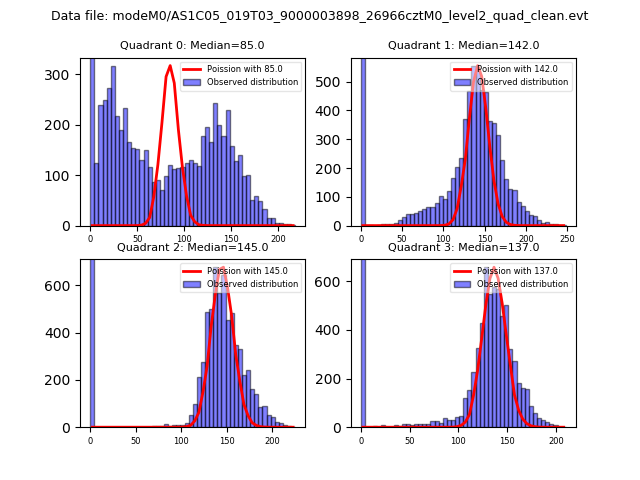 |
 |
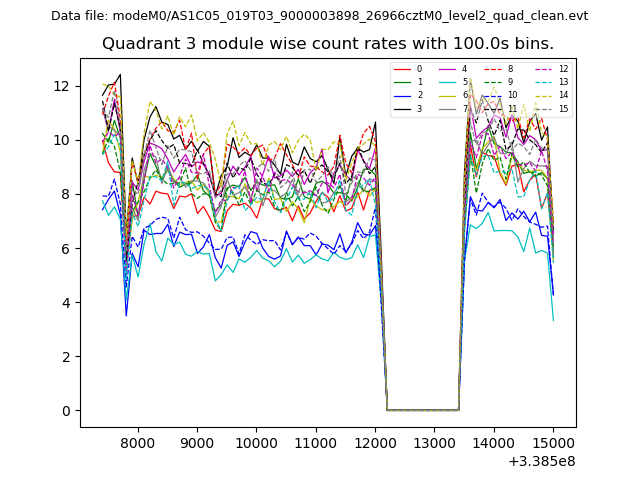
| Quadrant-wise count rates Data is divided into 100 sec bins |
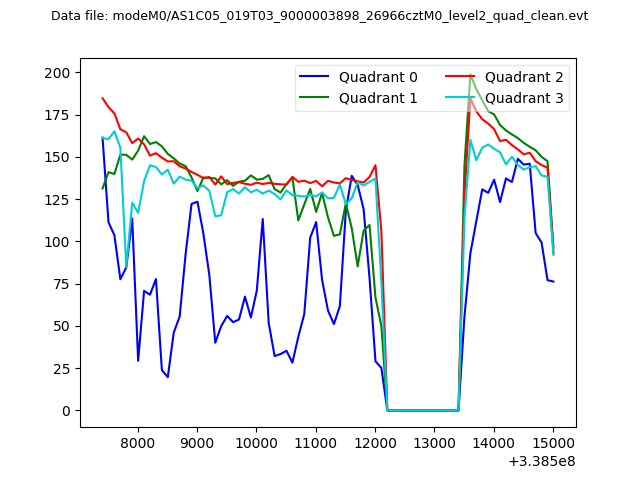 |
|
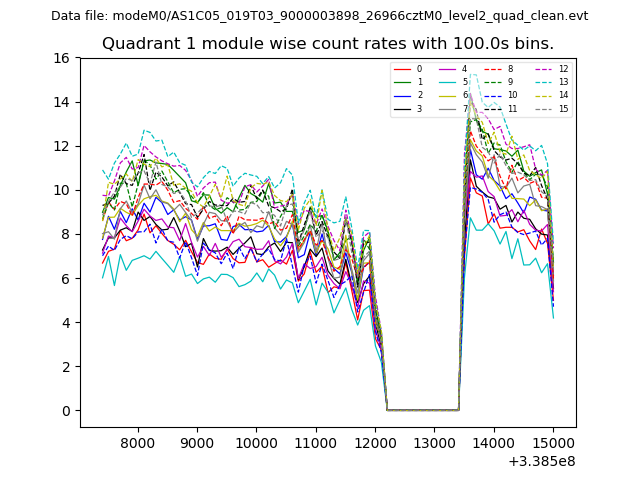
| Module-wise count rates for Quadrant A Data is divided into 100 sec bins |
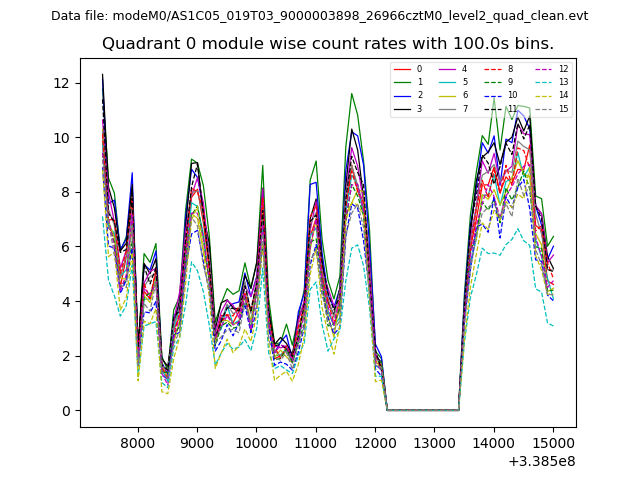 |
 |
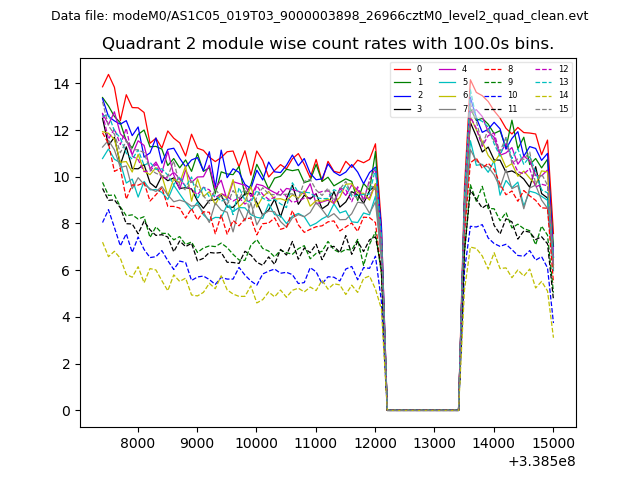
| Module-wise count rates for Quadrant B Data is divided into 100 sec bins |
 |
 |
| Module-wise count rates for Quadrant C Data is divided into 100 sec bins |
 |
 |
| Module-wise count rates for Quadrant D Data is divided into 100 sec bins |
 |
 |
| Parameter | Plot |
|---|---|
| CZT HV Monitor | 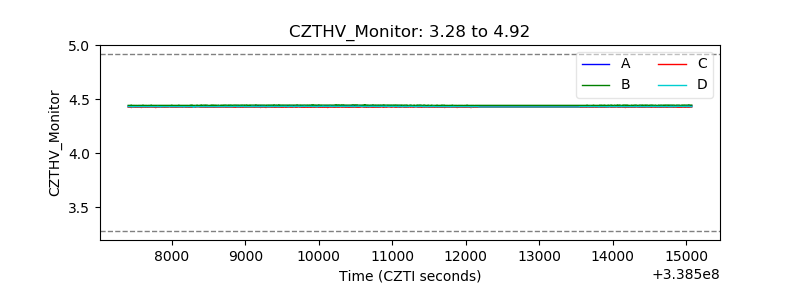 |
| D_VDD | 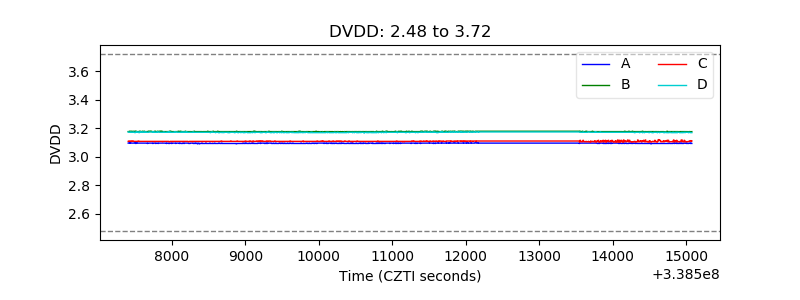 |
| Temperature 1 | 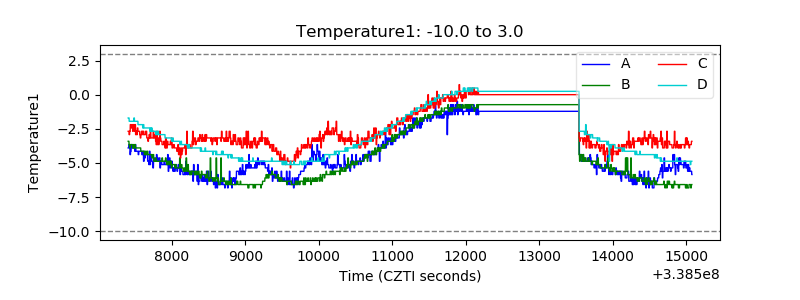 |
| Veto HV Monitor | 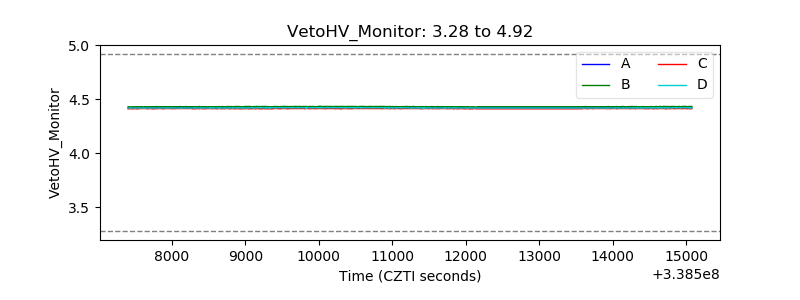 |
| Veto LLD | 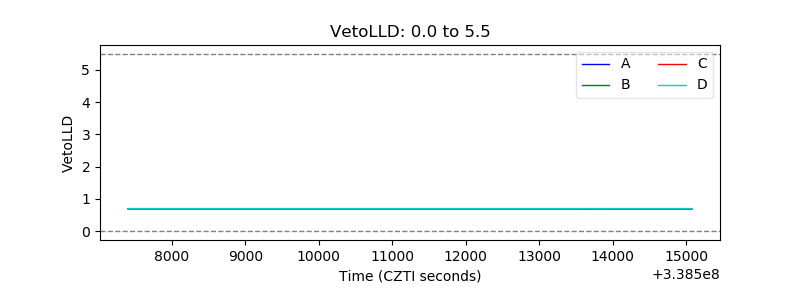 |
| Alpha Counter | 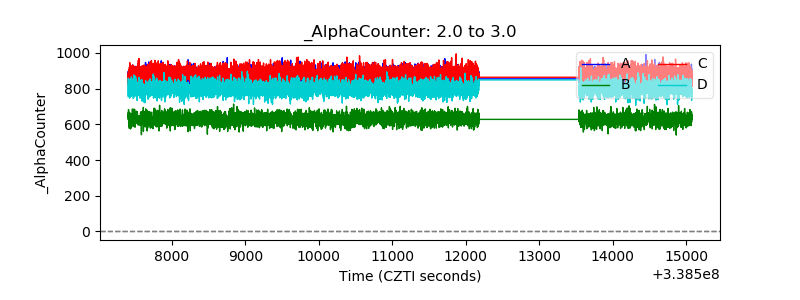 |
| _CPM_Rate | 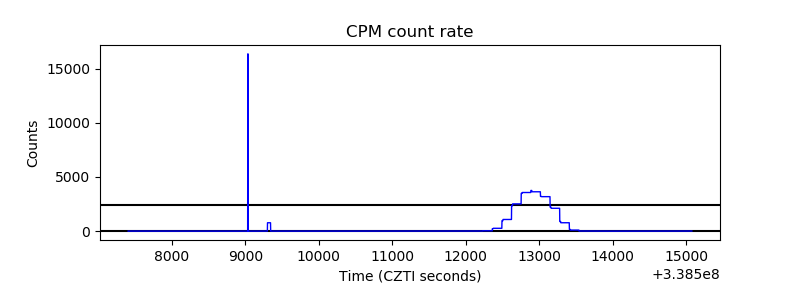 |
| CZT Counter | 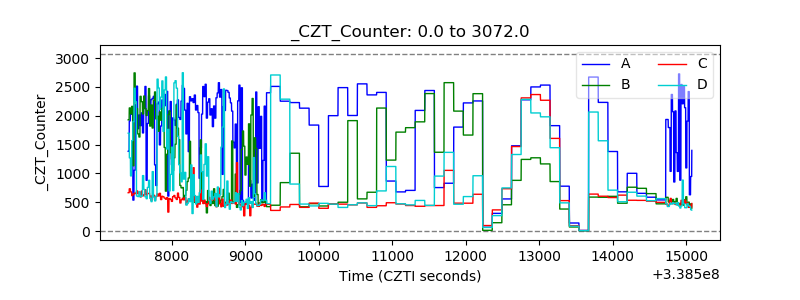 |
| +2.5 Volts monitor | 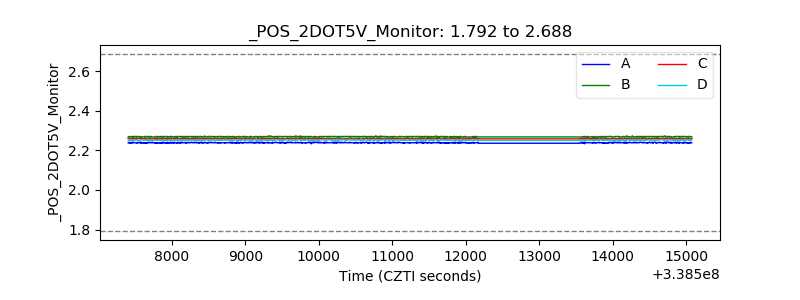 |
| +5 Volts monitor |  |
| _ROLL_ROT | 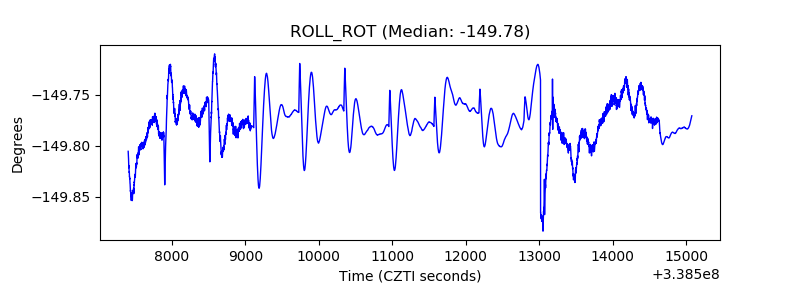 |
| _Roll_DEC | 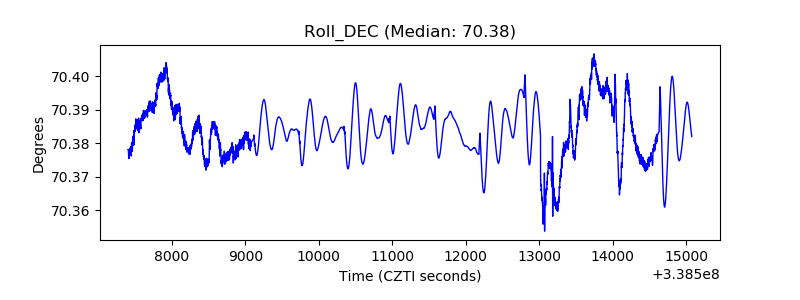 |
| _Roll_RA | 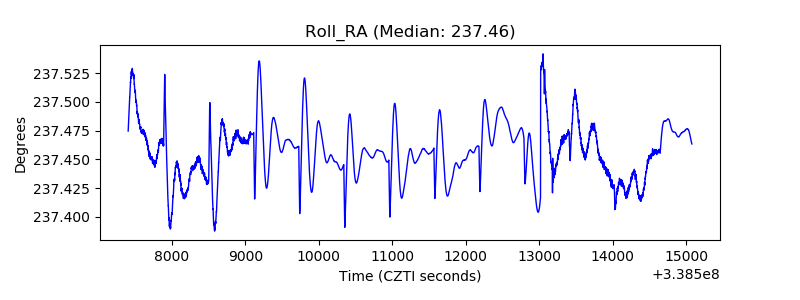 |
| Veto Counter | 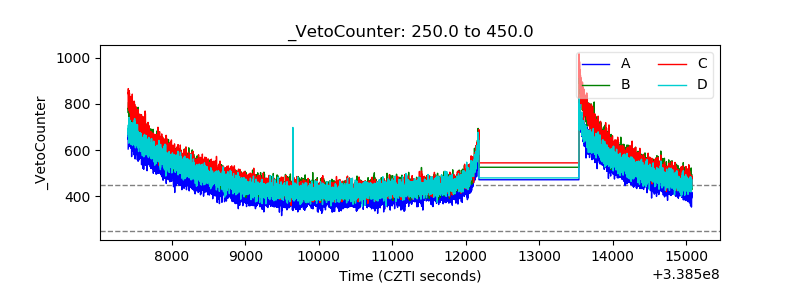 |