| Param | Original file | Final file |
|---|---|---|
| Filename | modeM0/AS1C05_019T03_9000003898_26967cztM0_level2.evt | modeM0/AS1C05_019T03_9000003898_26967cztM0_level2_quad_clean.evt |
| Size (bytes) | 862,499,520 | 115,620,480 |
| Size | 822.5 MB | 110.3 MB |
| Events in quadrant A | 11,691,242 | 494,000 |
| Events in quadrant B | 7,033,269 | 848,380 |
| Events in quadrant C | 3,118,329 | 888,867 |
| Events in quadrant D | 3,868,462 | 844,162 |
| Mode M0 | |||
|---|---|---|---|
| Quadrant | BADHDUFLAG | Total packets | Discarded packets |
| A | 0 | 38844 | 0 |
| B | 0 | 24993 | 0 |
| C | 0 | 13059 | 0 |
| D | 0 | 15665 | 0 |
| Mode M9 | |||
|---|---|---|---|
| Quadrant | BADHDUFLAG | Total packets | Discarded packets |
| A | 0 | 21 | 0 |
| B | 0 | 22 | 0 |
| C | 0 | 22 | 2 |
| D | 0 | 22 | 1 |
| Quadrant | Total seconds | Saturated seconds | Saturation percentage |
|---|---|---|---|
| A | 6034 | 4278 | 70.898243% |
| B | 6029 | 1374 | 22.789849% |
| C | 6069 | 111 | 1.828967% |
| D | 6060 | 238 | 3.927393% |
Noise dominated data is calculated using 1-second bins in cleaned event files. If a bin has >2000 counts, and if more than 50% of those come from <1% of pixels, then it is considered to be noise-dominated and hence unusable.
| Quadrant | # 1 sec bins | Bins with >0 counts | Bins with >2000 counts | High rate bins dominated by noise | Noise dominated (total time) | Noise dominated (detector-on time) | Marked lightcurve |
|---|---|---|---|---|---|---|---|
| A | 7763 | 6043 | 3641 | 3641 | 46.90% | 60.25% | 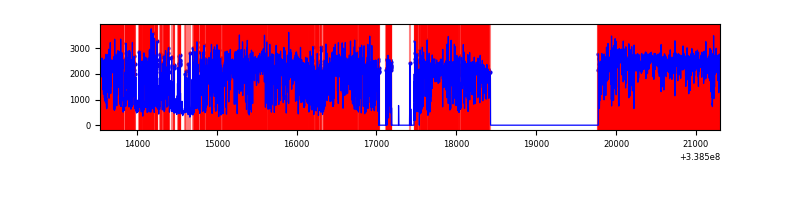 |
| B | 7764 | 6038 | 1040 | 1040 | 13.40% | 17.22% | 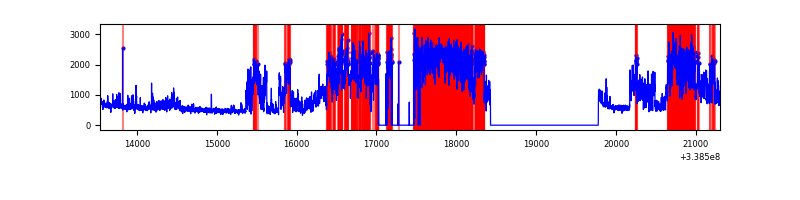 |
| C | 7764 | 6101 | 0 | 0 | 0.00% | 0.00% | 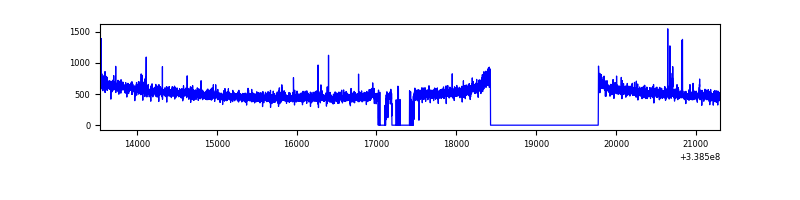 |
| D | 7764 | 6087 | 165 | 165 | 2.13% | 2.71% | 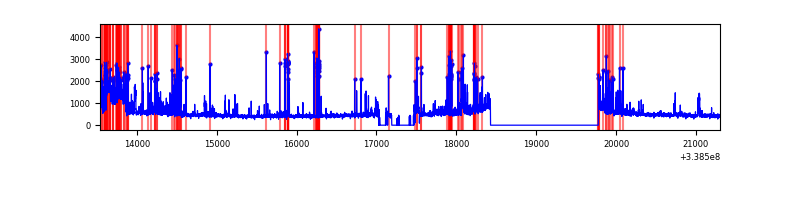 |
Top three noisy pixels from each quadrant. If the there are fewer than three noisy pixels in the level2.evt file, extra rows are filled as -1
| Pixel properties | Quadrant properties | ||||||
|---|---|---|---|---|---|---|---|
| Quadrant | DetID | PixID | Counts | Sigma | Mean | Median | Sigma |
| A | 14 | 235 | 7745487 | 84127.73 | 463 | 455 | 92.1 |
| A | 6 | 16 | 1895408 | 20583.27 | 463 | 455 | 92.1 |
| A | 0 | 13 | 238190 | 2582.31 | 463 | 455 | 92.1 |
| B | 0 | 189 | 4088995 | 30327.16 | 732 | 716 | 134.8 |
| B | 0 | 230 | 29923 | 216.66 | 732 | 716 | 134.8 |
| B | 5 | 172 | 26629 | 192.22 | 732 | 716 | 134.8 |
| C | 14 | 238 | 124670 | 715.38 | 754 | 761 | 173.2 |
| C | 15 | 208 | 27025 | 151.63 | 754 | 761 | 173.2 |
| C | 8 | 128 | 9317 | 49.4 | 754 | 761 | 173.2 |
| D | 1 | 52 | 787886 | 4529.12 | 740 | 723 | 173.8 |
| D | 2 | 250 | 193288 | 1107.97 | 740 | 723 | 173.8 |
| D | 12 | 233 | 32728 | 184.15 | 740 | 723 | 173.8 |
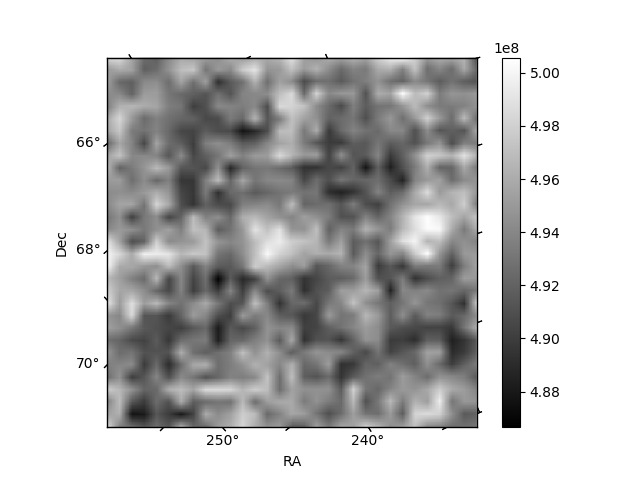
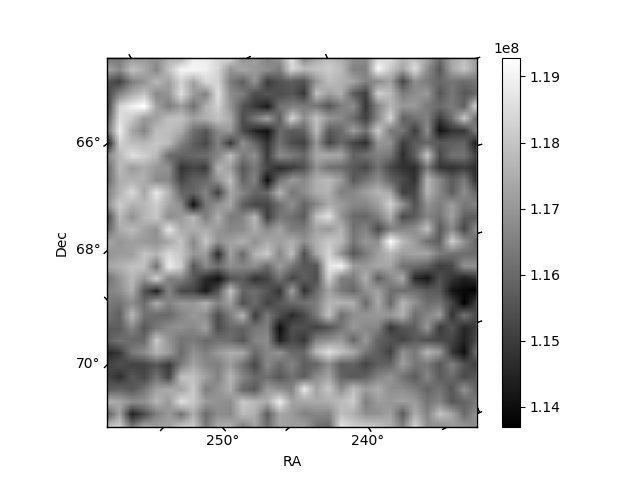
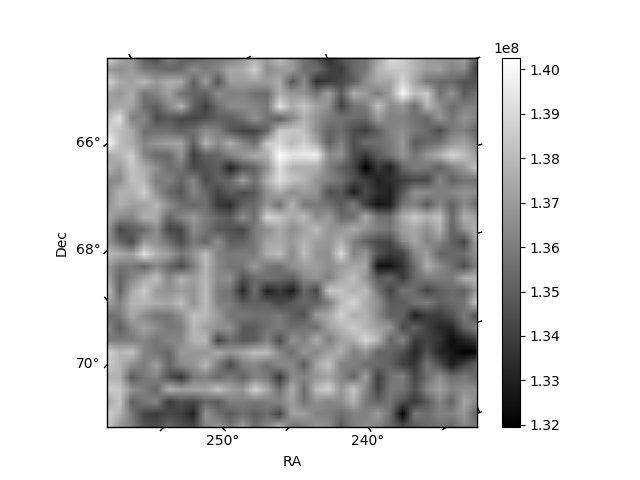
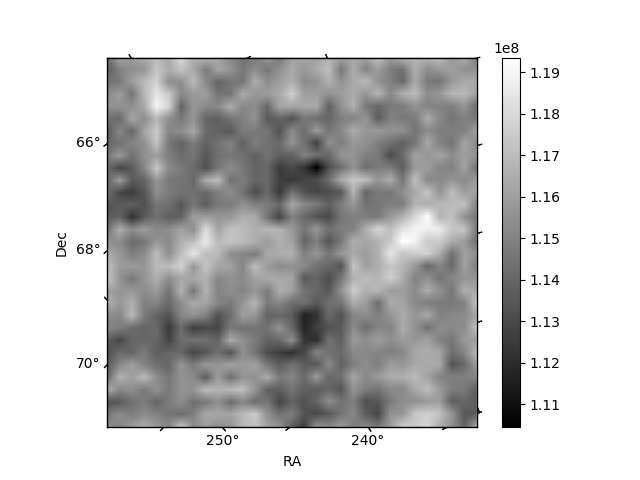
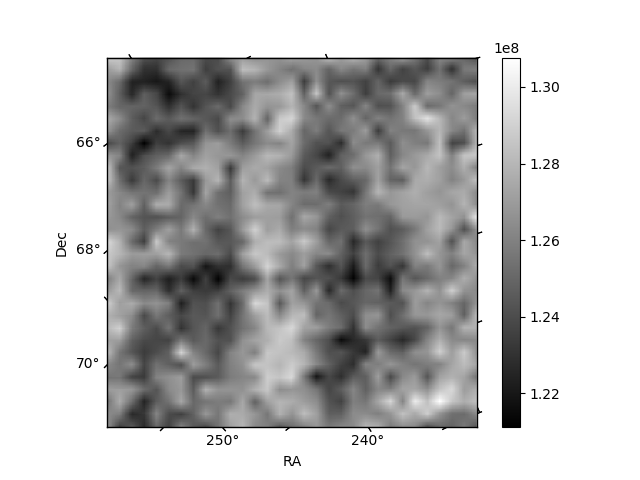
Histogram calculated using DETX and DETY for each event in the final _common_clean file
| Quadrant A | 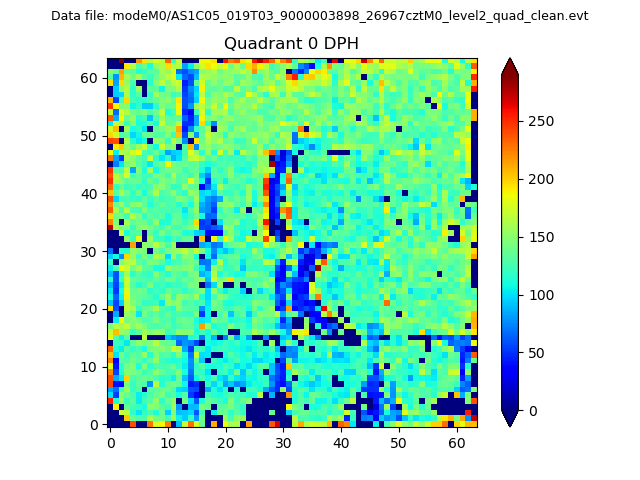 |
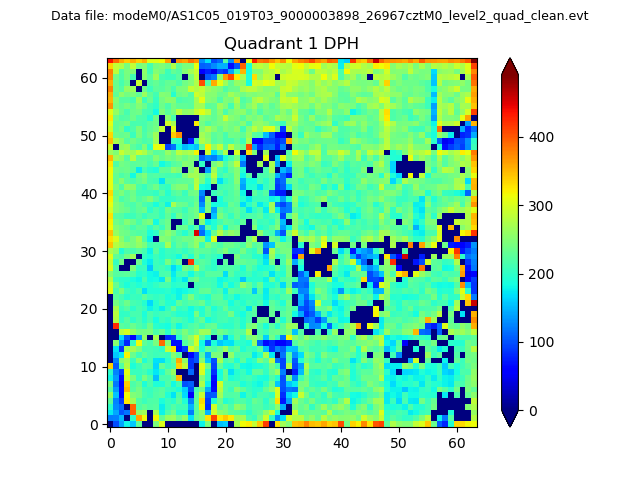 |
Quadrant B |
|---|---|---|---|
| Quadrant D |  |
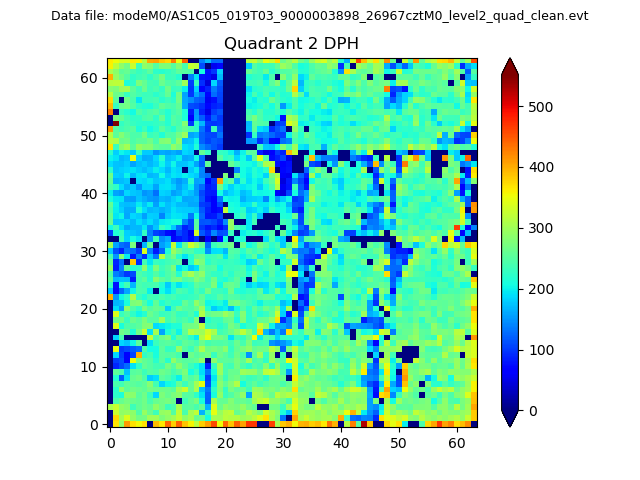 |
Quadrant C |
| Plot type | Count rate plots | Images |
|---|---|---|
| Comparison with Poisson distribution Blue bars denote a histogram of data divided into 1 sec bins. Red curve is a Poisson curve with rate = median count rate of data. |
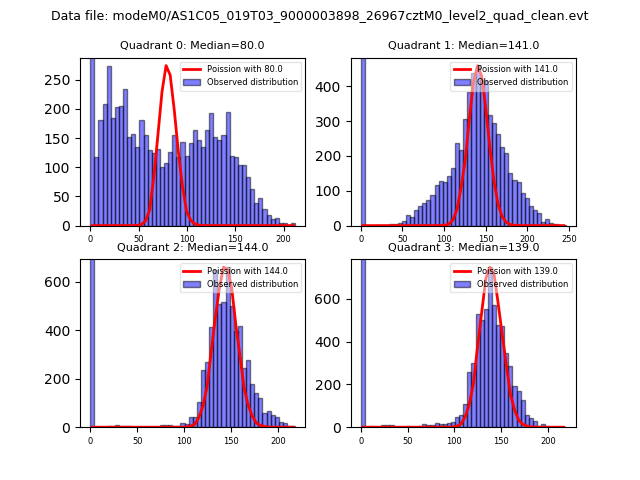 |
 |
| Quadrant-wise count rates Data is divided into 100 sec bins |
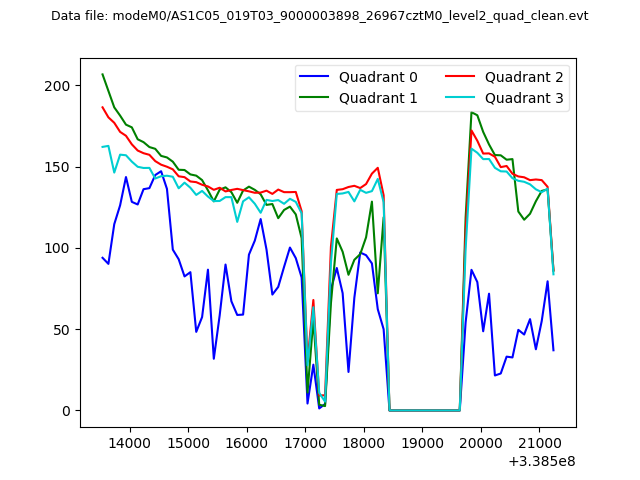 |
|
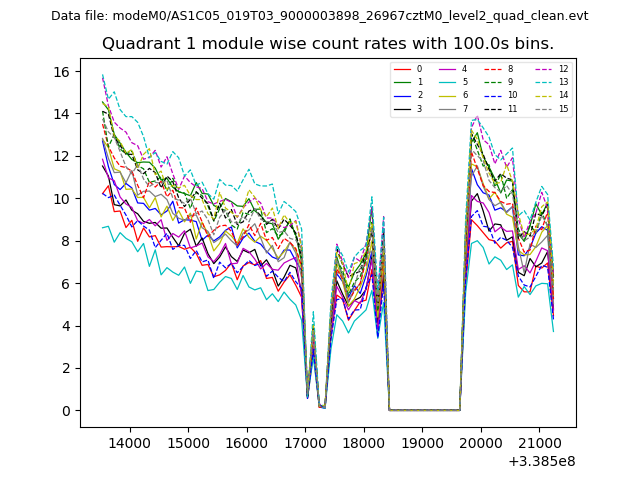
| Module-wise count rates for Quadrant A Data is divided into 100 sec bins |
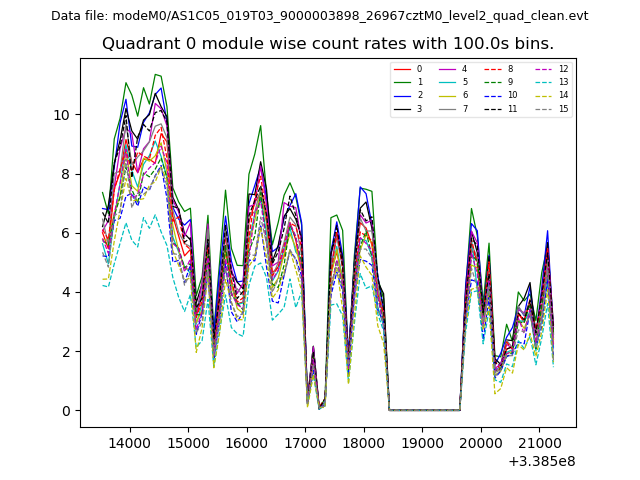 |
 |
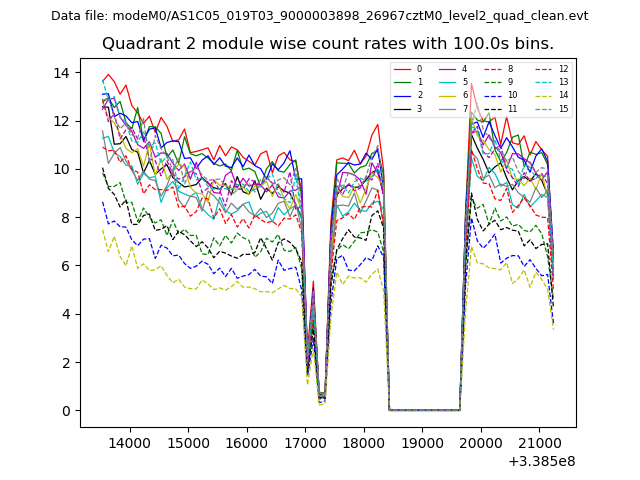
| Module-wise count rates for Quadrant B Data is divided into 100 sec bins |
 |
 |
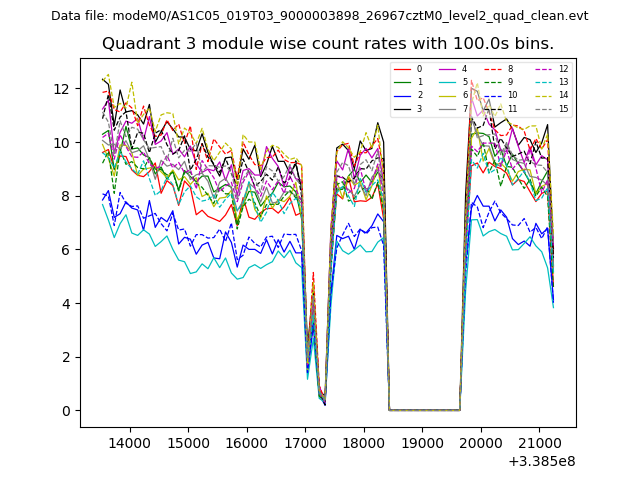
| Module-wise count rates for Quadrant C Data is divided into 100 sec bins |
 |
 |
| Module-wise count rates for Quadrant D Data is divided into 100 sec bins |
 |
 |
| Parameter | Plot |
|---|---|
| CZT HV Monitor | 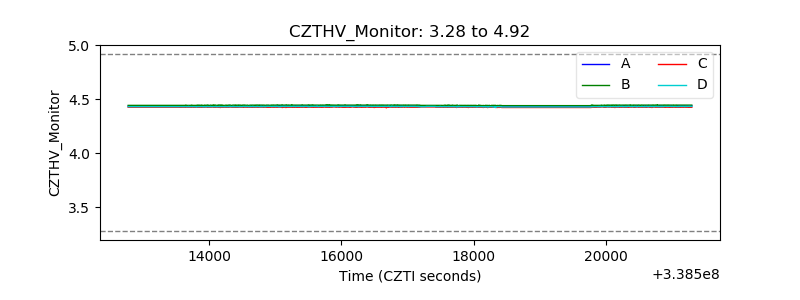 |
| D_VDD | 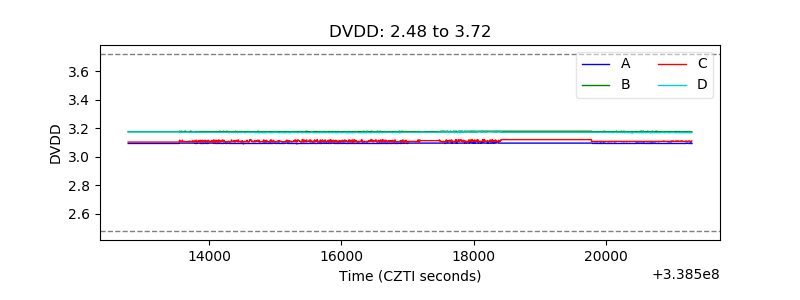 |
| Temperature 1 | 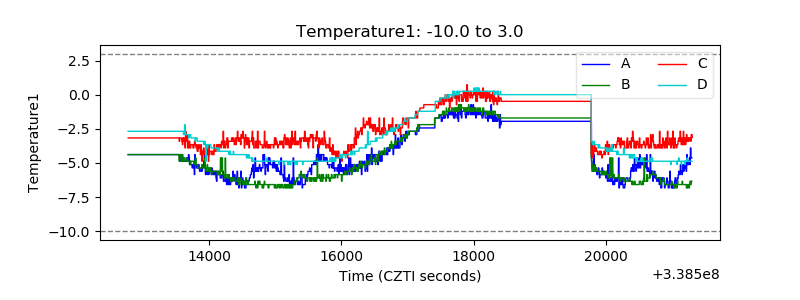 |
| Veto HV Monitor | 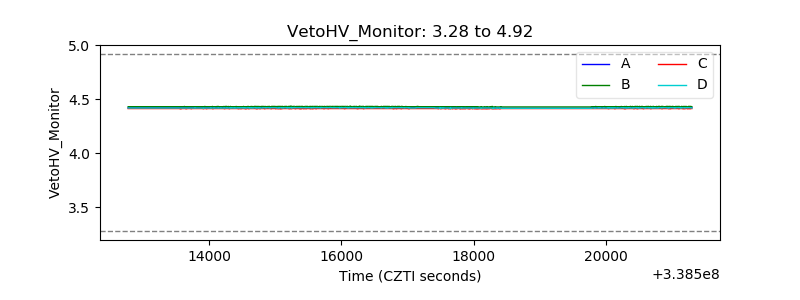 |
| Veto LLD | 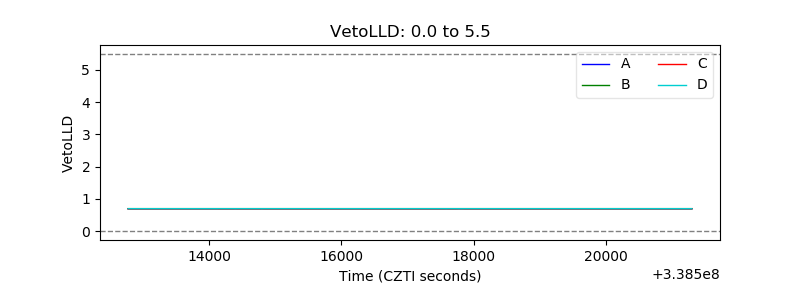 |
| Alpha Counter | 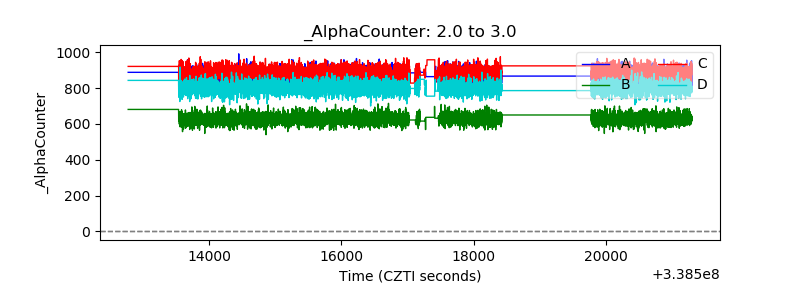 |
| _CPM_Rate | 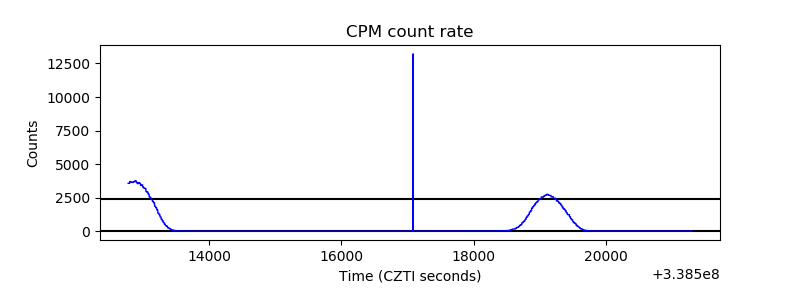 |
| CZT Counter |  |
| +2.5 Volts monitor |  |
| +5 Volts monitor |  |
| _ROLL_ROT | 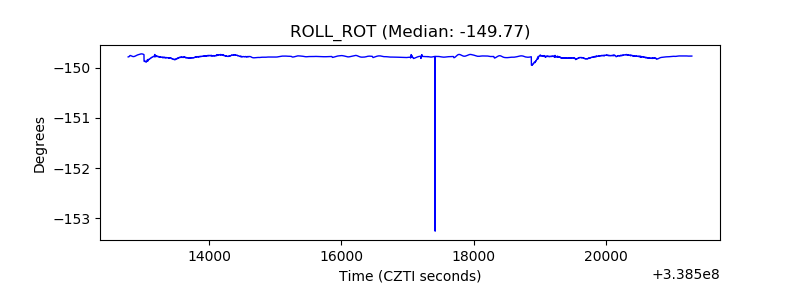 |
| _Roll_DEC | 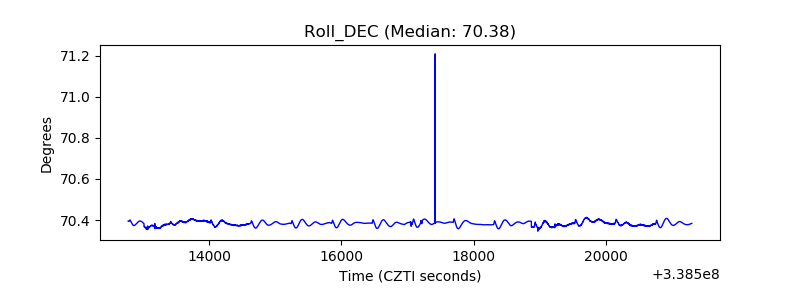 |
| _Roll_RA |  |
| Veto Counter | 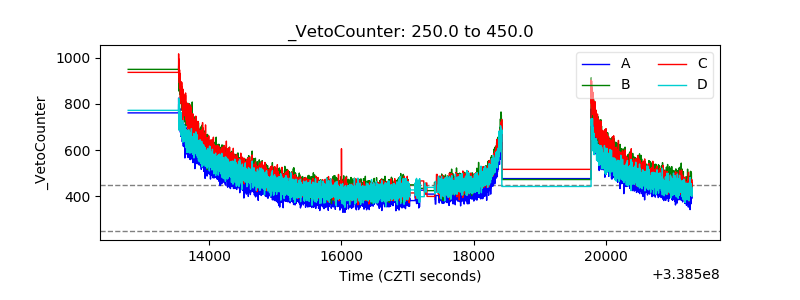 |