| Param | Original file | Final file |
|---|---|---|
| Filename | modeM0/AS1C05_019T03_9000003898_26968cztM0_level2.evt | modeM0/AS1C05_019T03_9000003898_26968cztM0_level2_quad_clean.evt |
| Size (bytes) | 820,310,400 | 103,645,440 |
| Size | 782.3 MB | 98.8 MB |
| Events in quadrant A | 10,434,828 | 493,869 |
| Events in quadrant B | 7,857,301 | 711,438 |
| Events in quadrant C | 2,801,084 | 779,043 |
| Events in quadrant D | 3,363,993 | 752,304 |
| Mode M0 | |||
|---|---|---|---|
| Quadrant | BADHDUFLAG | Total packets | Discarded packets |
| A | 0 | 34944 | 0 |
| B | 0 | 27276 | 0 |
| C | 0 | 11981 | 0 |
| D | 0 | 14114 | 0 |
| Mode M9 | |||
|---|---|---|---|
| Quadrant | BADHDUFLAG | Total packets | Discarded packets |
| A | 0 | 13 | 0 |
| B | 0 | 13 | 0 |
| C | 0 | 13 | 0 |
| D | 0 | 13 | 0 |
| Quadrant | Total seconds | Saturated seconds | Saturation percentage |
|---|---|---|---|
| A | 5721 | 3696 | 64.604090% |
| B | 5721 | 1681 | 29.382975% |
| C | 5722 | 83 | 1.450542% |
| D | 5722 | 119 | 2.079692% |
Noise dominated data is calculated using 1-second bins in cleaned event files. If a bin has >2000 counts, and if more than 50% of those come from <1% of pixels, then it is considered to be noise-dominated and hence unusable.
| Quadrant | # 1 sec bins | Bins with >0 counts | Bins with >2000 counts | High rate bins dominated by noise | Noise dominated (total time) | Noise dominated (detector-on time) | Marked lightcurve |
|---|---|---|---|---|---|---|---|
| A | 7000 | 5720 | 3060 | 3060 | 43.71% | 53.50% | 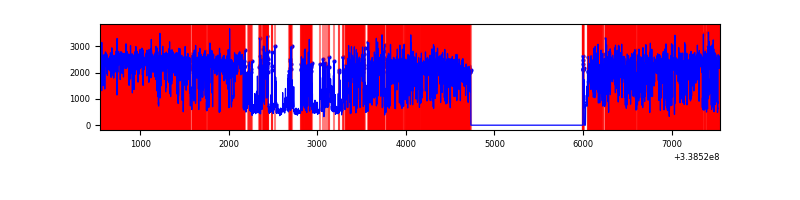 |
| B | 7001 | 5722 | 1393 | 1393 | 19.90% | 24.34% | 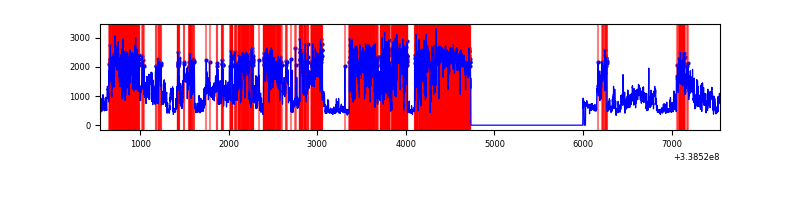 |
| C | 7002 | 5724 | 4 | 4 | 0.06% | 0.07% | 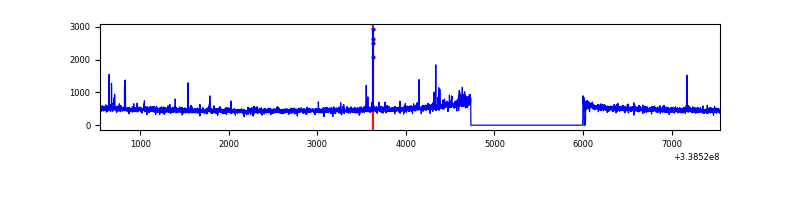 |
| D | 7002 | 5724 | 68 | 68 | 0.97% | 1.19% | 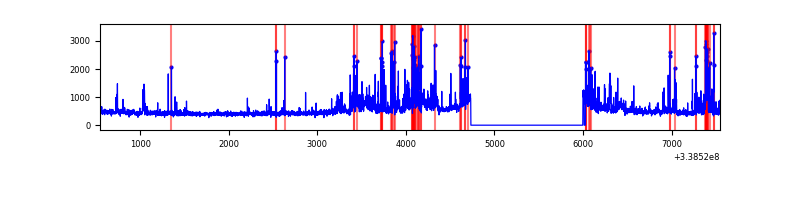 |
Top three noisy pixels from each quadrant. If the there are fewer than three noisy pixels in the level2.evt file, extra rows are filled as -1
| Pixel properties | Quadrant properties | ||||||
|---|---|---|---|---|---|---|---|
| Quadrant | DetID | PixID | Counts | Sigma | Mean | Median | Sigma |
| A | 14 | 235 | 7590133 | 80990.63 | 469 | 461 | 93.7 |
| A | 6 | 16 | 948892 | 10120.86 | 469 | 461 | 93.7 |
| A | 0 | 13 | 69839 | 740.34 | 469 | 461 | 93.7 |
| B | 0 | 189 | 5279562 | 44872.79 | 636 | 621 | 117.6 |
| B | 5 | 172 | 45258 | 379.43 | 636 | 621 | 117.6 |
| B | 0 | 230 | 17415 | 142.75 | 636 | 621 | 117.6 |
| C | 14 | 238 | 109887 | 705.95 | 671 | 676 | 154.7 |
| C | 15 | 208 | 42761 | 272.04 | 671 | 676 | 154.7 |
| C | 2 | 16 | 23272 | 146.06 | 671 | 676 | 154.7 |
| D | 1 | 52 | 457936 | 2890.07 | 670 | 652 | 158.2 |
| D | 2 | 250 | 153872 | 968.36 | 670 | 652 | 158.2 |
| D | 12 | 1 | 117622 | 739.26 | 670 | 652 | 158.2 |
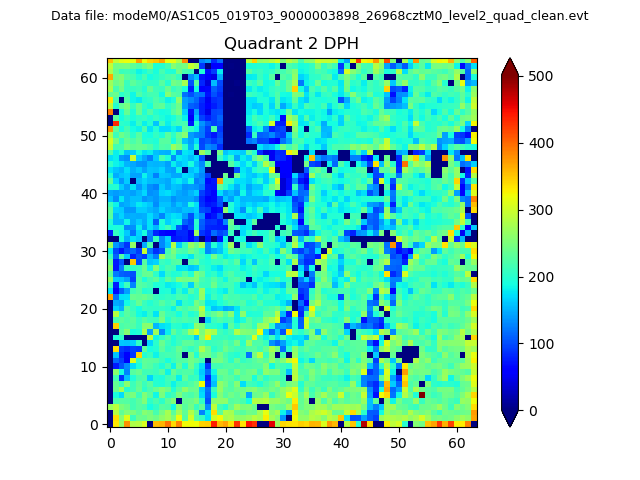
Histogram calculated using DETX and DETY for each event in the final _common_clean file
| Quadrant A | 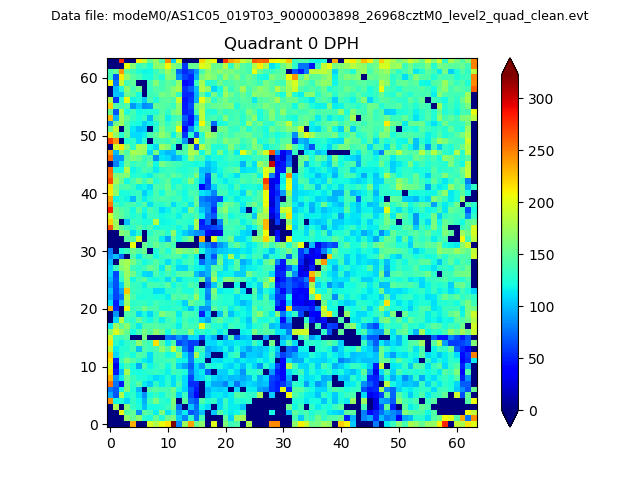 |
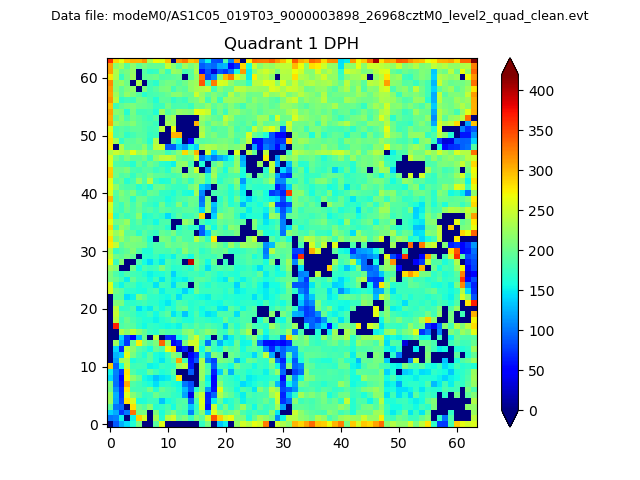 |
Quadrant B |
|---|---|---|---|
| Quadrant D | 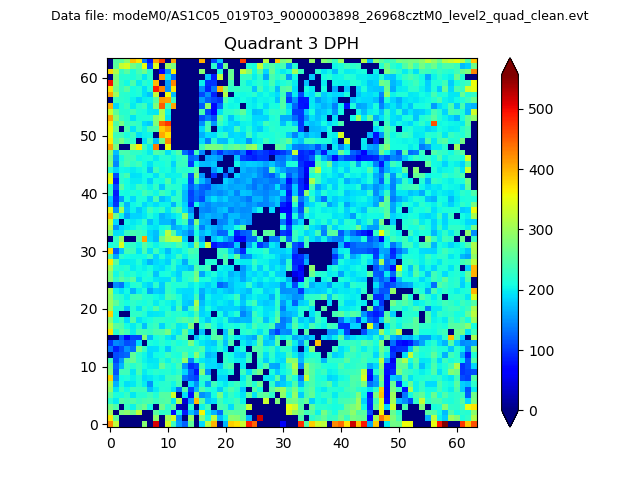 |
 |
Quadrant C |
| Plot type | Count rate plots | Images |
|---|---|---|
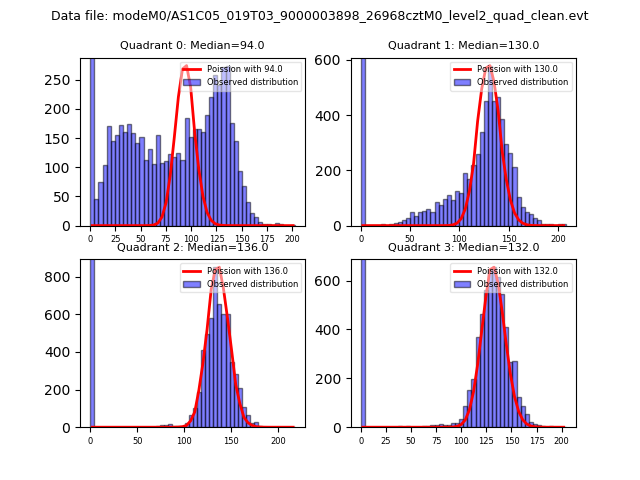
| Comparison with Poisson distribution Blue bars denote a histogram of data divided into 1 sec bins. Red curve is a Poisson curve with rate = median count rate of data. |
 |
 |
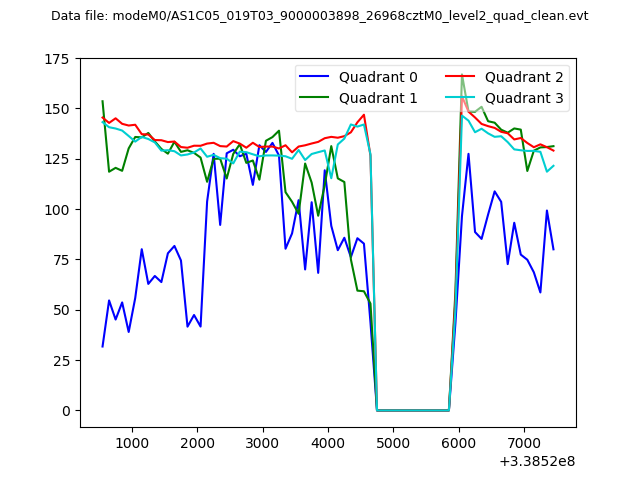
| Quadrant-wise count rates Data is divided into 100 sec bins |
 |
|
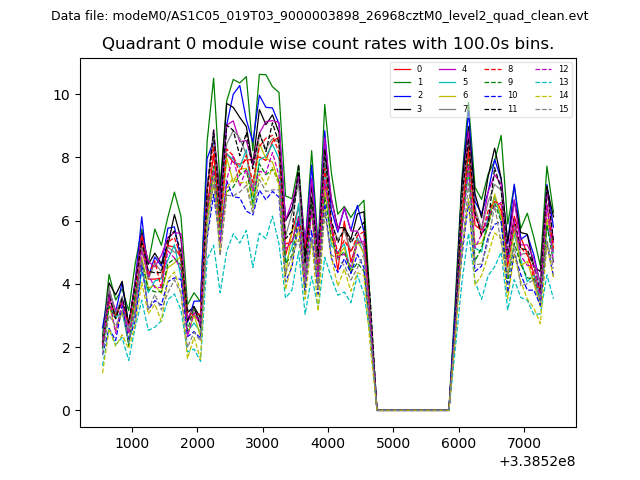
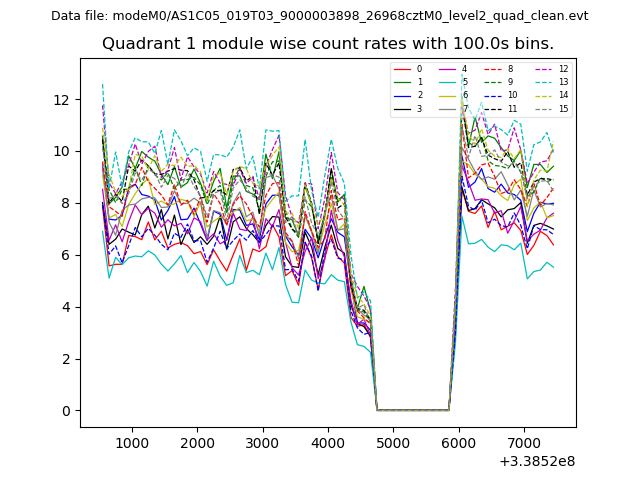
| Module-wise count rates for Quadrant A Data is divided into 100 sec bins |
 |
 |
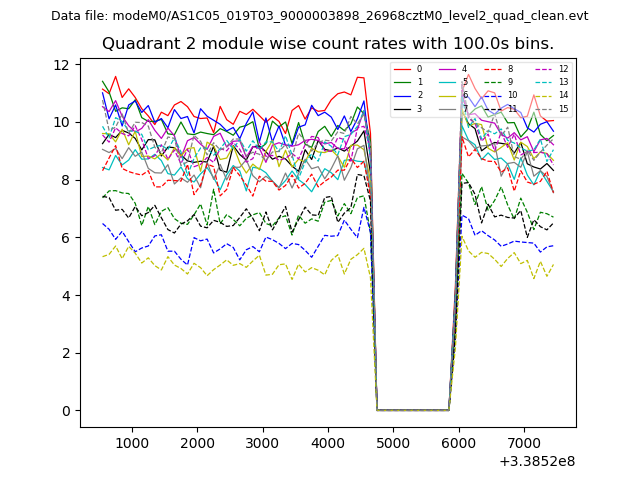
| Module-wise count rates for Quadrant B Data is divided into 100 sec bins |
 |
 |
| Module-wise count rates for Quadrant C Data is divided into 100 sec bins |
 |
 |
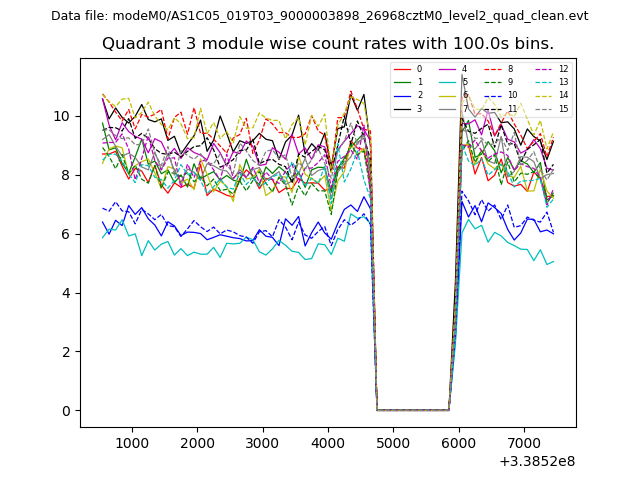
| Module-wise count rates for Quadrant D Data is divided into 100 sec bins |
 |
 |
| Parameter | Plot |
|---|---|
| CZT HV Monitor | 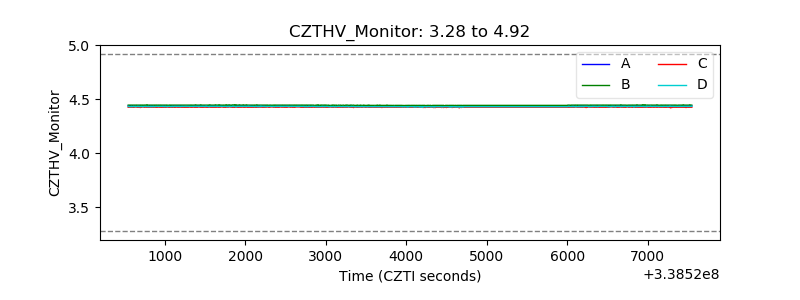 |
| D_VDD | 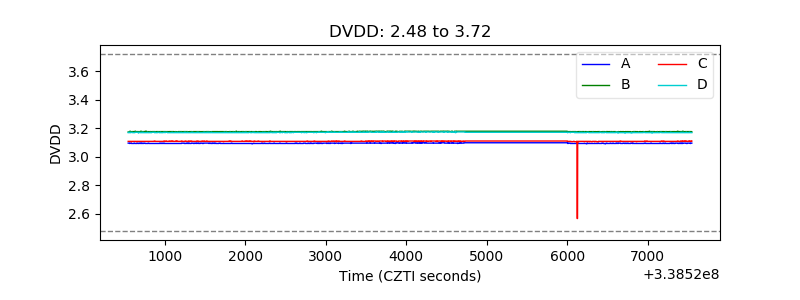 |
| Temperature 1 | 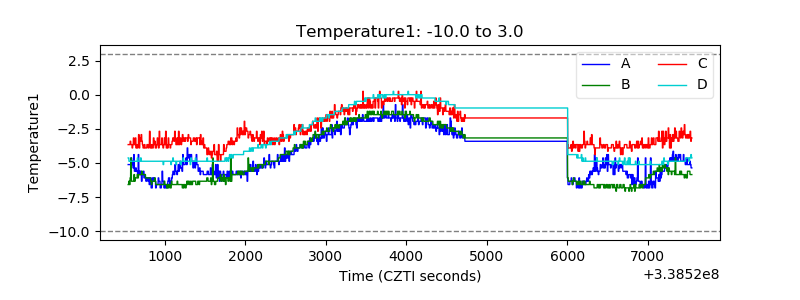 |
| Veto HV Monitor |  |
| Veto LLD | 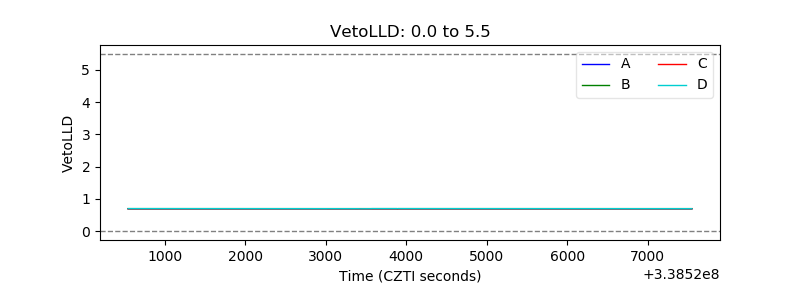 |
| Alpha Counter | 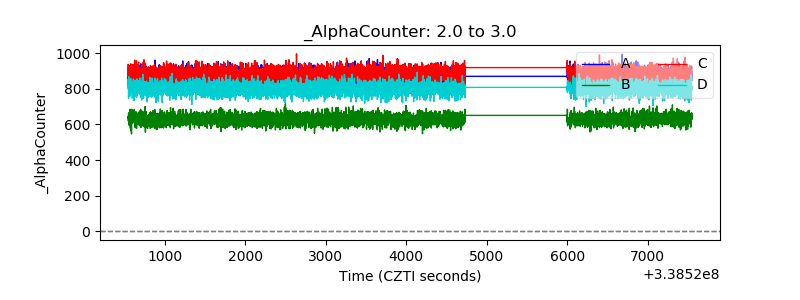 |
| _CPM_Rate | 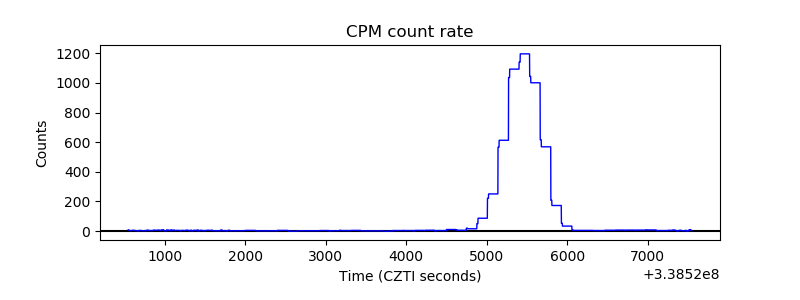 |
| CZT Counter |  |
| +2.5 Volts monitor |  |
| +5 Volts monitor | 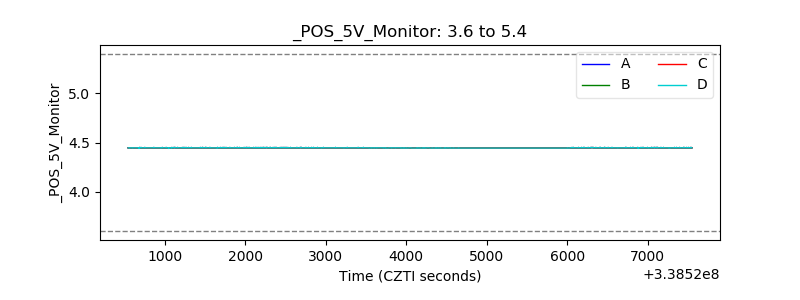 |
| _ROLL_ROT | 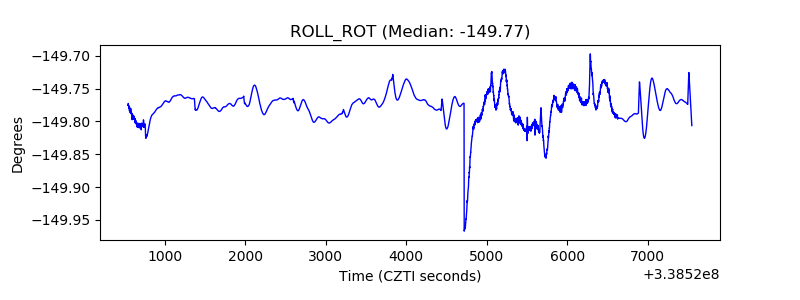 |
| _Roll_DEC | 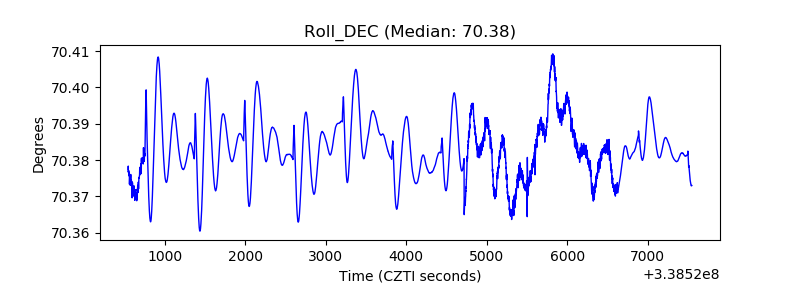 |
| _Roll_RA | 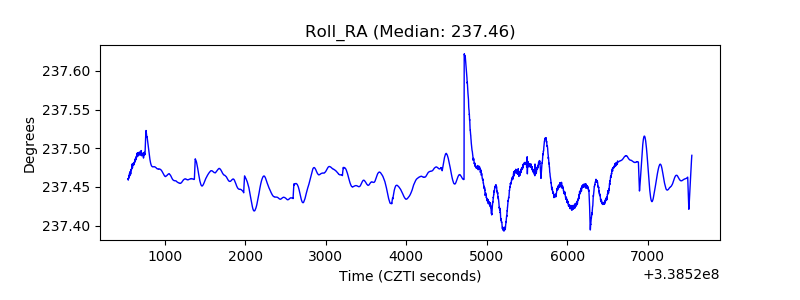 |
| Veto Counter | 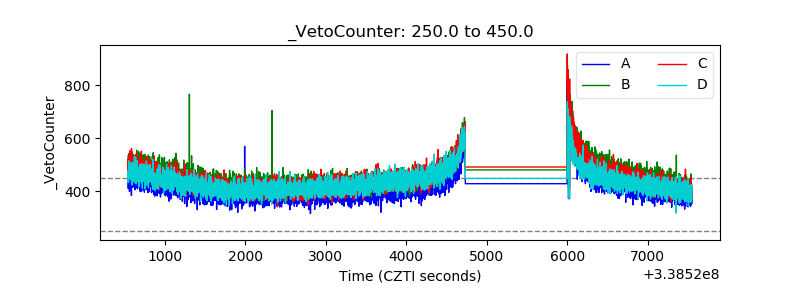 |