| Param | Original file | Final file |
|---|---|---|
| Filename | modeM0/AS1C05_019T03_9000003898_26969cztM0_level2.evt | modeM0/AS1C05_019T03_9000003898_26969cztM0_level2_quad_clean.evt |
| Size (bytes) | 2,206,419,840 | 292,469,760 |
| Size | 2.1 GB | 278.9 MB |
| Events in quadrant A | 30,215,569 | 1,328,382 |
| Events in quadrant B | 18,336,420 | 2,094,589 |
| Events in quadrant C | 7,880,198 | 2,197,625 |
| Events in quadrant D | 9,304,229 | 2,117,594 |
| Mode M0 | |||
|---|---|---|---|
| Quadrant | BADHDUFLAG | Total packets | Discarded packets |
| A | 0 | 100868 | 0 |
| B | 0 | 65258 | 0 |
| C | 0 | 33733 | 0 |
| D | 0 | 38935 | 0 |
| Mode M9 | |||
|---|---|---|---|
| Quadrant | BADHDUFLAG | Total packets | Discarded packets |
| A | 0 | 37 | 0 |
| B | 0 | 37 | 0 |
| C | 0 | 37 | 0 |
| D | 0 | 37 | 0 |
| Quadrant | Total seconds | Saturated seconds | Saturation percentage |
|---|---|---|---|
| A | 16153 | 10856 | 67.207330% |
| B | 16153 | 3635 | 22.503560% |
| C | 16153 | 246 | 1.522937% |
| D | 16154 | 396 | 2.451405% |
Noise dominated data is calculated using 1-second bins in cleaned event files. If a bin has >2000 counts, and if more than 50% of those come from <1% of pixels, then it is considered to be noise-dominated and hence unusable.
| Quadrant | # 1 sec bins | Bins with >0 counts | Bins with >2000 counts | High rate bins dominated by noise | Noise dominated (total time) | Noise dominated (detector-on time) | Marked lightcurve |
|---|---|---|---|---|---|---|---|
| A | 19793 | 16153 | 9045 | 9045 | 45.70% | 56.00% | 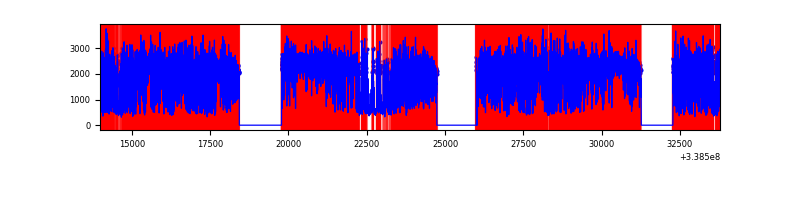 |
| B | 19793 | 16155 | 2935 | 2935 | 14.83% | 18.17% | 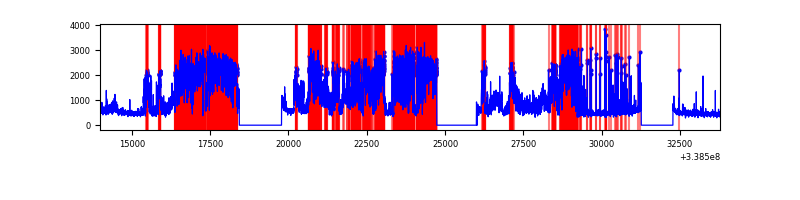 |
| C | 19793 | 16156 | 11 | 11 | 0.06% | 0.07% | 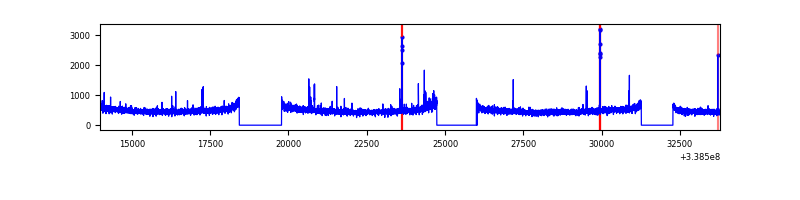 |
| D | 19794 | 16157 | 231 | 231 | 1.17% | 1.43% | 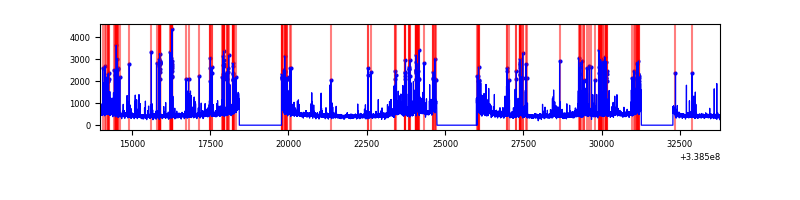 |
Top three noisy pixels from each quadrant. If the there are fewer than three noisy pixels in the level2.evt file, extra rows are filled as -1
| Pixel properties | Quadrant properties | ||||||
|---|---|---|---|---|---|---|---|
| Quadrant | DetID | PixID | Counts | Sigma | Mean | Median | Sigma |
| A | 14 | 235 | 21639454 | 87145.36 | 1268 | 1247 | 248.3 |
| A | 6 | 16 | 3316650 | 13352.4 | 1268 | 1247 | 248.3 |
| A | 0 | 13 | 332300 | 1333.28 | 1268 | 1247 | 248.3 |
| B | 0 | 189 | 10872938 | 32107.01 | 1857 | 1813 | 338.6 |
| B | 5 | 172 | 73674 | 212.24 | 1857 | 1813 | 338.6 |
| B | 0 | 230 | 57198 | 163.58 | 1857 | 1813 | 338.6 |
| C | 14 | 238 | 311733 | 711.16 | 1903 | 1916 | 435.6 |
| C | 15 | 208 | 90932 | 204.33 | 1903 | 1916 | 435.6 |
| C | 2 | 16 | 35042 | 76.04 | 1903 | 1916 | 435.6 |
| D | 1 | 52 | 1068748 | 2380.34 | 1902 | 1851 | 448.2 |
| D | 2 | 250 | 590395 | 1313.09 | 1902 | 1851 | 448.2 |
| D | 12 | 1 | 203865 | 450.71 | 1902 | 1851 | 448.2 |
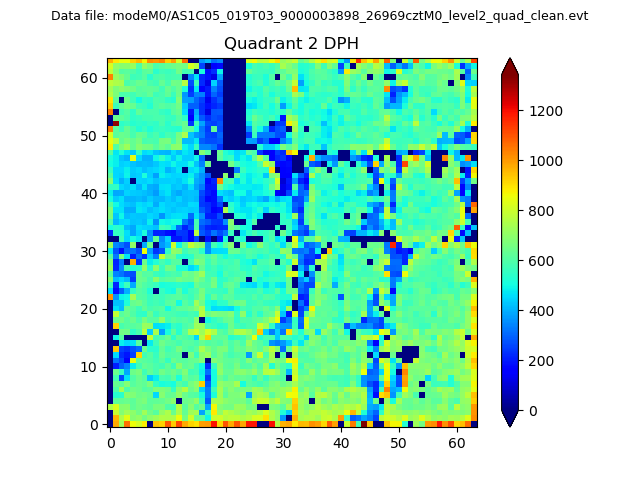
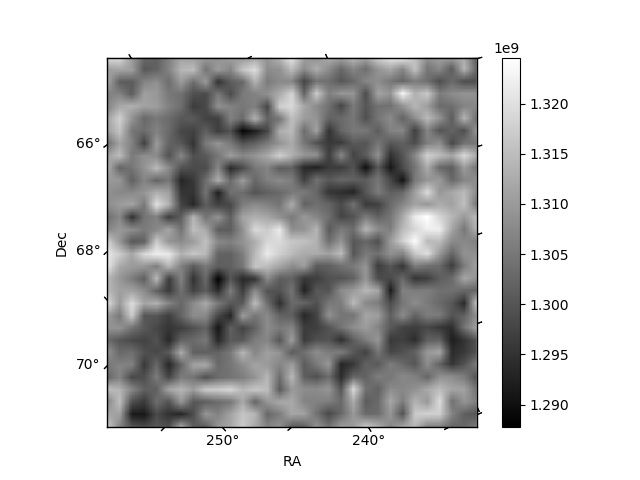
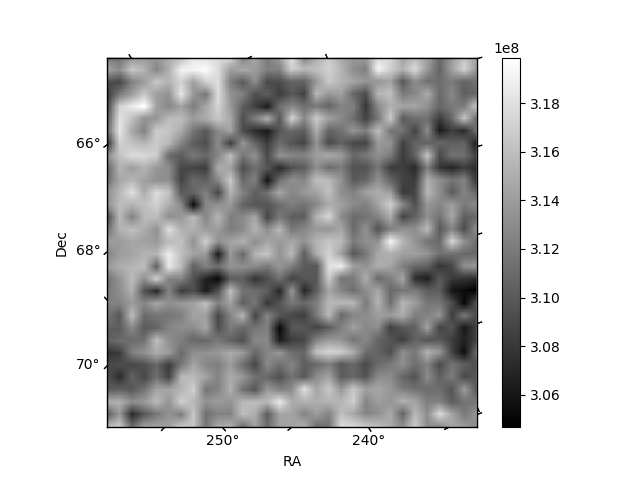
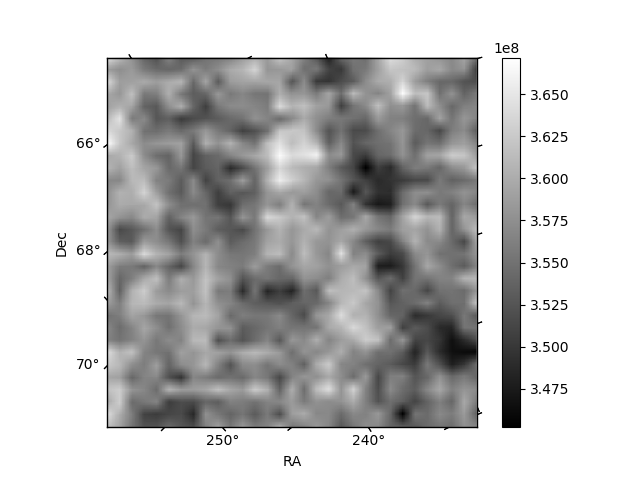
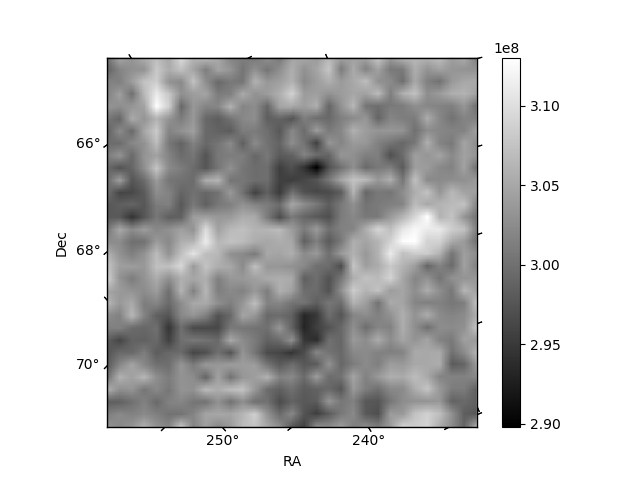
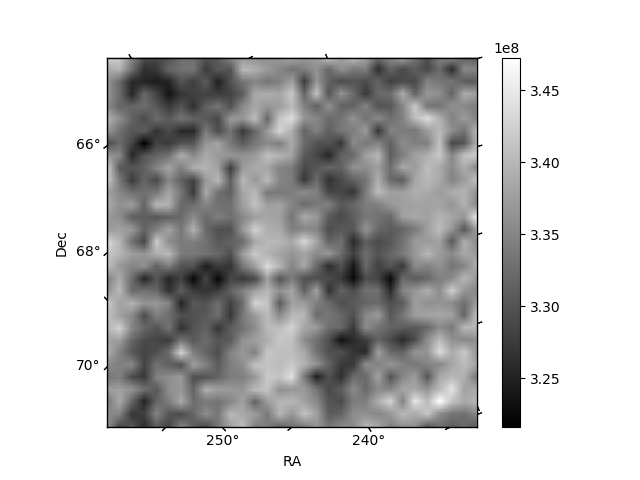
Histogram calculated using DETX and DETY for each event in the final _common_clean file
| Quadrant A | 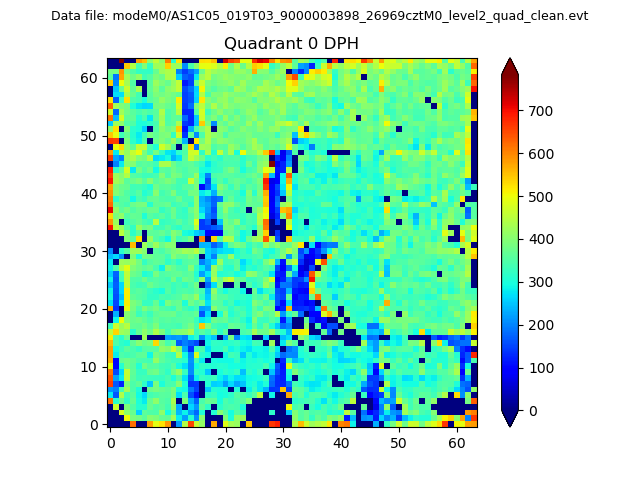 |
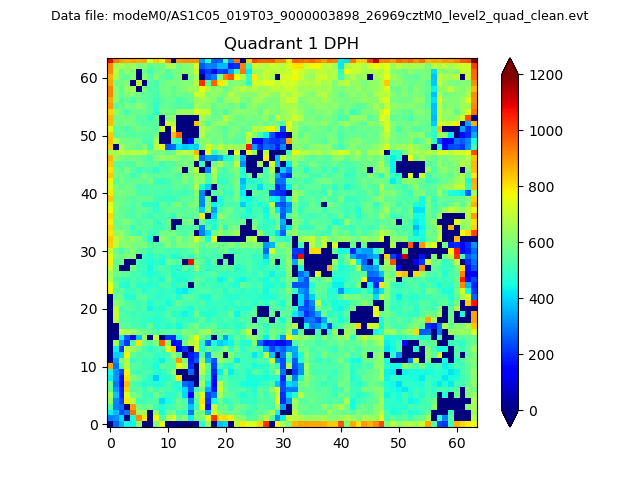 |
Quadrant B |
|---|---|---|---|
| Quadrant D | 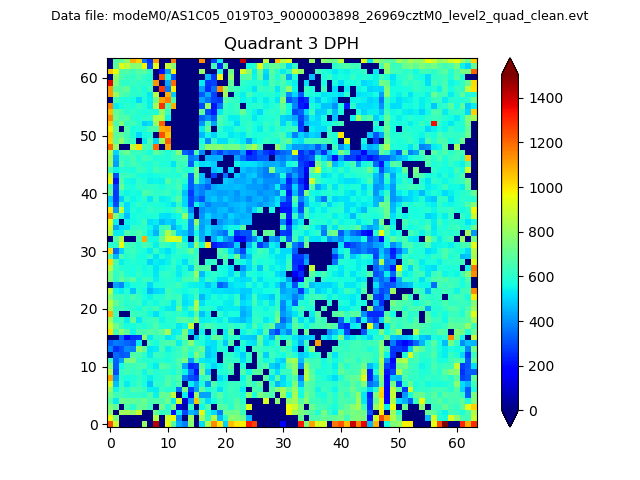 |
 |
Quadrant C |
| Plot type | Count rate plots | Images |
|---|---|---|
| Comparison with Poisson distribution Blue bars denote a histogram of data divided into 1 sec bins. Red curve is a Poisson curve with rate = median count rate of data. |
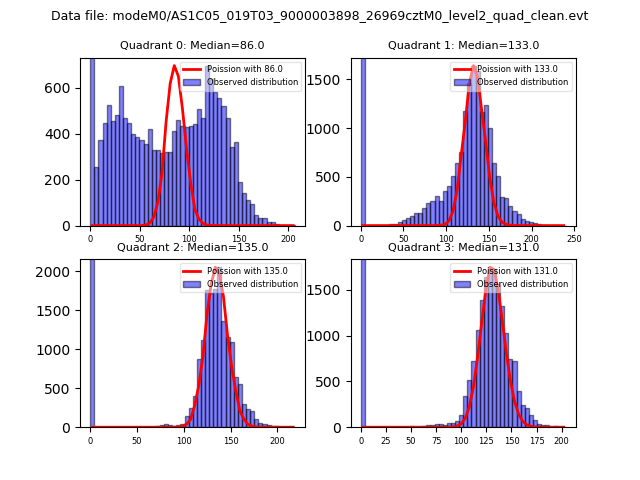 |
 |
| Quadrant-wise count rates Data is divided into 100 sec bins |
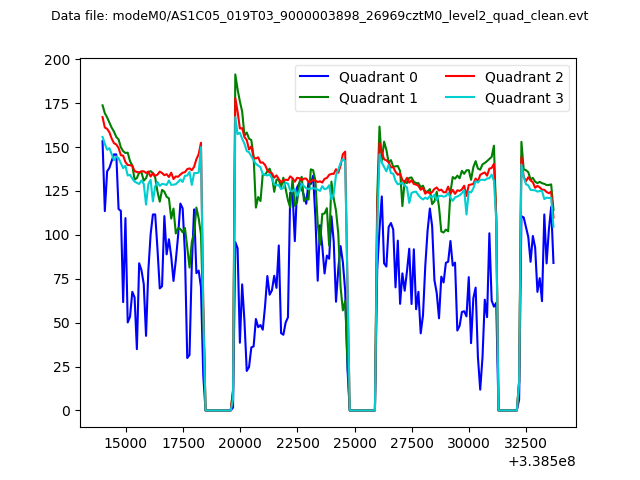 |
|
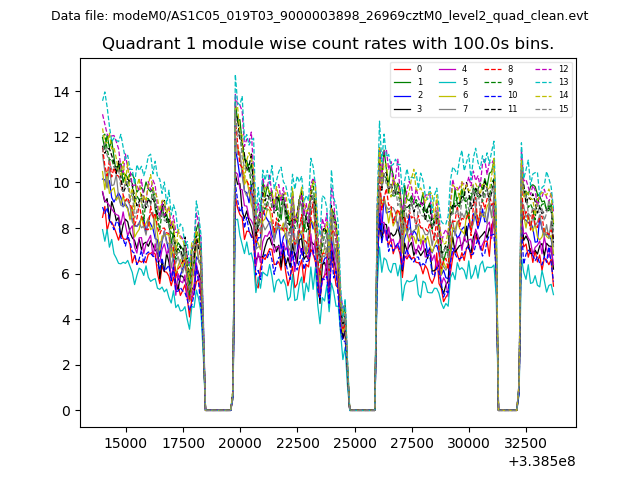
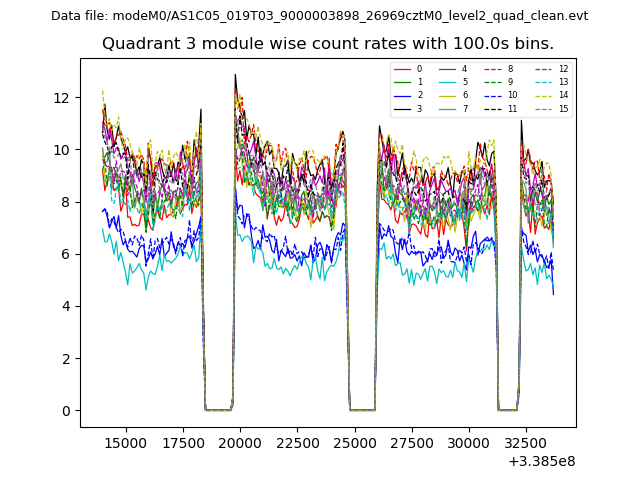
| Module-wise count rates for Quadrant A Data is divided into 100 sec bins |
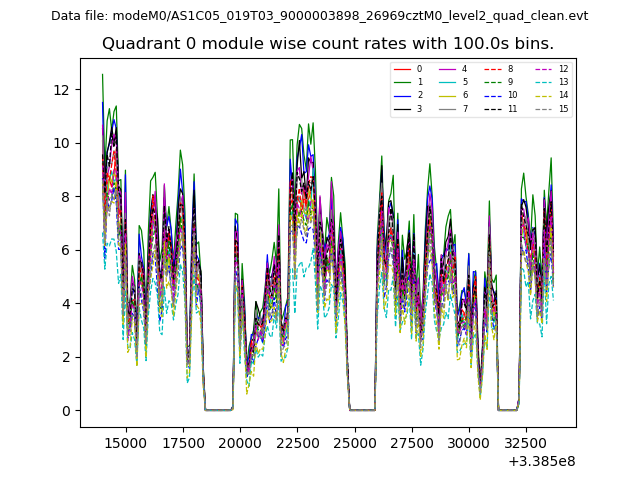 |
 |
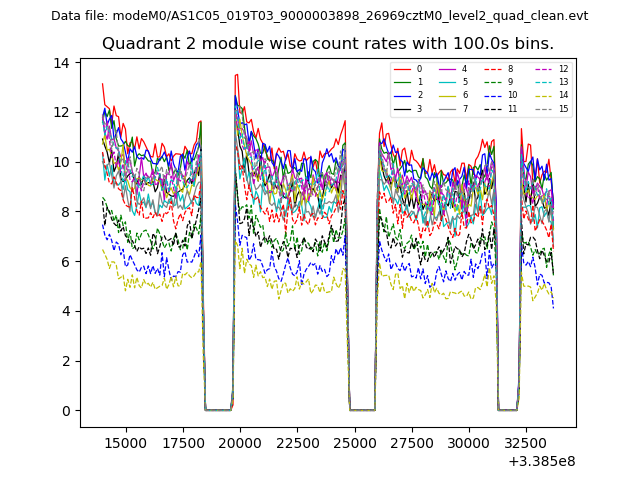
| Module-wise count rates for Quadrant B Data is divided into 100 sec bins |
 |
 |
| Module-wise count rates for Quadrant C Data is divided into 100 sec bins |
 |
 |
| Module-wise count rates for Quadrant D Data is divided into 100 sec bins |
 |
 |
| Parameter | Plot |
|---|---|
| CZT HV Monitor | 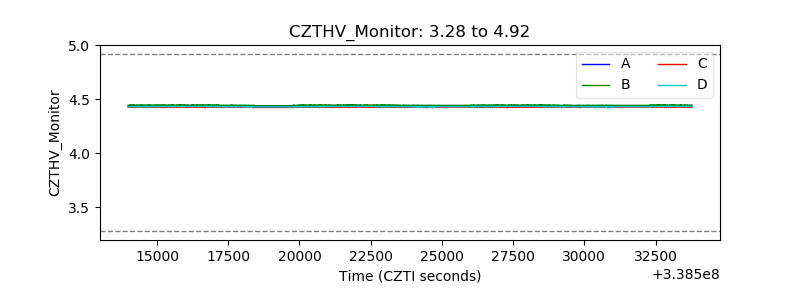 |
| D_VDD | 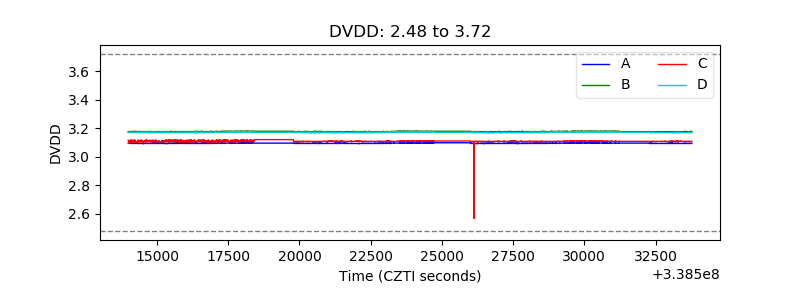 |
| Temperature 1 | 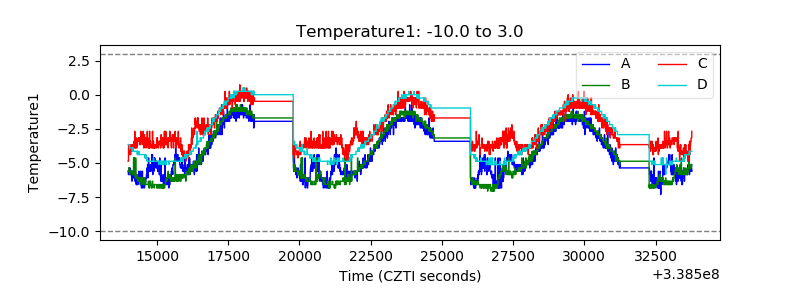 |
| Veto HV Monitor | 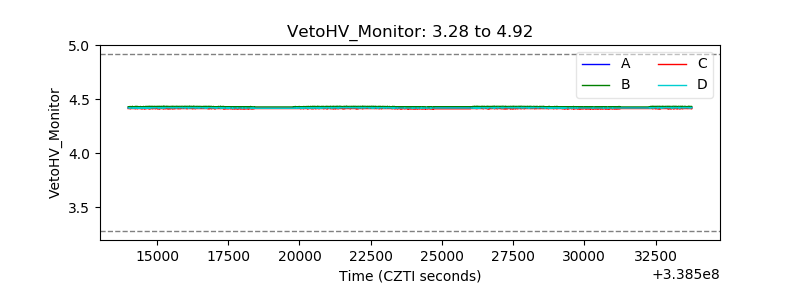 |
| Veto LLD | 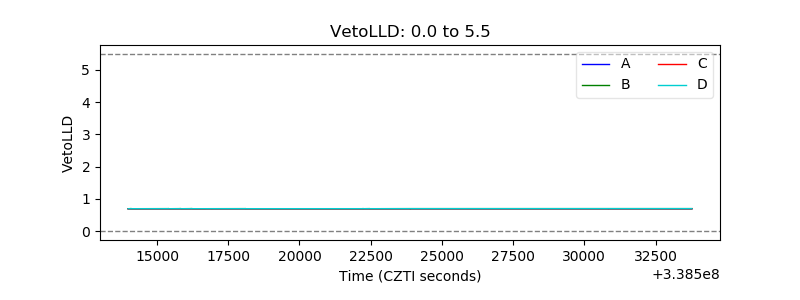 |
| Alpha Counter | 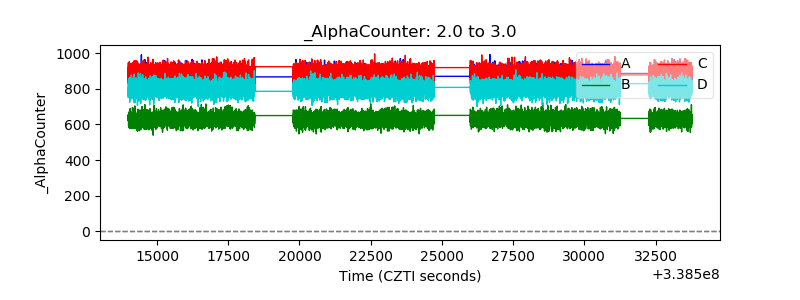 |
| _CPM_Rate | 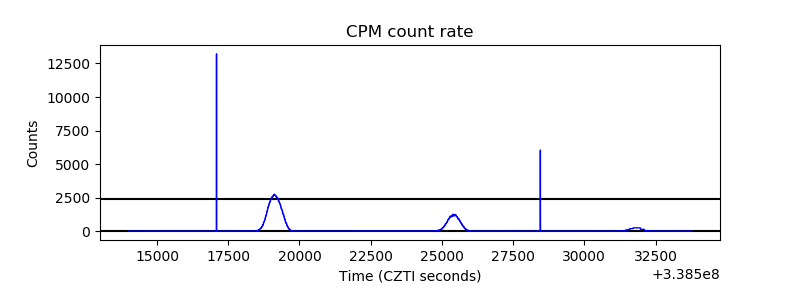 |
| CZT Counter | 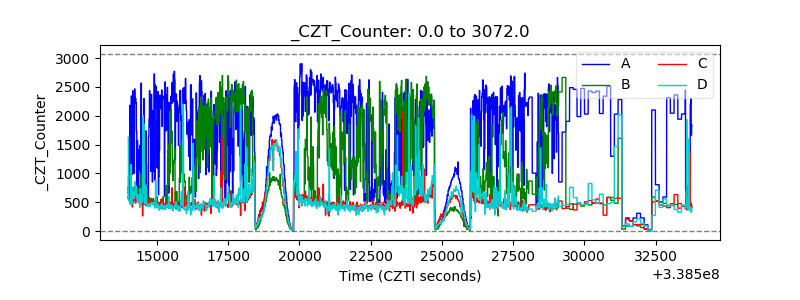 |
| +2.5 Volts monitor | 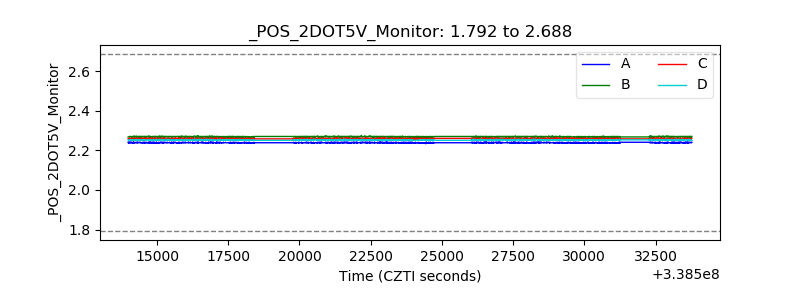 |
| +5 Volts monitor |  |
| _ROLL_ROT | 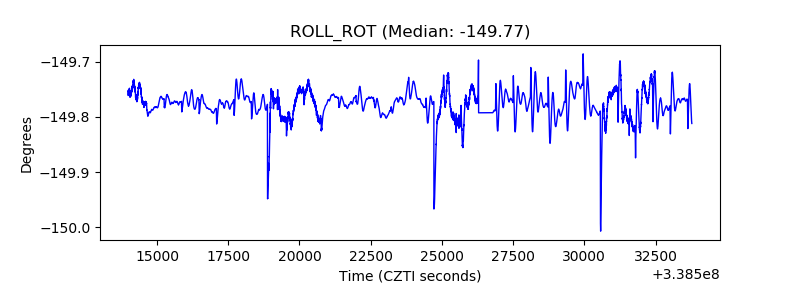 |
| _Roll_DEC | 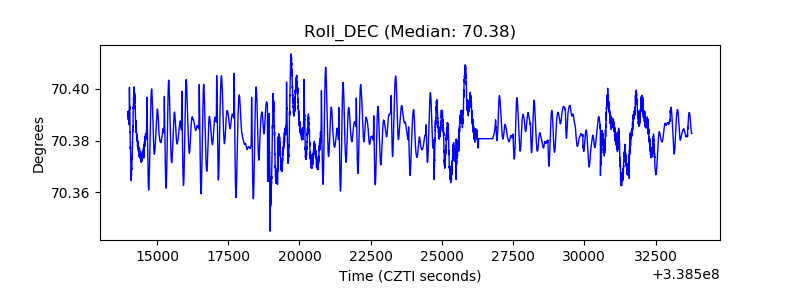 |
| _Roll_RA | 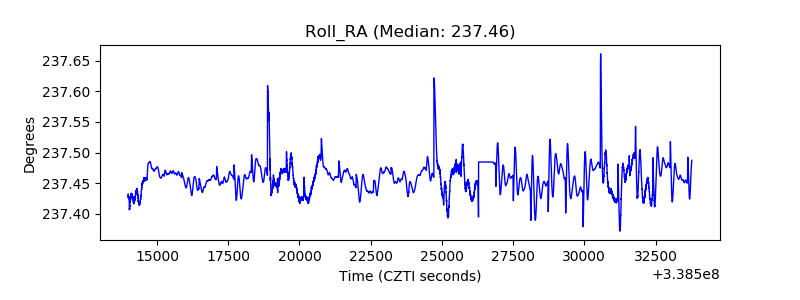 |
| Veto Counter |  |