| Param | Original file | Final file |
|---|---|---|
| Filename | modeM0/AS1C05_019T03_9000003898_26970cztM0_level2.evt | modeM0/AS1C05_019T03_9000003898_26970cztM0_level2_quad_clean.evt |
| Size (bytes) | 717,491,520 | 118,353,600 |
| Size | 684.3 MB | 112.9 MB |
| Events in quadrant A | 11,137,731 | 603,418 |
| Events in quadrant B | 3,303,087 | 865,701 |
| Events in quadrant C | 3,080,966 | 837,842 |
| Events in quadrant D | 3,756,083 | 811,526 |
| Mode M0 | |||
|---|---|---|---|
| Quadrant | BADHDUFLAG | Total packets | Discarded packets |
| A | 0 | 37705 | 0 |
| B | 0 | 14154 | 0 |
| C | 0 | 13566 | 0 |
| D | 0 | 15904 | 0 |
| Mode M9 | |||
|---|---|---|---|
| Quadrant | BADHDUFLAG | Total packets | Discarded packets |
| A | 0 | 7 | 0 |
| B | 0 | 7 | 0 |
| C | 0 | 7 | 0 |
| D | 0 | 7 | 0 |
| Quadrant | Total seconds | Saturated seconds | Saturation percentage |
|---|---|---|---|
| A | 6664 | 3663 | 54.966987% |
| B | 6664 | 117 | 1.755702% |
| C | 6665 | 34 | 0.510128% |
| D | 6665 | 99 | 1.485371% |
Noise dominated data is calculated using 1-second bins in cleaned event files. If a bin has >2000 counts, and if more than 50% of those come from <1% of pixels, then it is considered to be noise-dominated and hence unusable.
| Quadrant | # 1 sec bins | Bins with >0 counts | Bins with >2000 counts | High rate bins dominated by noise | Noise dominated (total time) | Noise dominated (detector-on time) | Marked lightcurve |
|---|---|---|---|---|---|---|---|
| A | 7279 | 6664 | 2853 | 2853 | 39.19% | 42.81% | 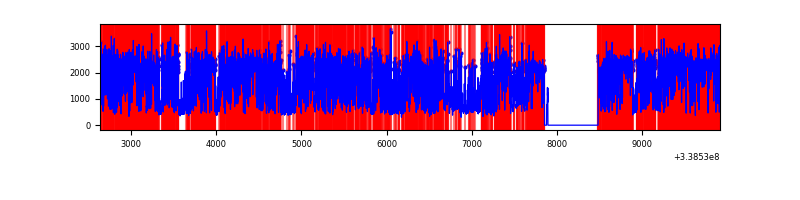 |
| B | 7279 | 6666 | 65 | 65 | 0.89% | 0.98% | 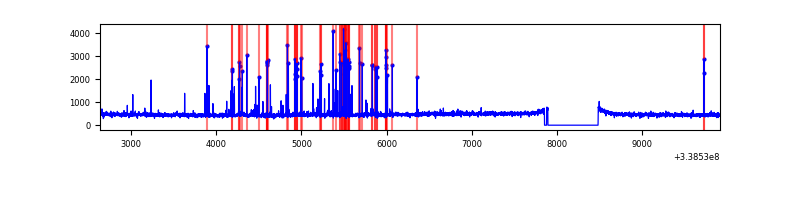 |
| C | 7280 | 6667 | 1 | 1 | 0.01% | 0.01% | 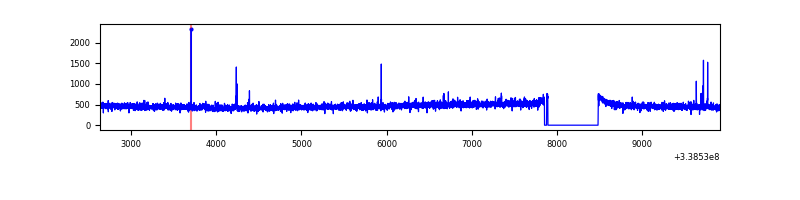 |
| D | 7280 | 6667 | 75 | 75 | 1.03% | 1.12% | 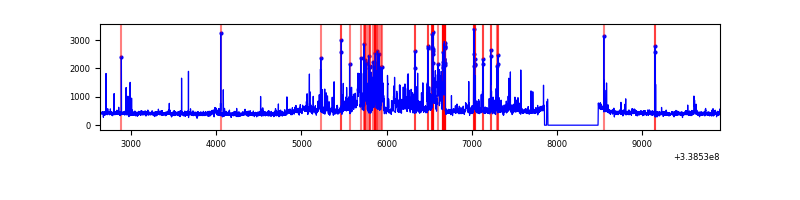 |
Top three noisy pixels from each quadrant. If the there are fewer than three noisy pixels in the level2.evt file, extra rows are filled as -1
| Pixel properties | Quadrant properties | ||||||
|---|---|---|---|---|---|---|---|
| Quadrant | DetID | PixID | Counts | Sigma | Mean | Median | Sigma |
| A | 14 | 235 | 8803322 | 75746.05 | 581 | 570 | 116.2 |
| A | 6 | 16 | 52389 | 445.89 | 581 | 570 | 116.2 |
| A | 0 | 13 | 24116 | 202.61 | 581 | 570 | 116.2 |
| B | 0 | 189 | 208686 | 1412.06 | 775 | 756 | 147.3 |
| B | 0 | 230 | 25893 | 170.71 | 775 | 756 | 147.3 |
| B | 0 | 219 | 19896 | 129.98 | 775 | 756 | 147.3 |
| C | 14 | 238 | 122256 | 695.89 | 749 | 751 | 174.6 |
| C | 15 | 208 | 22307 | 123.46 | 749 | 751 | 174.6 |
| C | 2 | 16 | 13047 | 70.42 | 749 | 751 | 174.6 |
| D | 11 | 176 | 367936 | 2053.2 | 752 | 730 | 178.8 |
| D | 1 | 52 | 246643 | 1375.0 | 752 | 730 | 178.8 |
| D | 2 | 250 | 218805 | 1219.35 | 752 | 730 | 178.8 |
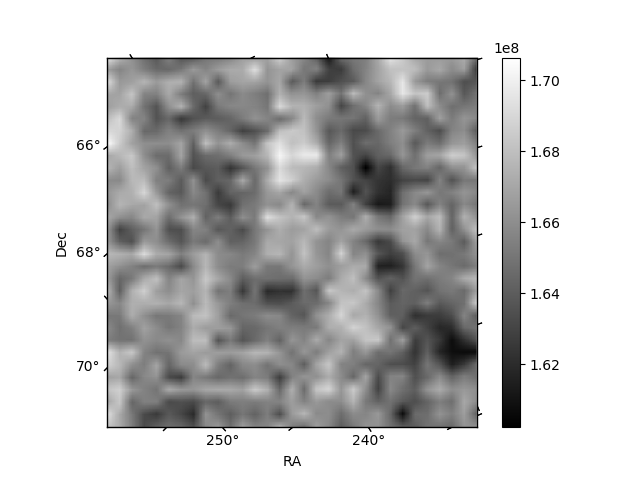
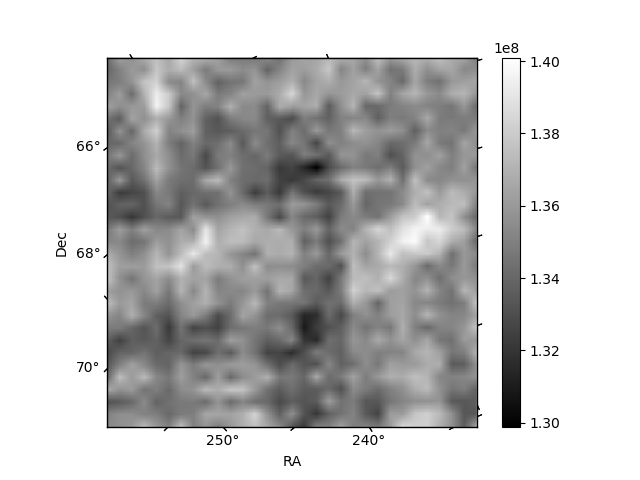
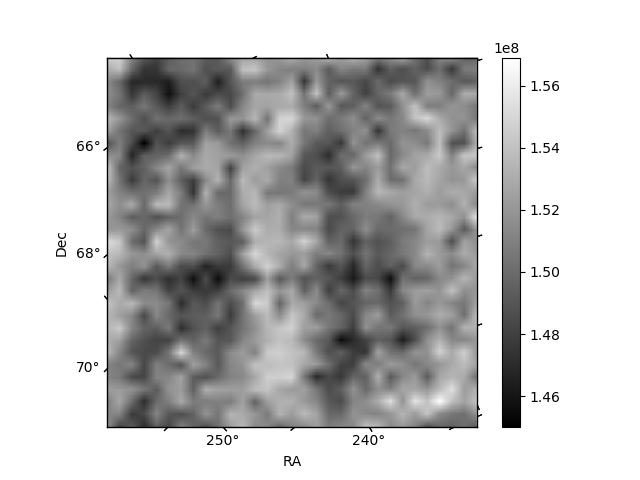
Histogram calculated using DETX and DETY for each event in the final _common_clean file
| Quadrant A | 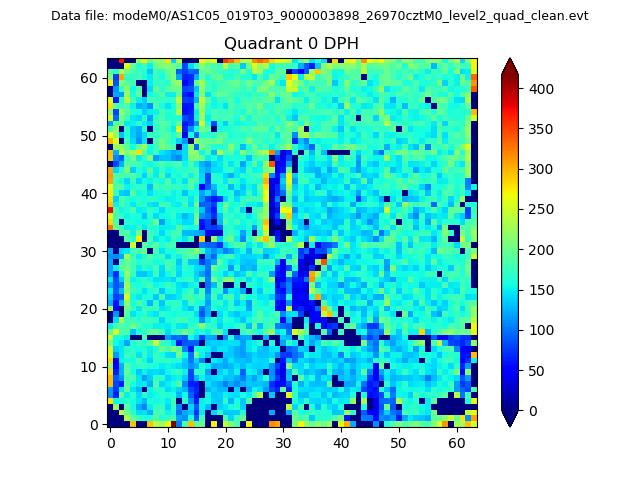 |
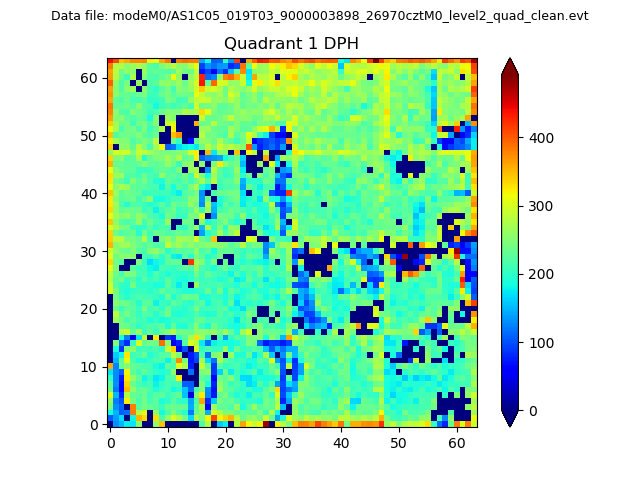 |
Quadrant B |
|---|---|---|---|
| Quadrant D | 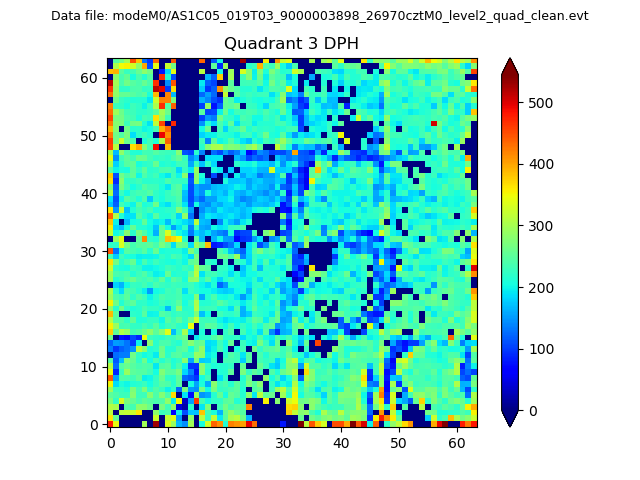 |
 |
Quadrant C |
| Plot type | Count rate plots | Images |
|---|---|---|
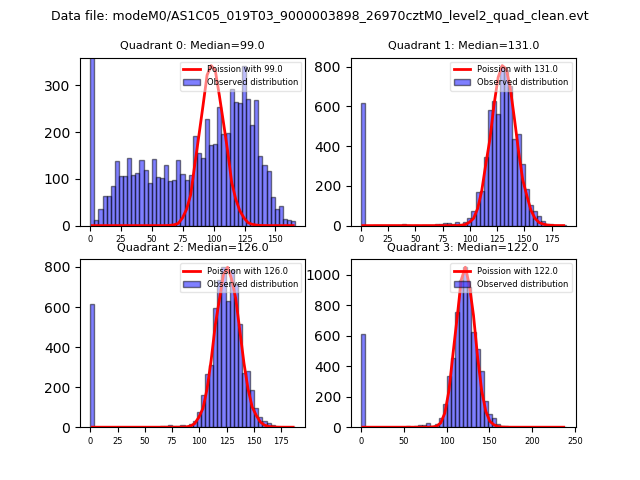
| Comparison with Poisson distribution Blue bars denote a histogram of data divided into 1 sec bins. Red curve is a Poisson curve with rate = median count rate of data. |
 |
 |
| Quadrant-wise count rates Data is divided into 100 sec bins |
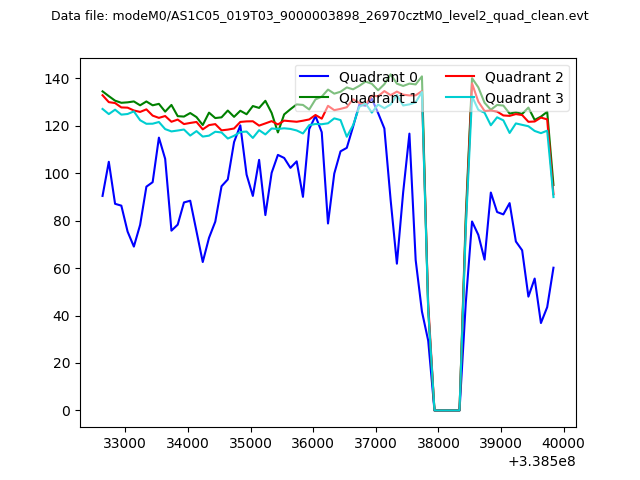 |
|
| Module-wise count rates for Quadrant A Data is divided into 100 sec bins |
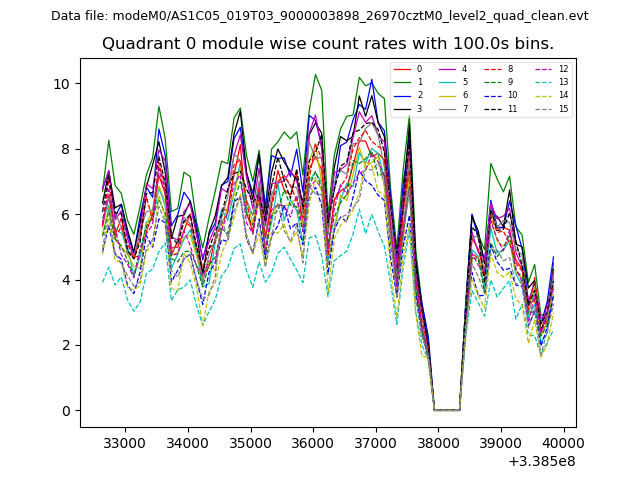 |
 |
| Module-wise count rates for Quadrant B Data is divided into 100 sec bins |
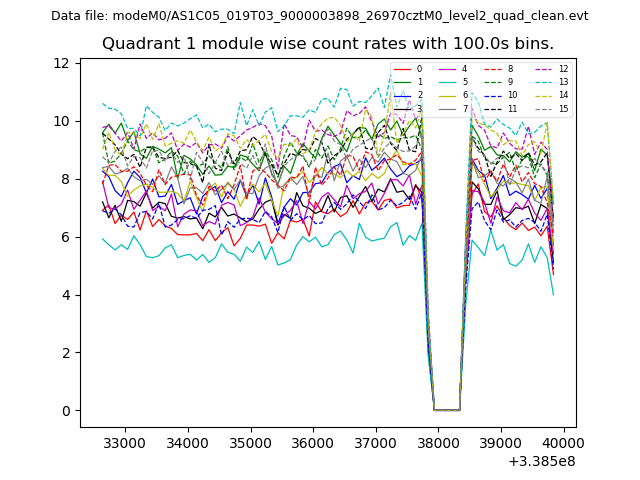 |
 |
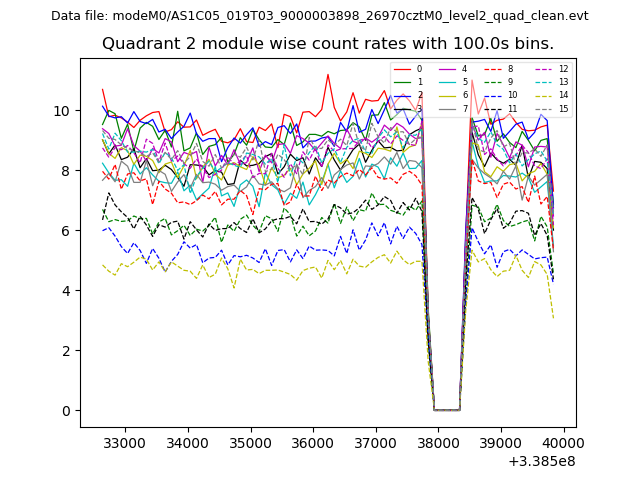
| Module-wise count rates for Quadrant C Data is divided into 100 sec bins |
 |
 |
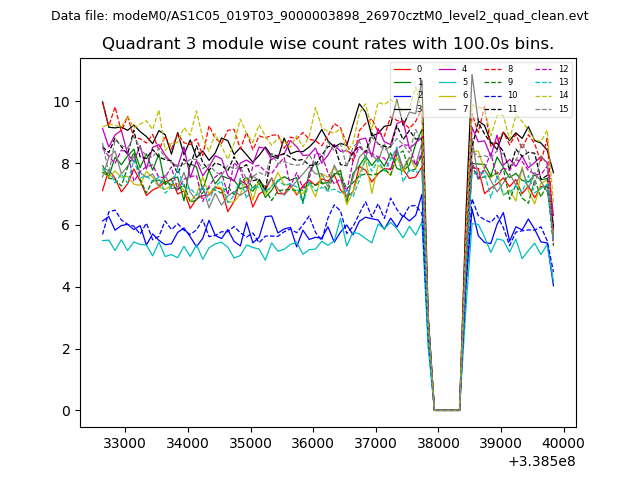
| Module-wise count rates for Quadrant D Data is divided into 100 sec bins |
 |
 |
| Parameter | Plot |
|---|---|
| CZT HV Monitor | 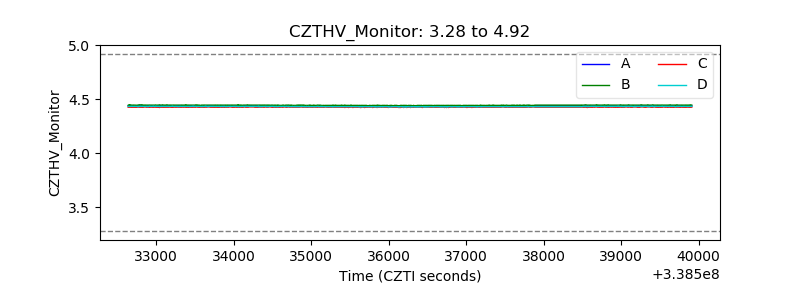 |
| D_VDD | 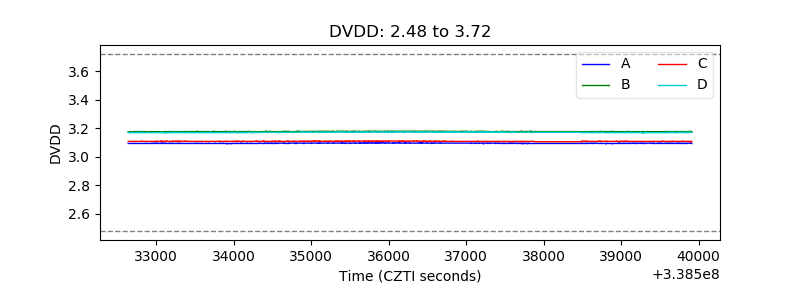 |
| Temperature 1 | 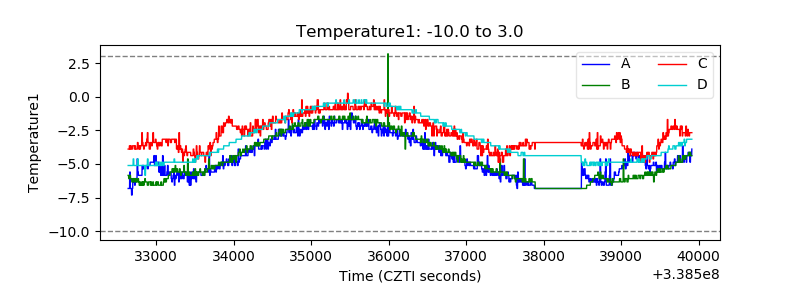 |
| Veto HV Monitor | 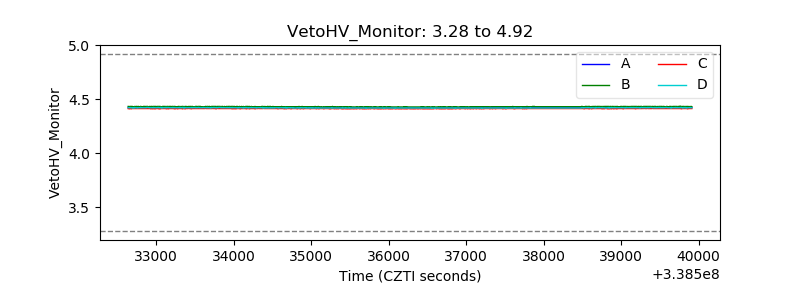 |
| Veto LLD | 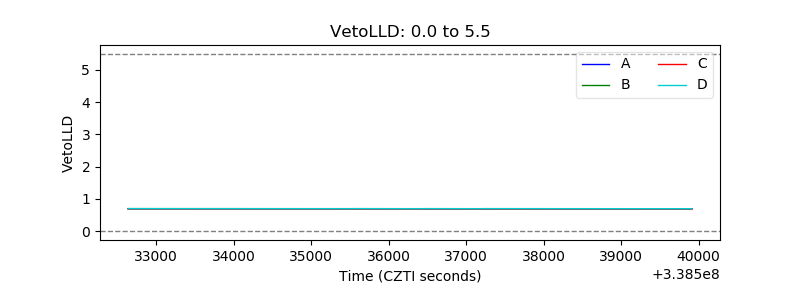 |
| Alpha Counter | 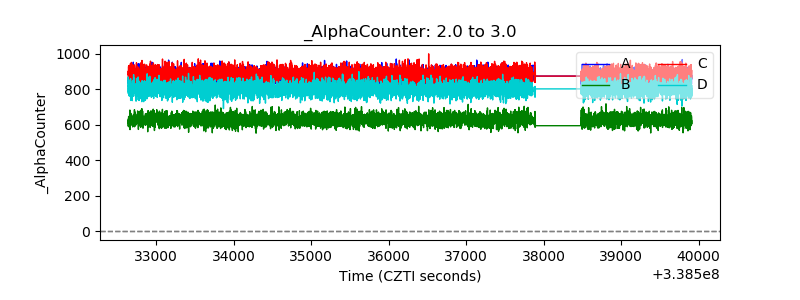 |
| _CPM_Rate | 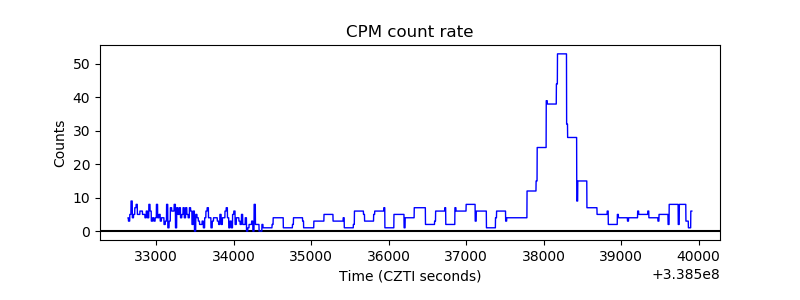 |
| CZT Counter | 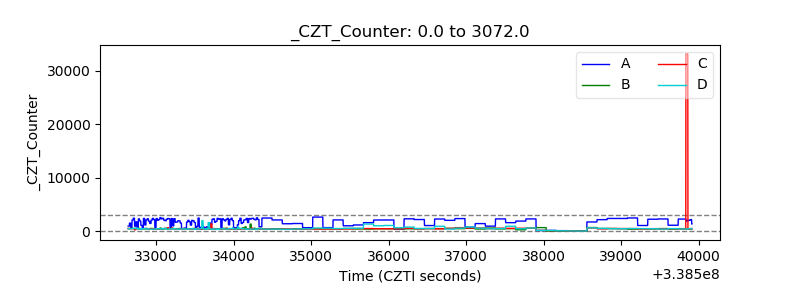 |
| +2.5 Volts monitor |  |
| +5 Volts monitor |  |
| _ROLL_ROT | 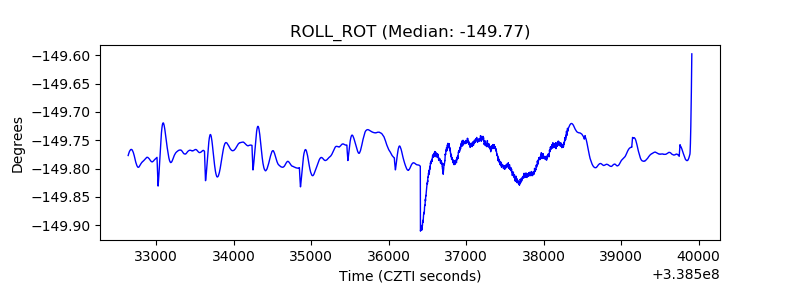 |
| _Roll_DEC | 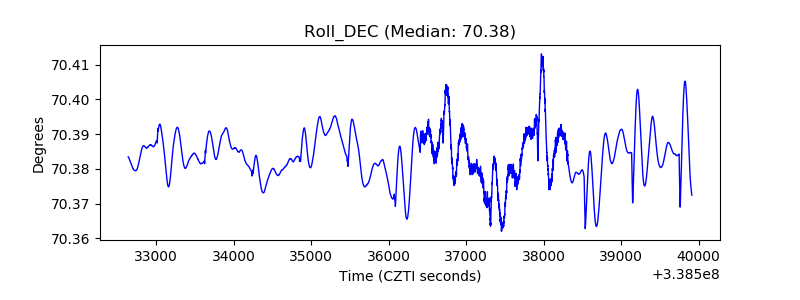 |
| _Roll_RA |  |
| Veto Counter | 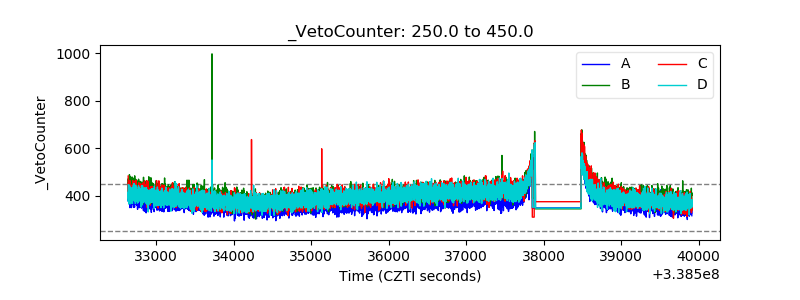 |