| Param | Original file | Final file |
|---|---|---|
| Filename | modeM0/AS1C05_019T03_9000003898_26971cztM0_level2.evt | modeM0/AS1C05_019T03_9000003898_26971cztM0_level2_quad_clean.evt |
| Size (bytes) | 772,761,600 | 117,774,720 |
| Size | 737.0 MB | 112.3 MB |
| Events in quadrant A | 12,327,339 | 533,243 |
| Events in quadrant B | 3,259,099 | 882,919 |
| Events in quadrant C | 3,233,042 | 849,003 |
| Events in quadrant D | 4,117,665 | 820,625 |
| Mode M0 | |||
|---|---|---|---|
| Quadrant | BADHDUFLAG | Total packets | Discarded packets |
| A | 0 | 41370 | 0 |
| B | 0 | 14244 | 0 |
| C | 0 | 14248 | 0 |
| D | 0 | 17052 | 0 |
| Mode M9 | |||
|---|---|---|---|
| Quadrant | BADHDUFLAG | Total packets | Discarded packets |
| A | 0 | 2 | 0 |
| B | 0 | 2 | 0 |
| C | 0 | 2 | 0 |
| D | 0 | 2 | 0 |
| Quadrant | Total seconds | Saturated seconds | Saturation percentage |
|---|---|---|---|
| A | 6871 | 4433 | 64.517537% |
| B | 6871 | 159 | 2.314074% |
| C | 6871 | 147 | 2.139427% |
| D | 6871 | 298 | 4.337069% |
Noise dominated data is calculated using 1-second bins in cleaned event files. If a bin has >2000 counts, and if more than 50% of those come from <1% of pixels, then it is considered to be noise-dominated and hence unusable.
| Quadrant | # 1 sec bins | Bins with >0 counts | Bins with >2000 counts | High rate bins dominated by noise | Noise dominated (total time) | Noise dominated (detector-on time) | Marked lightcurve |
|---|---|---|---|---|---|---|---|
| A | 7035 | 6870 | 3551 | 3551 | 50.48% | 51.69% | 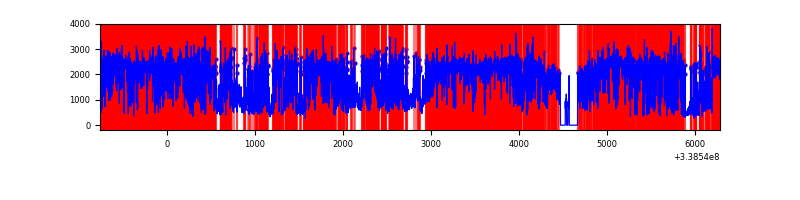 |
| B | 7036 | 6873 | 6 | 6 | 0.09% | 0.09% | 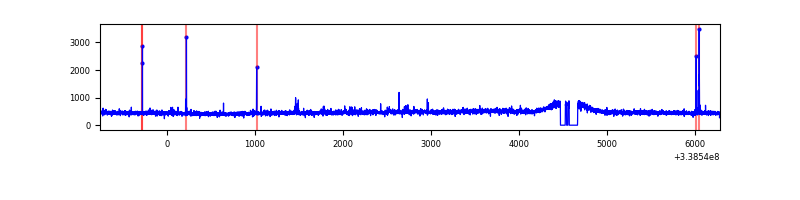 |
| C | 7036 | 6872 | 2 | 2 | 0.03% | 0.03% | 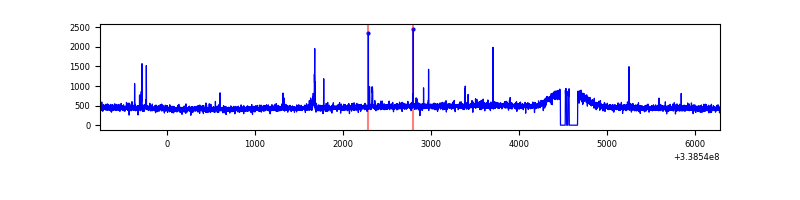 |
| D | 7036 | 6872 | 153 | 153 | 2.17% | 2.23% | 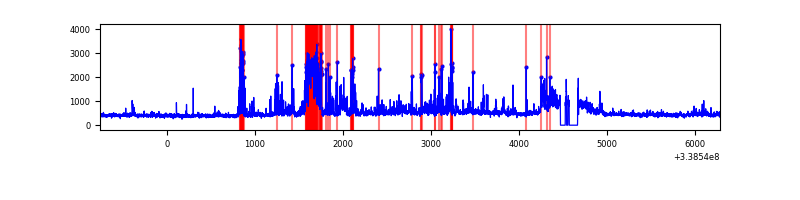 |
Top three noisy pixels from each quadrant. If the there are fewer than three noisy pixels in the level2.evt file, extra rows are filled as -1
| Pixel properties | Quadrant properties | ||||||
|---|---|---|---|---|---|---|---|
| Quadrant | DetID | PixID | Counts | Sigma | Mean | Median | Sigma |
| A | 14 | 235 | 9973425 | 90697.12 | 542 | 530 | 110.0 |
| A | 6 | 16 | 204639 | 1856.24 | 542 | 530 | 110.0 |
| A | 0 | 13 | 44925 | 403.74 | 542 | 530 | 110.0 |
| B | 0 | 230 | 30036 | 187.66 | 815 | 793 | 155.8 |
| B | 12 | 111 | 19219 | 118.25 | 815 | 793 | 155.8 |
| B | 11 | 111 | 17145 | 104.94 | 815 | 793 | 155.8 |
| C | 14 | 238 | 125791 | 676.05 | 784 | 786 | 184.9 |
| C | 2 | 16 | 30433 | 160.34 | 784 | 786 | 184.9 |
| C | 15 | 208 | 23266 | 121.58 | 784 | 786 | 184.9 |
| D | 2 | 250 | 336612 | 1794.77 | 787 | 763 | 187.1 |
| D | 12 | 1 | 289059 | 1540.64 | 787 | 763 | 187.1 |
| D | 11 | 176 | 221126 | 1177.61 | 787 | 763 | 187.1 |
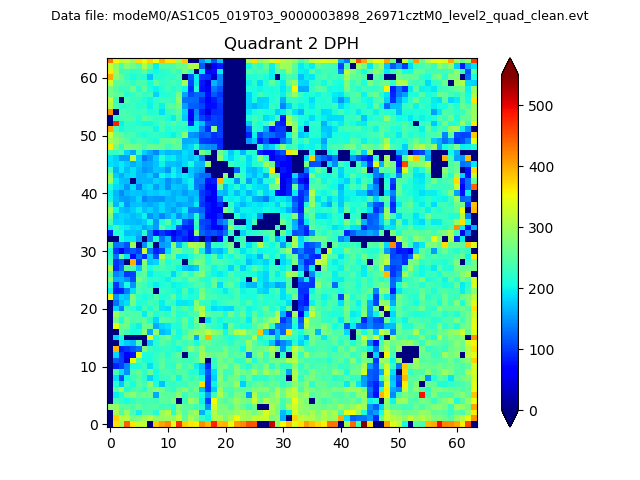
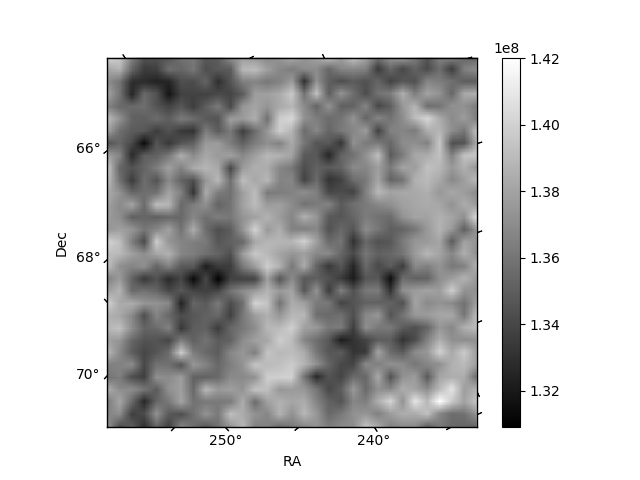
Histogram calculated using DETX and DETY for each event in the final _common_clean file
| Quadrant A | 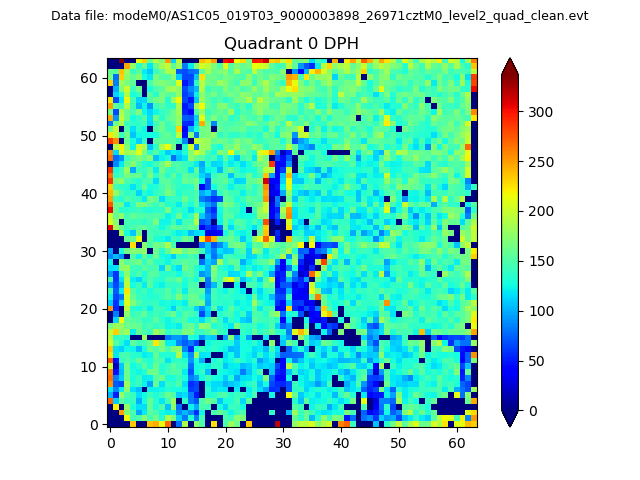 |
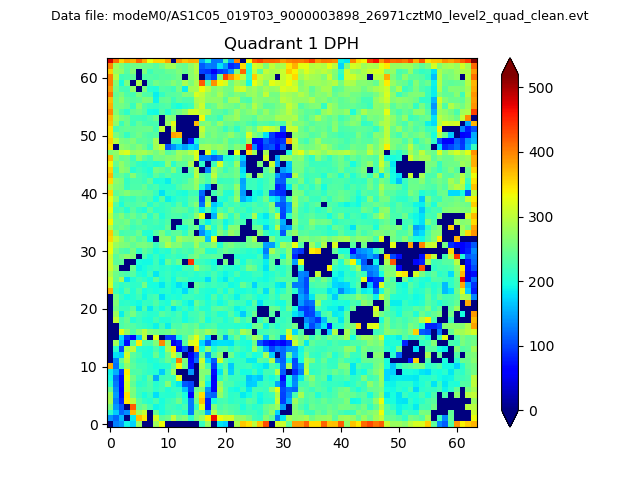 |
Quadrant B |
|---|---|---|---|
| Quadrant D | 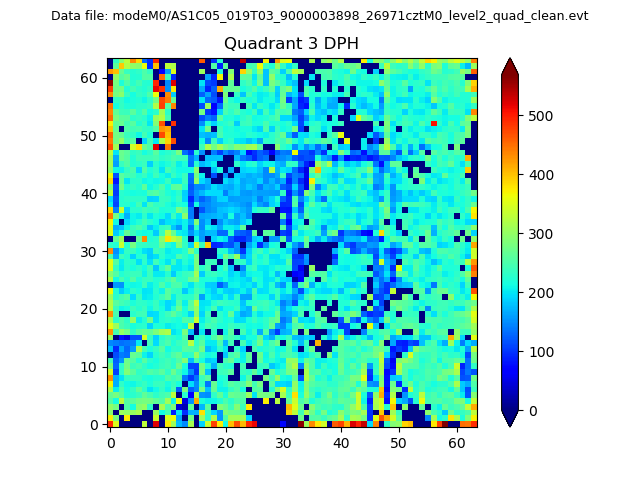 |
 |
Quadrant C |
| Plot type | Count rate plots | Images |
|---|---|---|
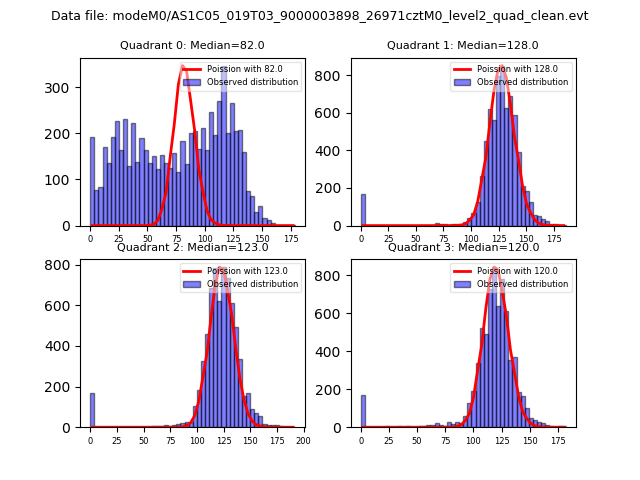
| Comparison with Poisson distribution Blue bars denote a histogram of data divided into 1 sec bins. Red curve is a Poisson curve with rate = median count rate of data. |
 |
 |
| Quadrant-wise count rates Data is divided into 100 sec bins |
 |
|
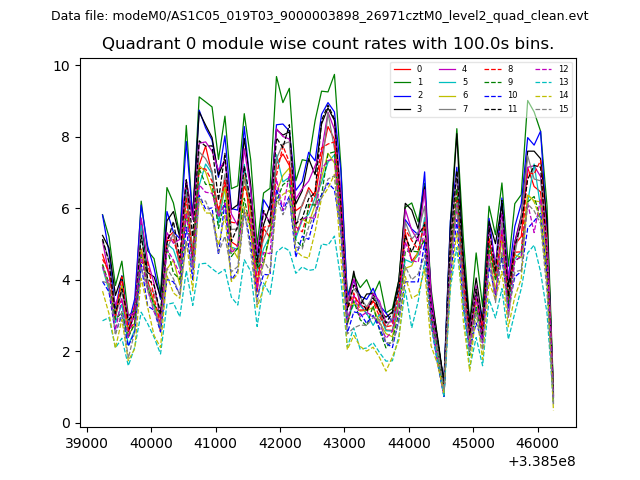
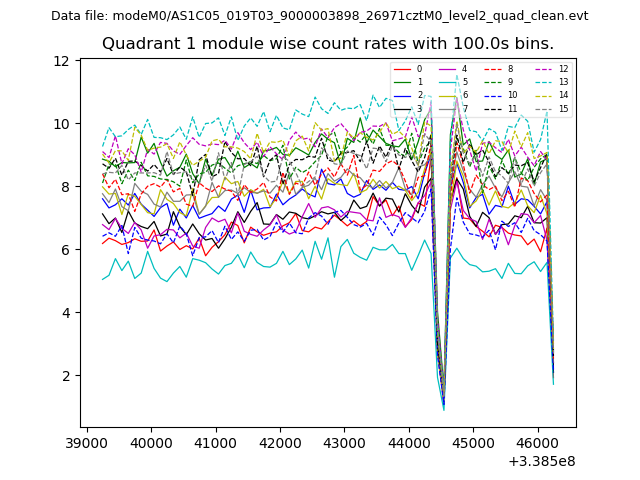
| Module-wise count rates for Quadrant A Data is divided into 100 sec bins |
 |
 |
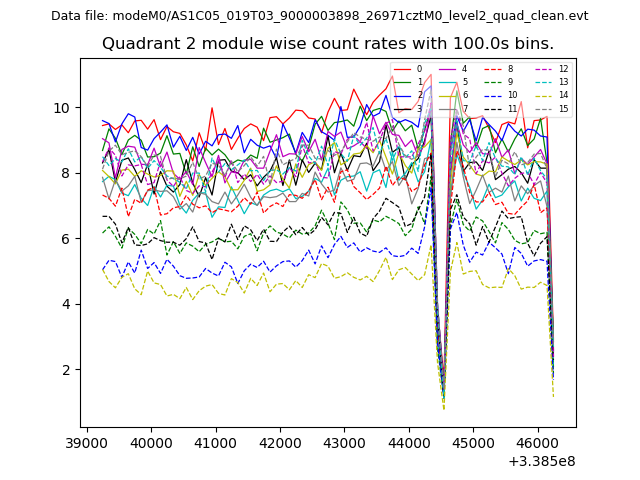
| Module-wise count rates for Quadrant B Data is divided into 100 sec bins |
 |
 |
| Module-wise count rates for Quadrant C Data is divided into 100 sec bins |
 |
 |
| Module-wise count rates for Quadrant D Data is divided into 100 sec bins |
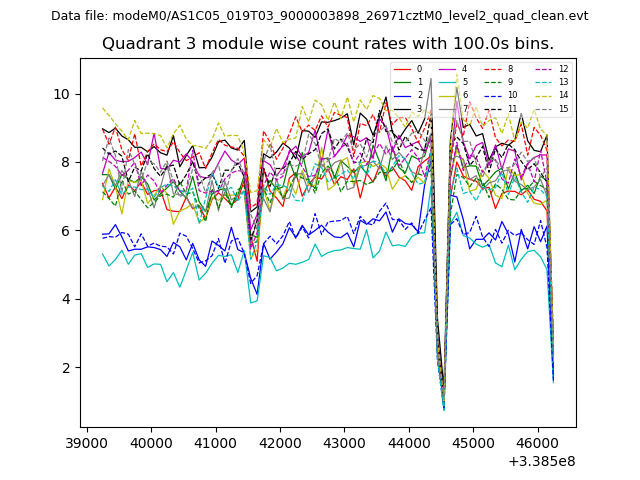 |
 |
| Parameter | Plot |
|---|---|
| CZT HV Monitor | 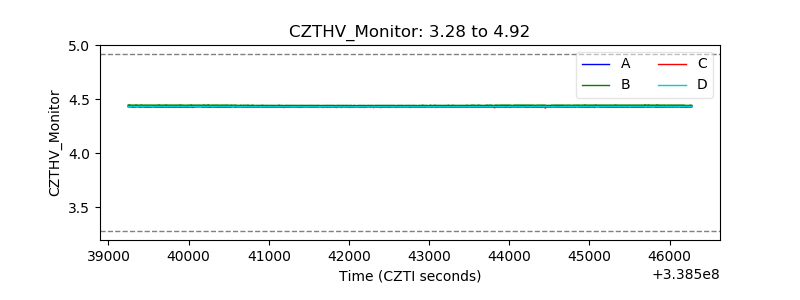 |
| D_VDD | 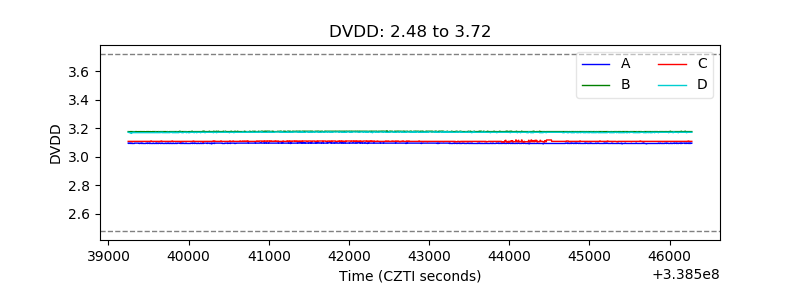 |
| Temperature 1 | 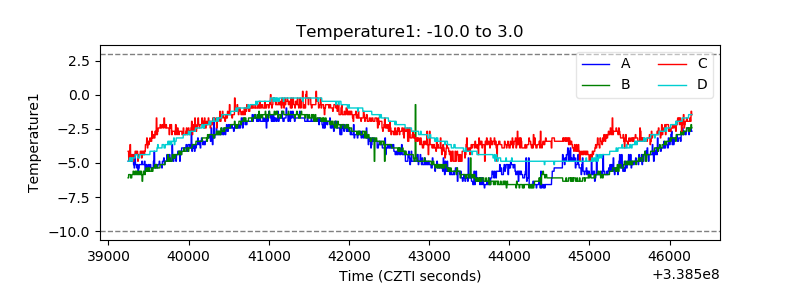 |
| Veto HV Monitor | 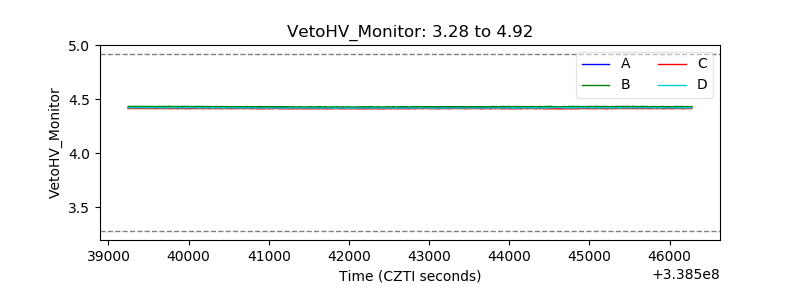 |
| Veto LLD | 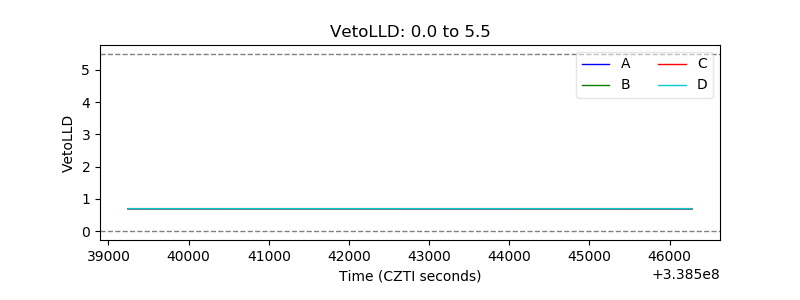 |
| Alpha Counter |  |
| _CPM_Rate | 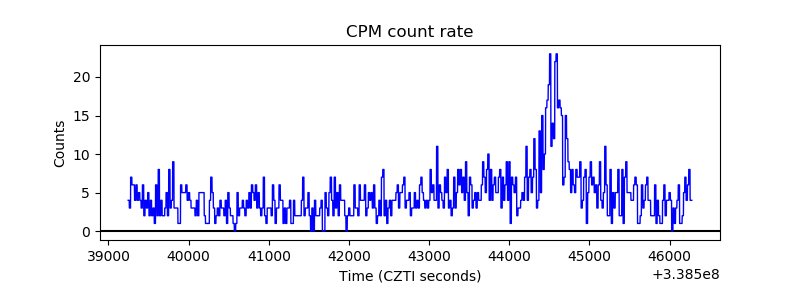 |
| CZT Counter | 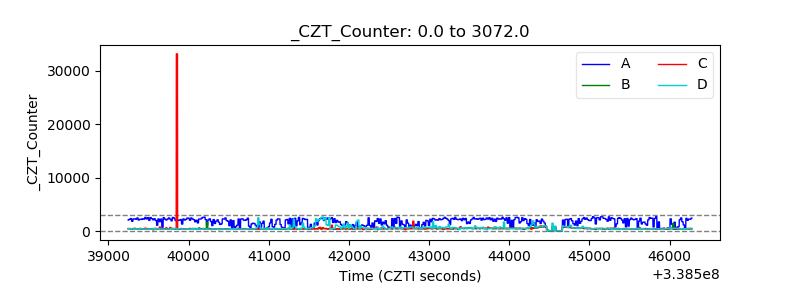 |
| +2.5 Volts monitor |  |
| +5 Volts monitor |  |
| _ROLL_ROT | 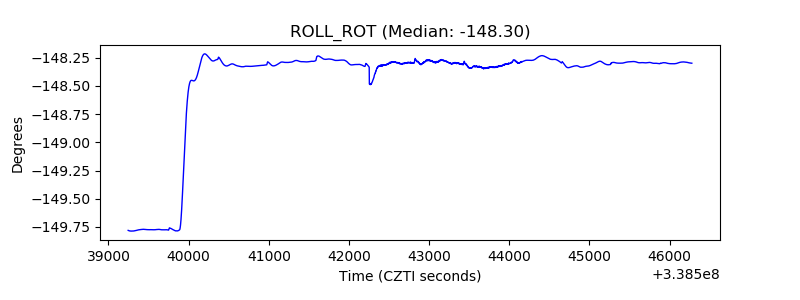 |
| _Roll_DEC | 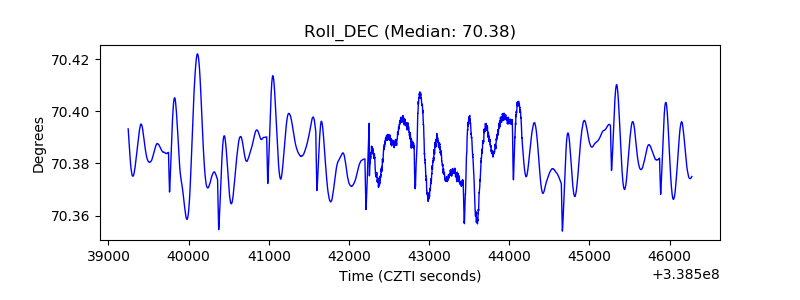 |
| _Roll_RA | 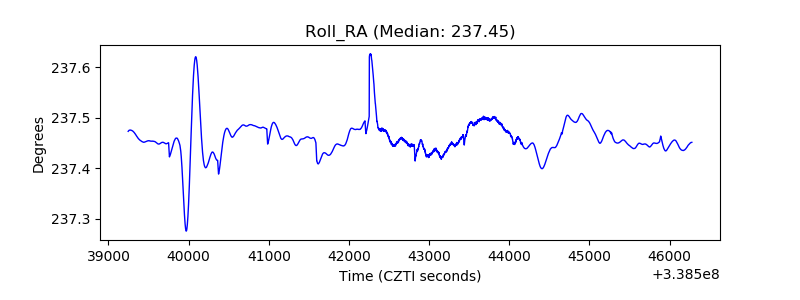 |
| Veto Counter | 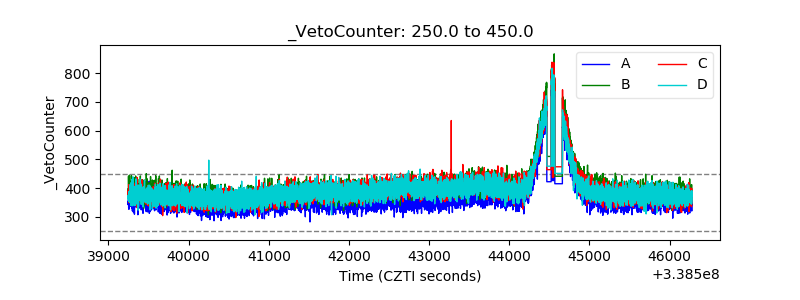 |