| Param | Original file | Final file |
|---|---|---|
| Filename | modeM0/AS1C05_019T03_9000003898_26972cztM0_level2.evt | modeM0/AS1C05_019T03_9000003898_26972cztM0_level2_quad_clean.evt |
| Size (bytes) | 745,902,720 | 117,881,280 |
| Size | 711.3 MB | 112.4 MB |
| Events in quadrant A | 11,354,220 | 567,575 |
| Events in quadrant B | 3,295,860 | 876,140 |
| Events in quadrant C | 3,257,565 | 833,534 |
| Events in quadrant D | 4,217,507 | 813,526 |
| Mode M0 | |||
|---|---|---|---|
| Quadrant | BADHDUFLAG | Total packets | Discarded packets |
| A | 0 | 38368 | 0 |
| B | 0 | 14340 | 0 |
| C | 0 | 14188 | 0 |
| D | 0 | 17050 | 0 |
| Mode M9 | |||
|---|---|---|---|
| Quadrant | BADHDUFLAG | Total packets | Discarded packets |
| A | 0 | 1 | 0 |
| B | 0 | 1 | 0 |
| C | 0 | 1 | 0 |
| D | 0 | 1 | 0 |
| Quadrant | Total seconds | Saturated seconds | Saturation percentage |
|---|---|---|---|
| A | 6847 | 3961 | 57.850153% |
| B | 6848 | 198 | 2.891355% |
| C | 6848 | 189 | 2.759930% |
| D | 6848 | 270 | 3.942757% |
Noise dominated data is calculated using 1-second bins in cleaned event files. If a bin has >2000 counts, and if more than 50% of those come from <1% of pixels, then it is considered to be noise-dominated and hence unusable.
| Quadrant | # 1 sec bins | Bins with >0 counts | Bins with >2000 counts | High rate bins dominated by noise | Noise dominated (total time) | Noise dominated (detector-on time) | Marked lightcurve |
|---|---|---|---|---|---|---|---|
| A | 7007 | 6847 | 3155 | 3155 | 45.03% | 46.08% |  |
| B | 7008 | 6848 | 11 | 11 | 0.16% | 0.16% |  |
| C | 7008 | 6848 | 4 | 4 | 0.06% | 0.06% | 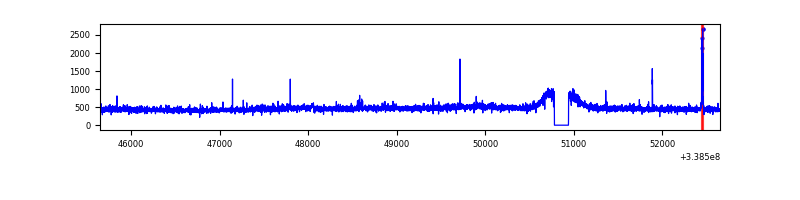 |
| D | 7008 | 6848 | 96 | 96 | 1.37% | 1.40% | 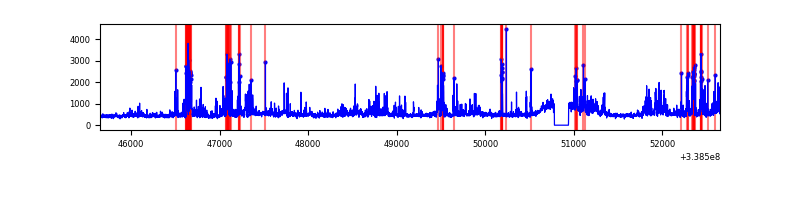 |
Top three noisy pixels from each quadrant. If the there are fewer than three noisy pixels in the level2.evt file, extra rows are filled as -1
| Pixel properties | Quadrant properties | ||||||
|---|---|---|---|---|---|---|---|
| Quadrant | DetID | PixID | Counts | Sigma | Mean | Median | Sigma |
| A | 14 | 235 | 9066019 | 77863.25 | 573 | 561 | 116.4 |
| A | 6 | 16 | 63087 | 537.04 | 573 | 561 | 116.4 |
| A | 8 | 192 | 10366 | 84.22 | 573 | 561 | 116.4 |
| B | 5 | 172 | 49868 | 315.44 | 813 | 791 | 155.6 |
| B | 0 | 230 | 49036 | 310.09 | 813 | 791 | 155.6 |
| B | 12 | 111 | 19143 | 117.96 | 813 | 791 | 155.6 |
| C | 14 | 238 | 125041 | 671.25 | 786 | 789 | 185.1 |
| C | 15 | 208 | 41140 | 217.99 | 786 | 789 | 185.1 |
| C | 2 | 16 | 17191 | 88.61 | 786 | 789 | 185.1 |
| D | 1 | 52 | 447497 | 2351.31 | 794 | 771 | 190.0 |
| D | 11 | 176 | 351780 | 1847.51 | 794 | 771 | 190.0 |
| D | 2 | 250 | 306344 | 1608.36 | 794 | 771 | 190.0 |
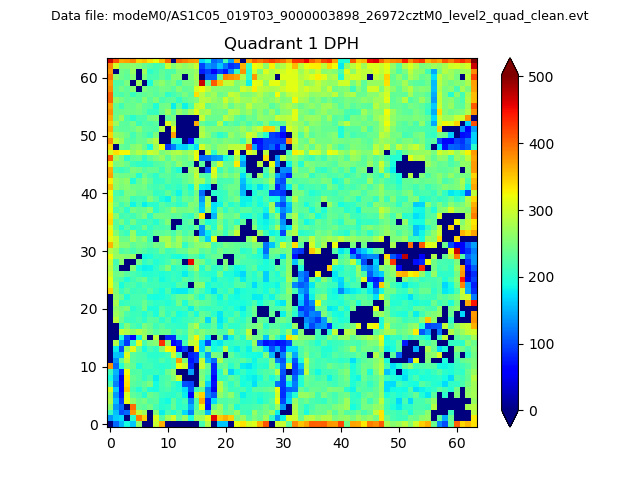
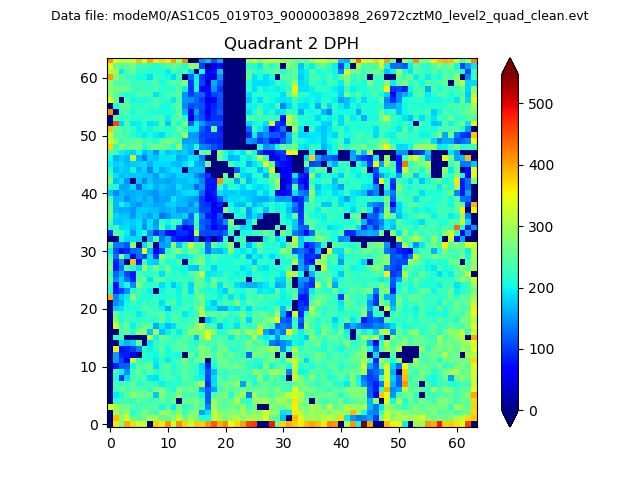
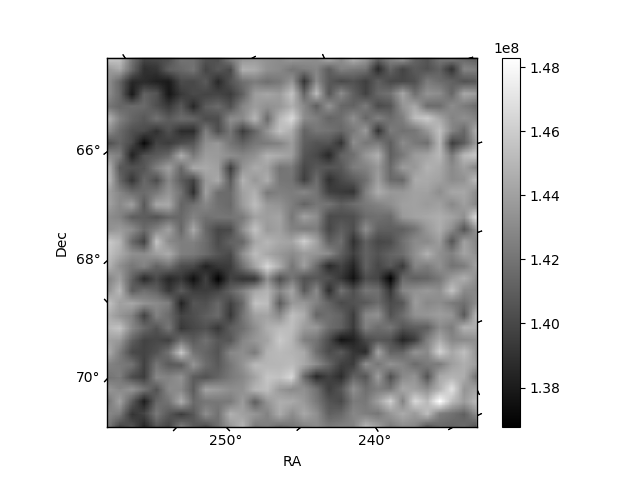
Histogram calculated using DETX and DETY for each event in the final _common_clean file
| Quadrant A | 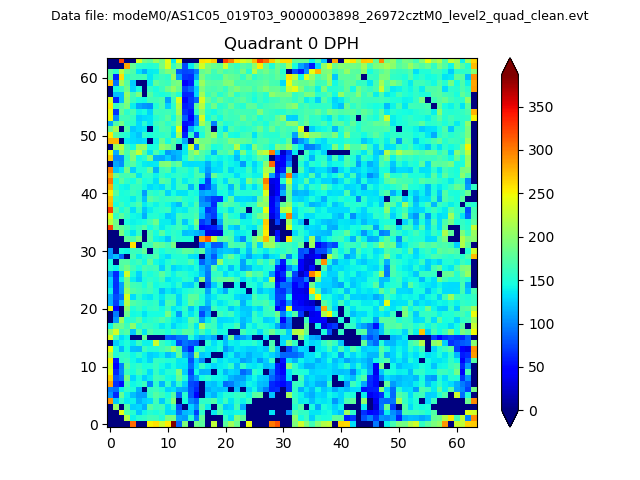 |
 |
Quadrant B |
|---|---|---|---|
| Quadrant D | 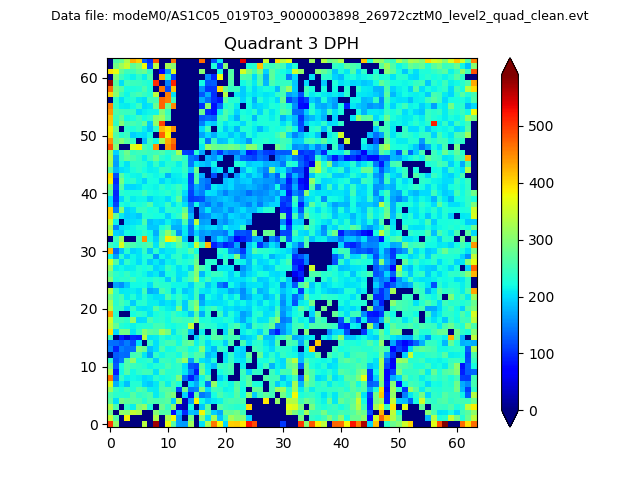 |
 |
Quadrant C |
| Plot type | Count rate plots | Images |
|---|---|---|
| Comparison with Poisson distribution Blue bars denote a histogram of data divided into 1 sec bins. Red curve is a Poisson curve with rate = median count rate of data. |
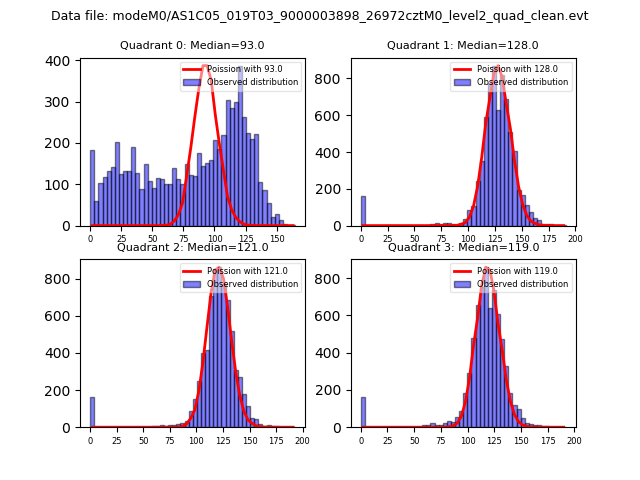 |
 |
| Quadrant-wise count rates Data is divided into 100 sec bins |
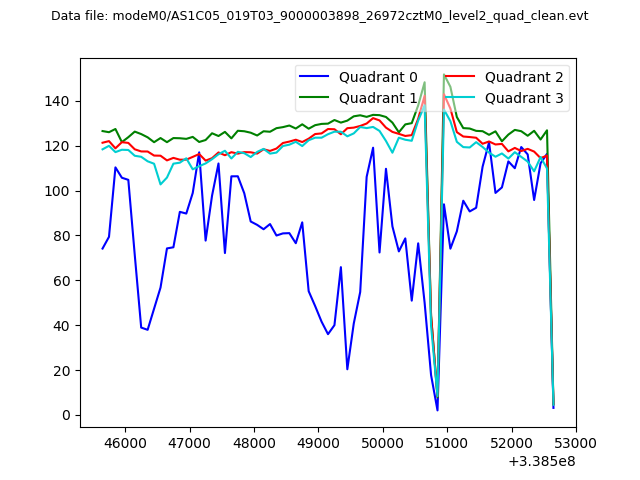 |
|
| Module-wise count rates for Quadrant A Data is divided into 100 sec bins |
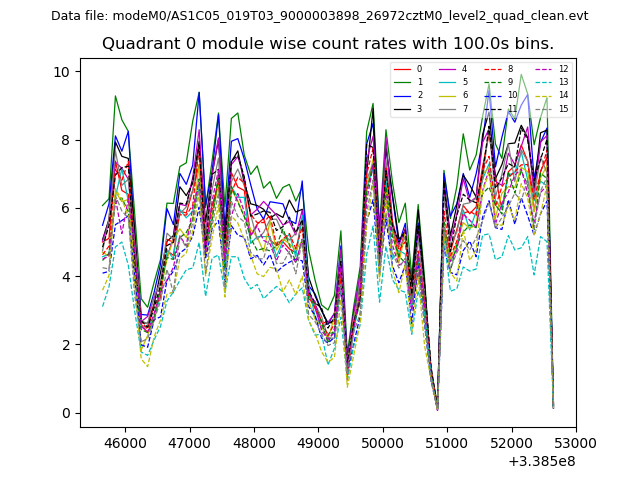 |
 |
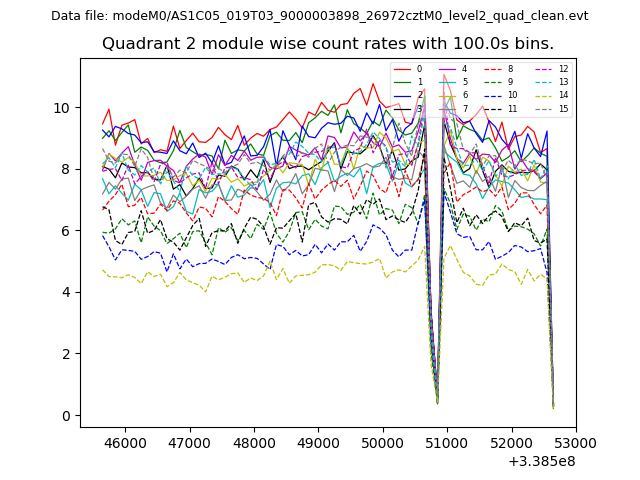
| Module-wise count rates for Quadrant B Data is divided into 100 sec bins |
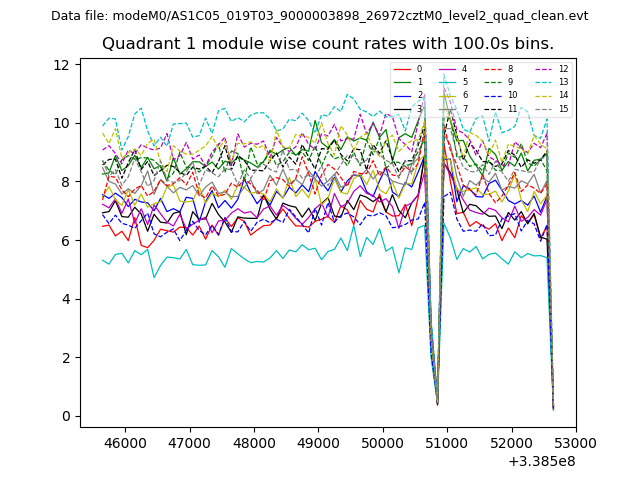 |
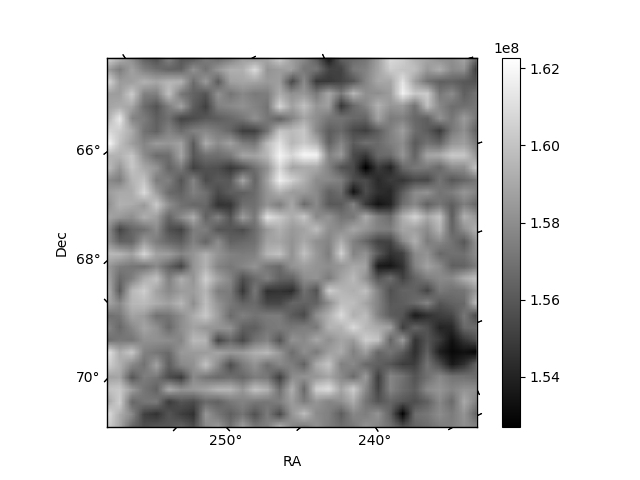 |
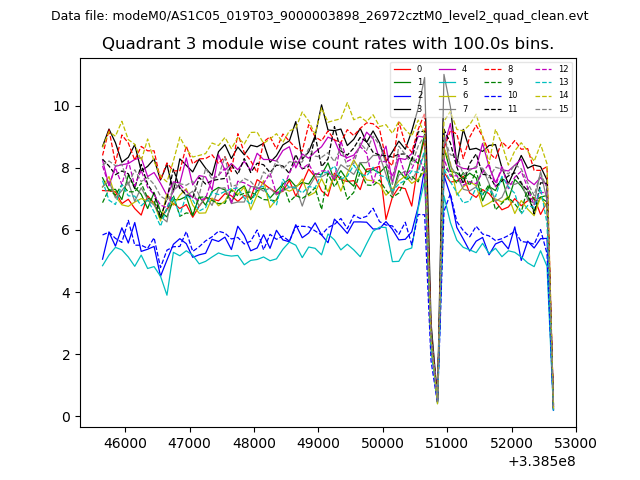
| Module-wise count rates for Quadrant C Data is divided into 100 sec bins |
 |
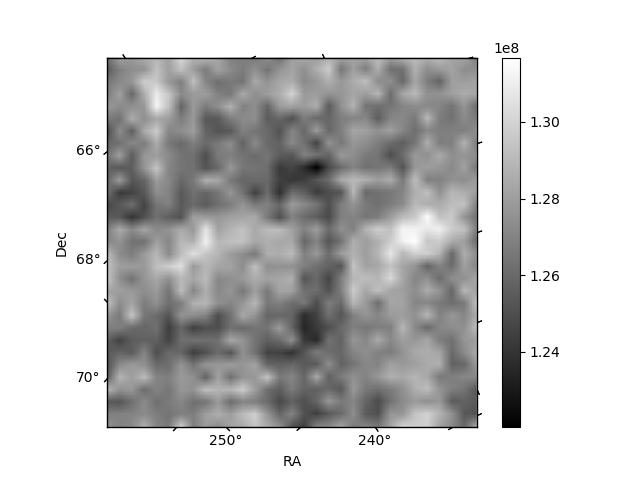 |
| Module-wise count rates for Quadrant D Data is divided into 100 sec bins |
 |
 |
| Parameter | Plot |
|---|---|
| CZT HV Monitor | 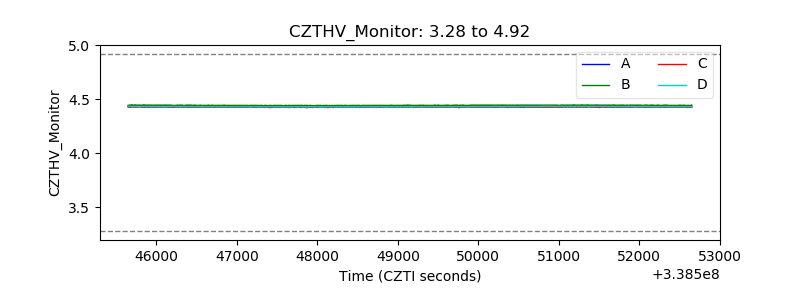 |
| D_VDD |  |
| Temperature 1 | 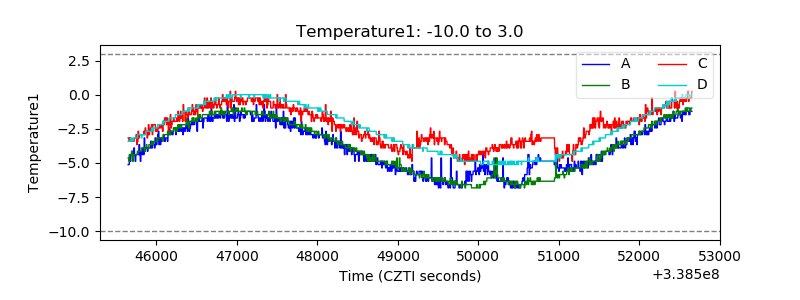 |
| Veto HV Monitor |  |
| Veto LLD | 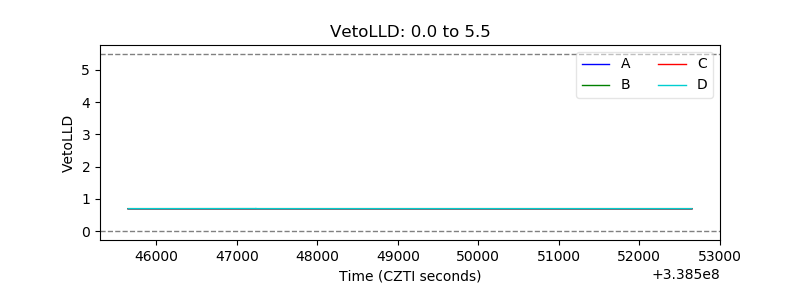 |
| Alpha Counter | 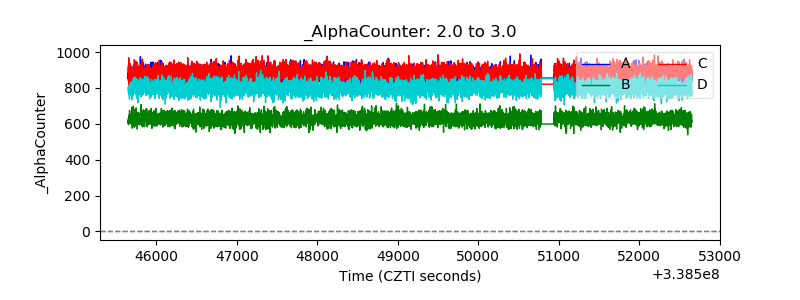 |
| _CPM_Rate |  |
| CZT Counter | 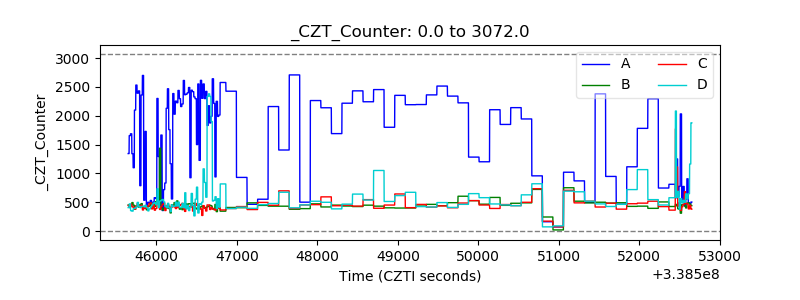 |
| +2.5 Volts monitor |  |
| +5 Volts monitor |  |
| _ROLL_ROT | 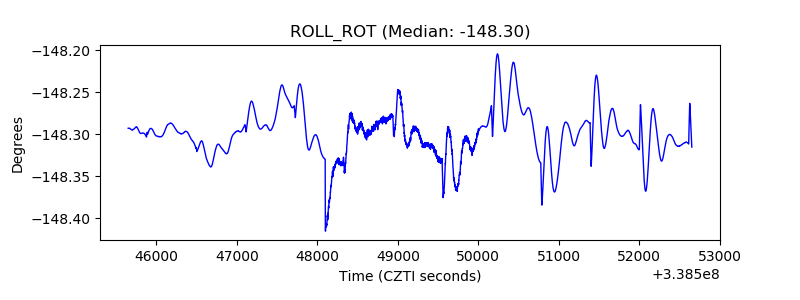 |
| _Roll_DEC | 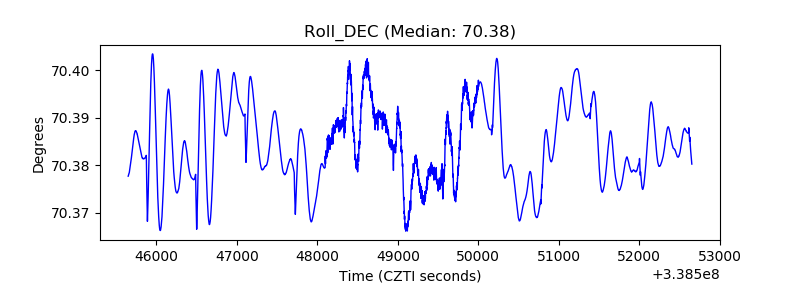 |
| _Roll_RA | 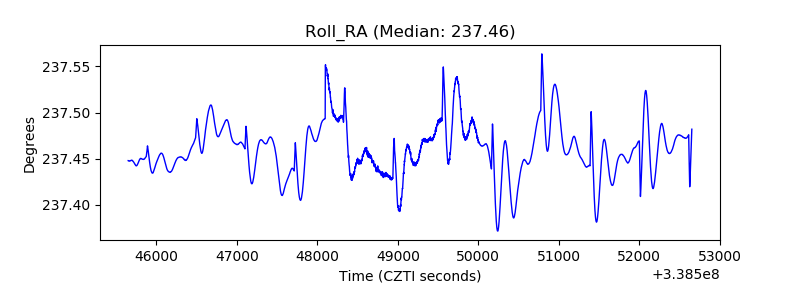 |
| Veto Counter | 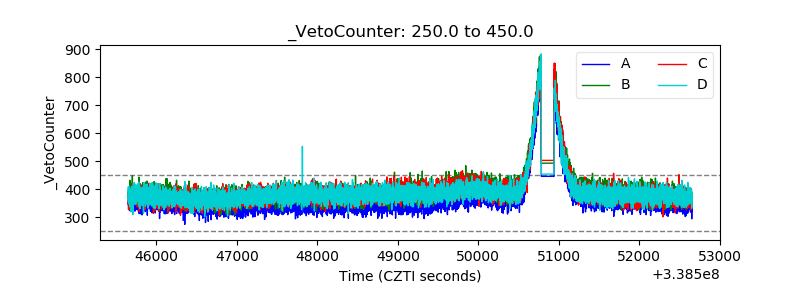 |