| Param | Original file | Final file |
|---|---|---|
| Filename | modeM0/AS1C05_019T03_9000003898_26975cztM0_level2.evt | modeM0/AS1C05_019T03_9000003898_26975cztM0_level2_quad_clean.evt |
| Size (bytes) | 711,927,360 | 128,194,560 |
| Size | 678.9 MB | 122.3 MB |
| Events in quadrant A | 8,934,260 | 764,612 |
| Events in quadrant B | 3,677,238 | 907,686 |
| Events in quadrant C | 3,511,107 | 869,347 |
| Events in quadrant D | 4,950,878 | 838,653 |
| Mode M0 | |||
|---|---|---|---|
| Quadrant | BADHDUFLAG | Total packets | Discarded packets |
| A | 0 | 31439 | 0 |
| B | 0 | 15618 | 0 |
| C | 0 | 15156 | 0 |
| D | 0 | 19500 | 0 |
| Mode M9 | |||
|---|---|---|---|
| Quadrant | BADHDUFLAG | Total packets | Discarded packets |
| A | 0 | 4 | 0 |
| B | 0 | 4 | 0 |
| C | 0 | 4 | 0 |
| D | 0 | 4 | 0 |
| Quadrant | Total seconds | Saturated seconds | Saturation percentage |
|---|---|---|---|
| A | 7197 | 2129 | 29.581770% |
| B | 7198 | 192 | 2.667408% |
| C | 7198 | 129 | 1.792164% |
| D | 7198 | 285 | 3.959433% |
Noise dominated data is calculated using 1-second bins in cleaned event files. If a bin has >2000 counts, and if more than 50% of those come from <1% of pixels, then it is considered to be noise-dominated and hence unusable.
| Quadrant | # 1 sec bins | Bins with >0 counts | Bins with >2000 counts | High rate bins dominated by noise | Noise dominated (total time) | Noise dominated (detector-on time) | Marked lightcurve |
|---|---|---|---|---|---|---|---|
| A | 7622 | 7197 | 1697 | 1697 | 22.26% | 23.58% | 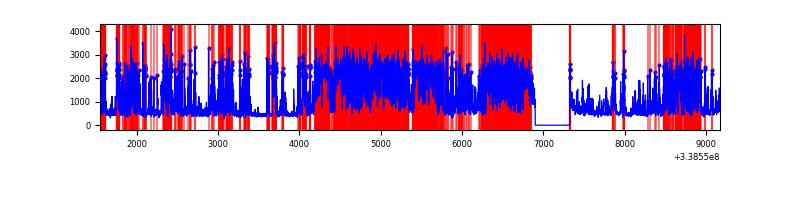 |
| B | 7623 | 7198 | 100 | 100 | 1.31% | 1.39% | 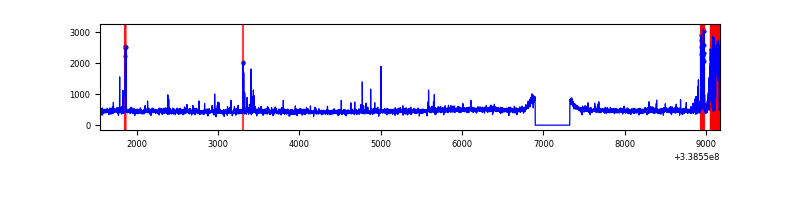 |
| C | 7623 | 7198 | 30 | 30 | 0.39% | 0.42% | 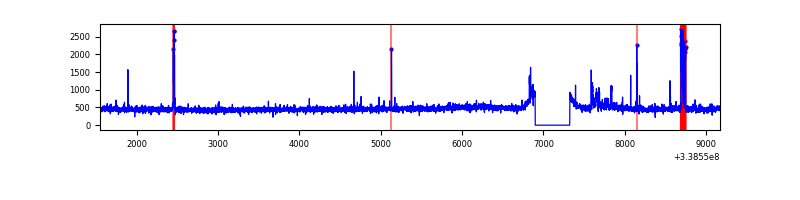 |
| D | 7623 | 7198 | 218 | 218 | 2.86% | 3.03% | 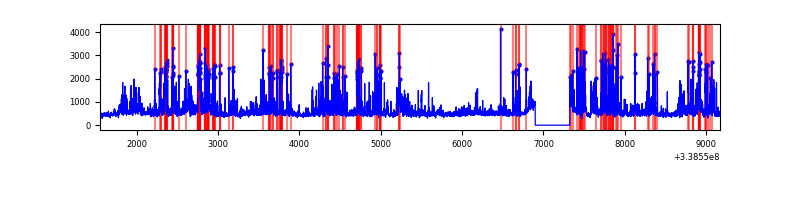 |
Top three noisy pixels from each quadrant. If the there are fewer than three noisy pixels in the level2.evt file, extra rows are filled as -1
| Pixel properties | Quadrant properties | ||||||
|---|---|---|---|---|---|---|---|
| Quadrant | DetID | PixID | Counts | Sigma | Mean | Median | Sigma |
| A | 14 | 235 | 6014906 | 39614.85 | 747 | 728 | 151.8 |
| A | 13 | 170 | 17583 | 111.02 | 747 | 728 | 151.8 |
| A | 8 | 192 | 14979 | 93.87 | 747 | 728 | 151.8 |
| B | 5 | 172 | 321281 | 2005.69 | 839 | 816 | 159.8 |
| B | 0 | 230 | 31269 | 190.6 | 839 | 816 | 159.8 |
| B | 12 | 111 | 19568 | 117.36 | 839 | 816 | 159.8 |
| C | 2 | 16 | 143939 | 755.65 | 811 | 817 | 189.4 |
| C | 14 | 238 | 129371 | 678.73 | 811 | 817 | 189.4 |
| C | 15 | 208 | 55058 | 286.38 | 811 | 817 | 189.4 |
| D | 1 | 52 | 800352 | 4100.87 | 816 | 791 | 195.0 |
| D | 2 | 250 | 642976 | 3293.7 | 816 | 791 | 195.0 |
| D | 11 | 176 | 271562 | 1388.76 | 816 | 791 | 195.0 |
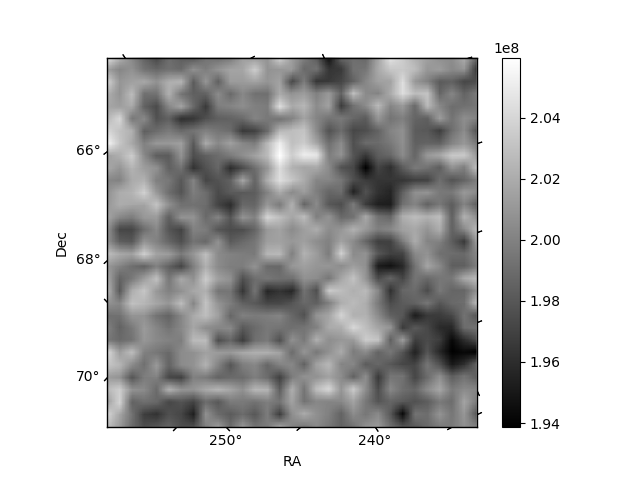
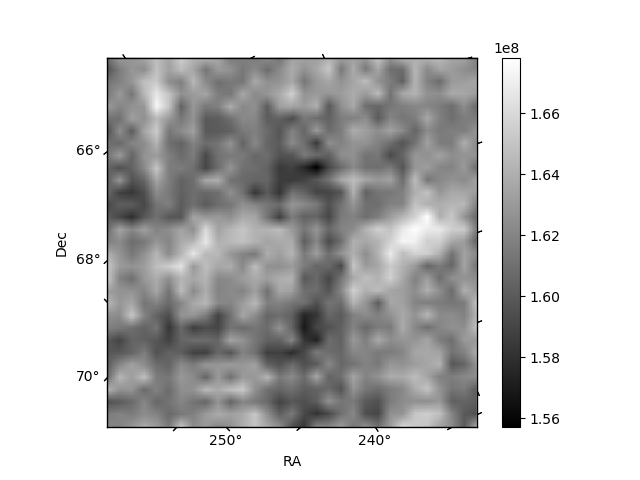
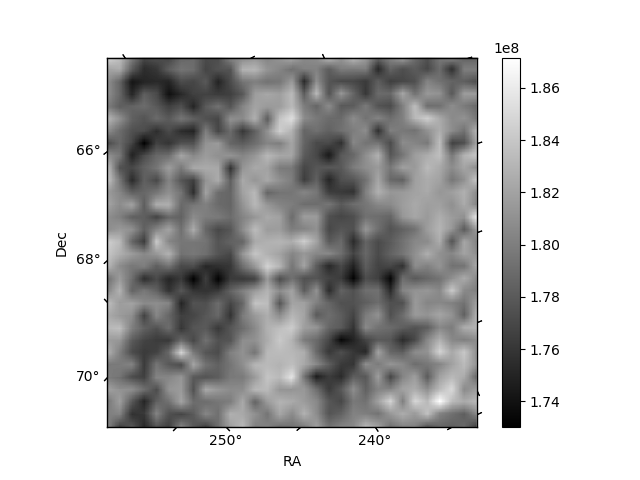
Histogram calculated using DETX and DETY for each event in the final _common_clean file
| Quadrant A | 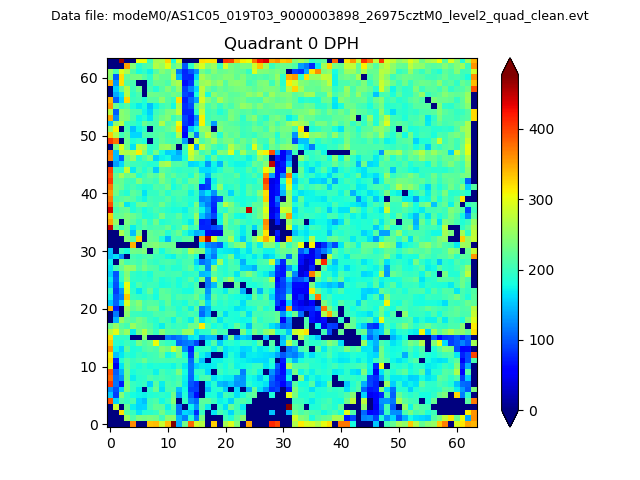 |
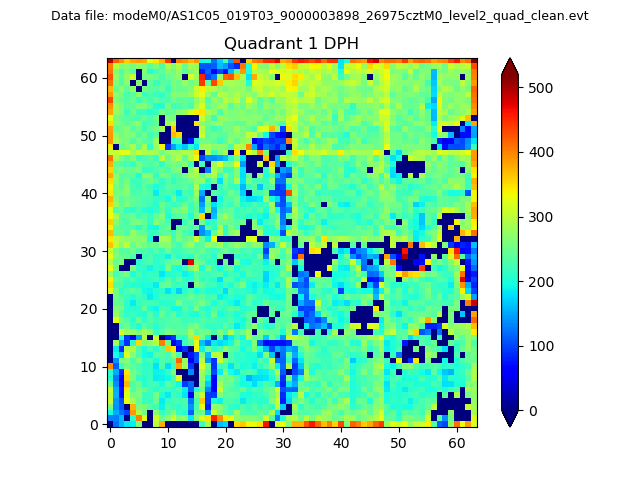 |
Quadrant B |
|---|---|---|---|
| Quadrant D | 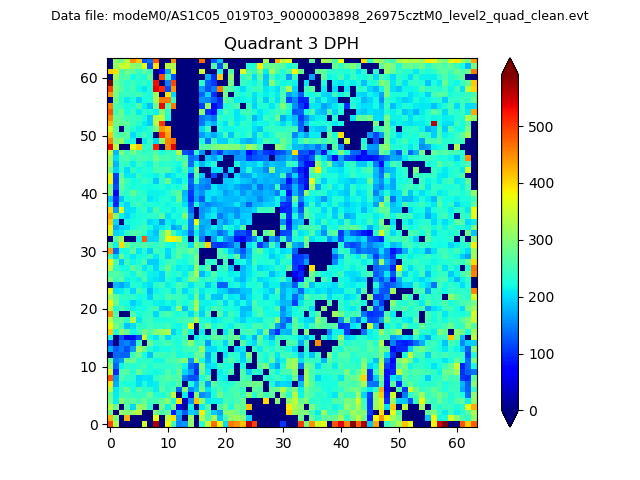 |
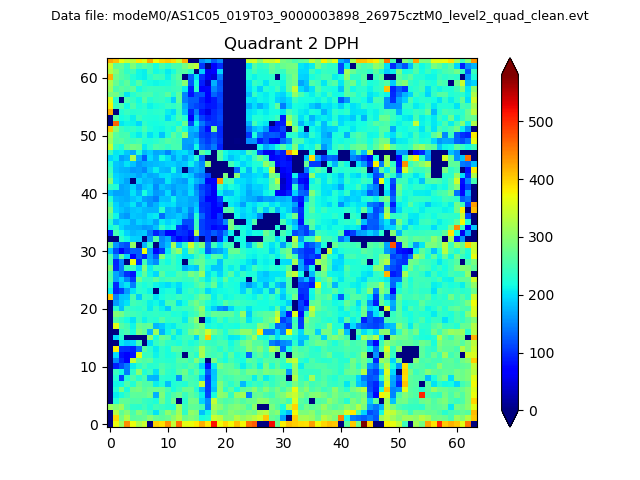 |
Quadrant C |
| Plot type | Count rate plots | Images |
|---|---|---|
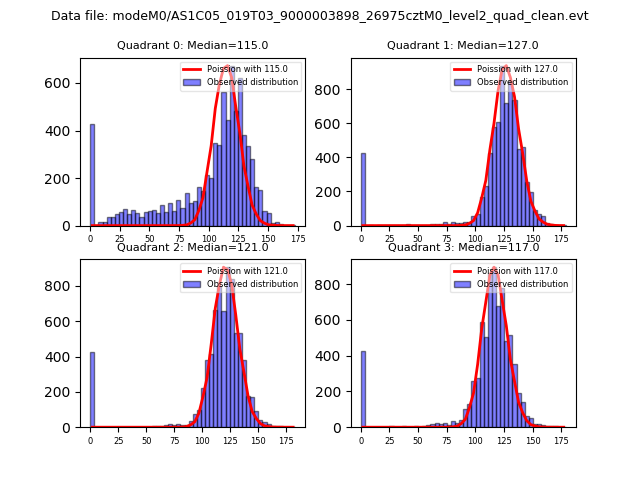
| Comparison with Poisson distribution Blue bars denote a histogram of data divided into 1 sec bins. Red curve is a Poisson curve with rate = median count rate of data. |
 |
 |
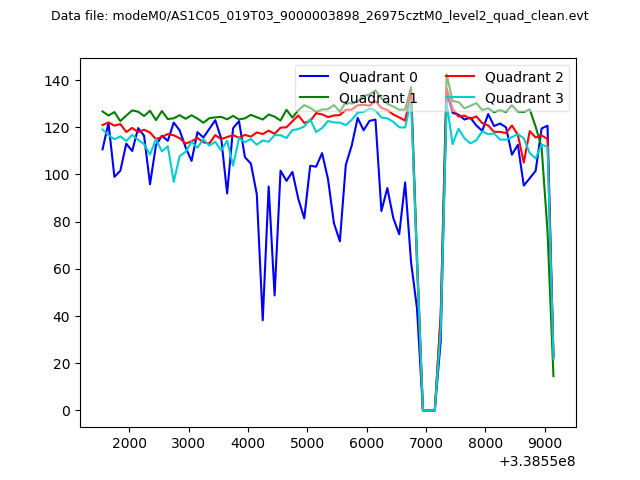
| Quadrant-wise count rates Data is divided into 100 sec bins |
 |
|
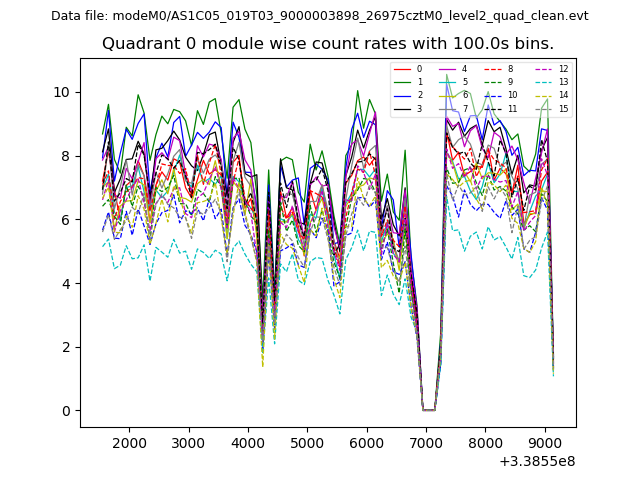
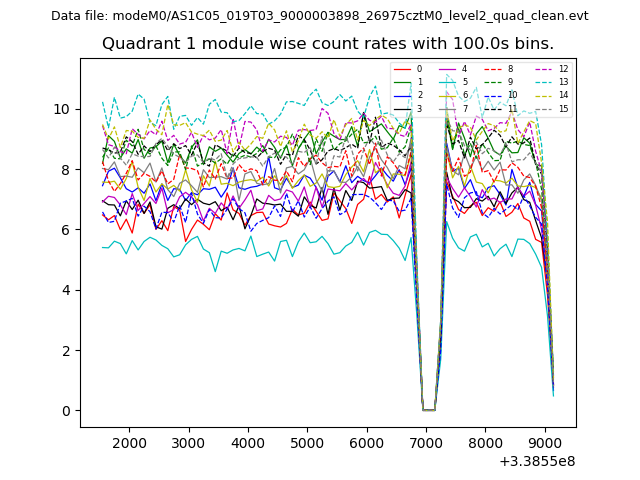
| Module-wise count rates for Quadrant A Data is divided into 100 sec bins |
 |
 |
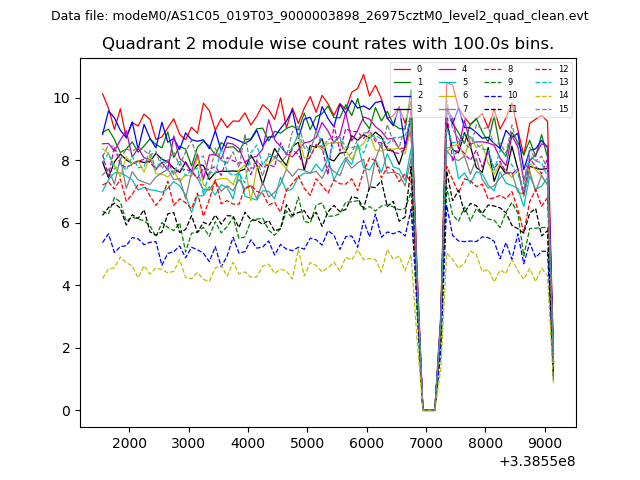
| Module-wise count rates for Quadrant B Data is divided into 100 sec bins |
 |
 |
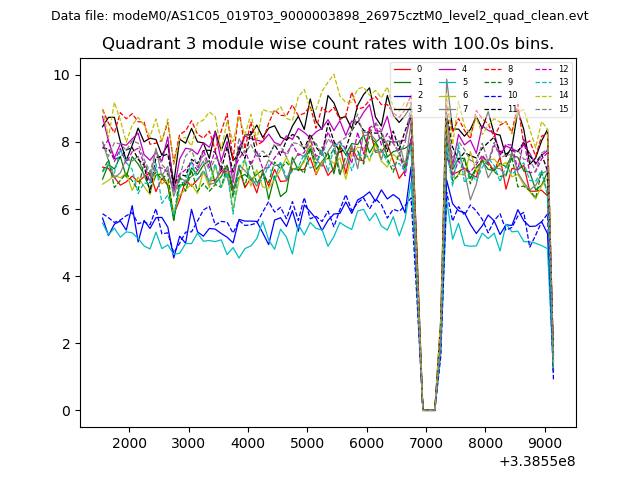
| Module-wise count rates for Quadrant C Data is divided into 100 sec bins |
 |
 |
| Module-wise count rates for Quadrant D Data is divided into 100 sec bins |
 |
 |
| Parameter | Plot |
|---|---|
| CZT HV Monitor | 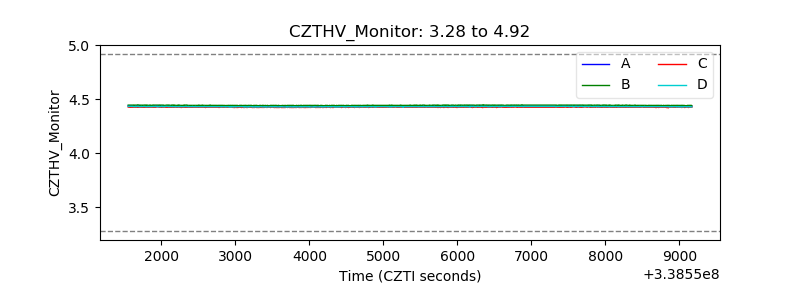 |
| D_VDD | 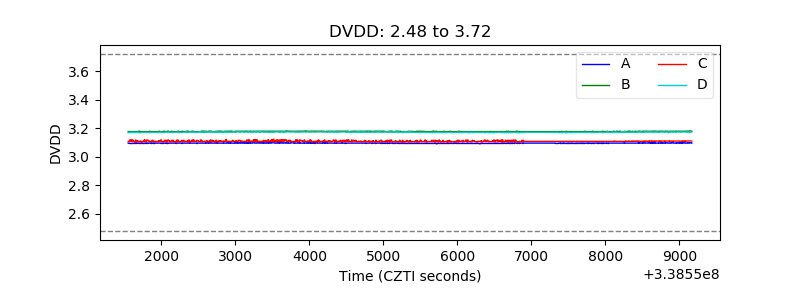 |
| Temperature 1 | 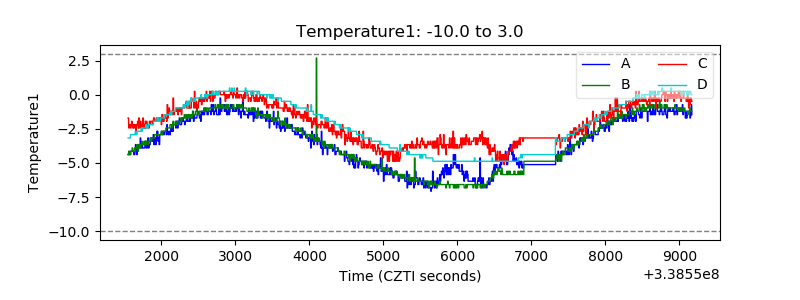 |
| Veto HV Monitor | 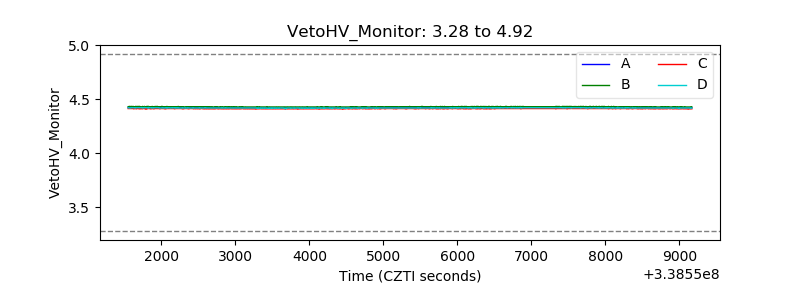 |
| Veto LLD | 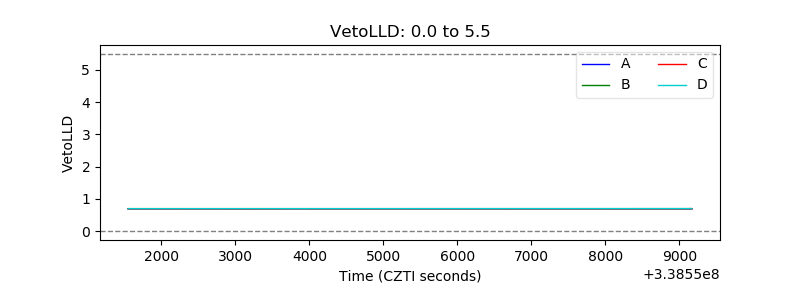 |
| Alpha Counter | 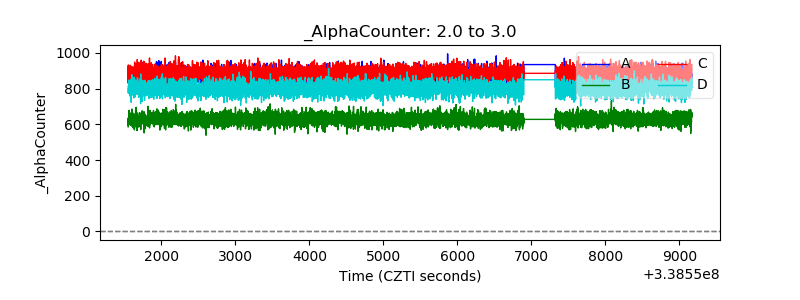 |
| _CPM_Rate |  |
| CZT Counter | 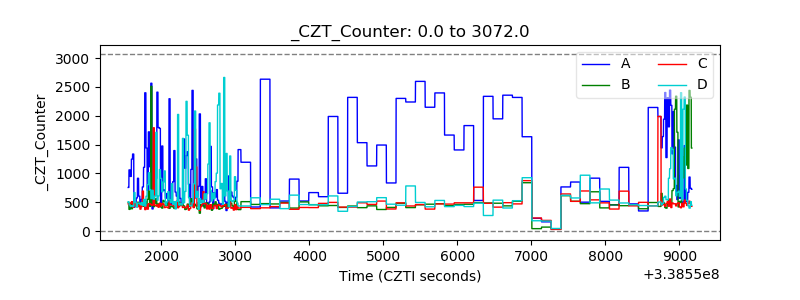 |
| +2.5 Volts monitor |  |
| +5 Volts monitor |  |
| _ROLL_ROT | 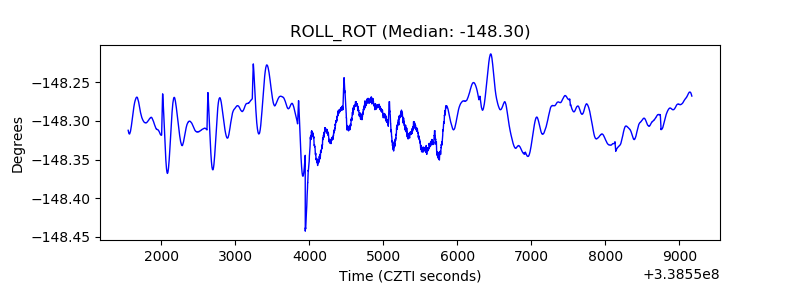 |
| _Roll_DEC | 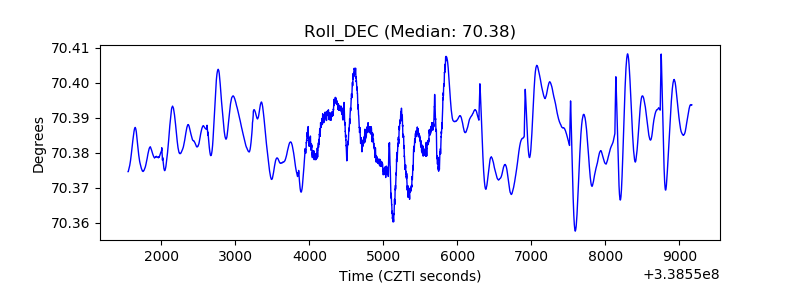 |
| _Roll_RA | 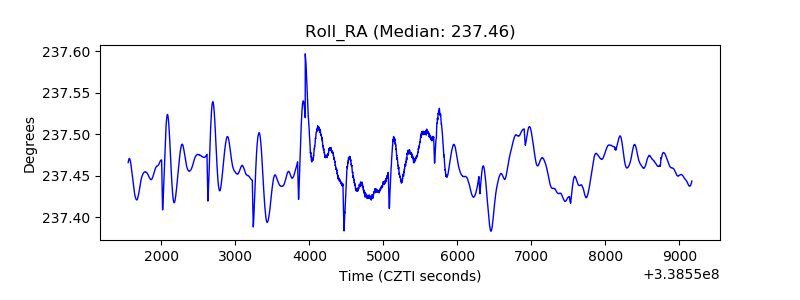 |
| Veto Counter | 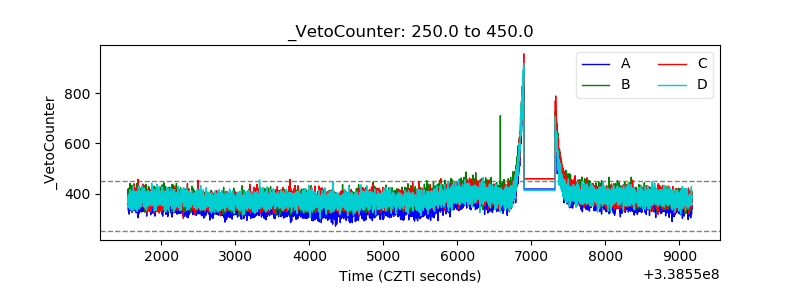 |