| Param | Original file | Final file |
|---|---|---|
| Filename | modeM0/AS1A09_145T01_9000003900_26975cztM0_level2.evt | modeM0/AS1A09_145T01_9000003900_26975cztM0_level2_quad_clean.evt |
| Size (bytes) | 1,002,435,840 | 129,709,440 |
| Size | 956.0 MB | 123.7 MB |
| Events in quadrant A | 12,175,645 | 708,781 |
| Events in quadrant B | 6,046,348 | 881,325 |
| Events in quadrant C | 4,987,190 | 841,457 |
| Events in quadrant D | 6,483,033 | 811,782 |
| Mode M0 | |||
|---|---|---|---|
| Quadrant | BADHDUFLAG | Total packets | Discarded packets |
| A | 0 | 42824 | 0 |
| B | 0 | 23750 | 0 |
| C | 0 | 20591 | 0 |
| D | 0 | 25659 | 0 |
| Mode M9 | |||
|---|---|---|---|
| Quadrant | BADHDUFLAG | Total packets | Discarded packets |
| A | 0 | 14 | 0 |
| B | 0 | 14 | 0 |
| C | 0 | 14 | 0 |
| D | 0 | 14 | 0 |
| Quadrant | Total seconds | Saturated seconds | Saturation percentage |
|---|---|---|---|
| A | 9865 | 3115 | 31.576280% |
| B | 9865 | 633 | 6.416624% |
| C | 9865 | 181 | 1.834769% |
| D | 9865 | 372 | 3.770907% |
Noise dominated data is calculated using 1-second bins in cleaned event files. If a bin has >2000 counts, and if more than 50% of those come from <1% of pixels, then it is considered to be noise-dominated and hence unusable.
| Quadrant | # 1 sec bins | Bins with >0 counts | Bins with >2000 counts | High rate bins dominated by noise | Noise dominated (total time) | Noise dominated (detector-on time) | Marked lightcurve |
|---|---|---|---|---|---|---|---|
| A | 11289 | 9864 | 2268 | 2268 | 20.09% | 22.99% | 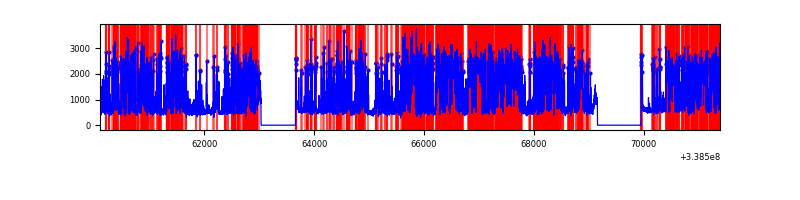 |
| B | 11290 | 9865 | 371 | 371 | 3.29% | 3.76% | 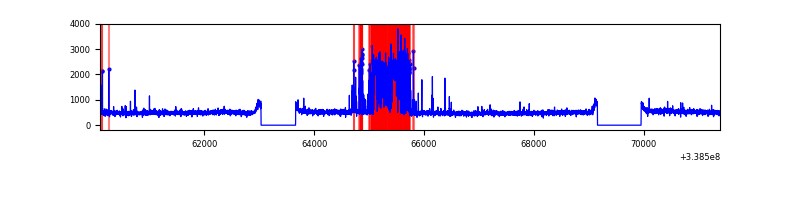 |
| C | 11290 | 9865 | 10 | 10 | 0.09% | 0.10% | 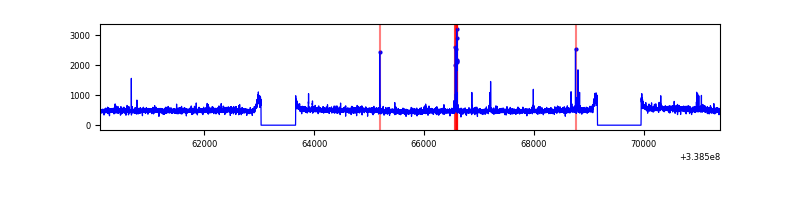 |
| D | 11289 | 9864 | 235 | 235 | 2.08% | 2.38% | 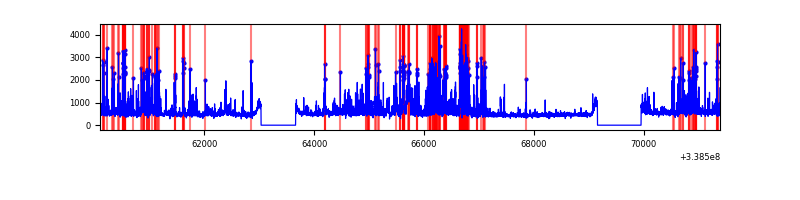 |
Top three noisy pixels from each quadrant. If the there are fewer than three noisy pixels in the level2.evt file, extra rows are filled as -1
| Pixel properties | Quadrant properties | ||||||
|---|---|---|---|---|---|---|---|
| Quadrant | DetID | PixID | Counts | Sigma | Mean | Median | Sigma |
| A | 14 | 235 | 7970434 | 36474.49 | 1076 | 1055 | 218.5 |
| A | 8 | 192 | 29555 | 130.44 | 1076 | 1055 | 218.5 |
| A | 0 | 13 | 16363 | 70.06 | 1076 | 1055 | 218.5 |
| B | 5 | 172 | 1233484 | 5264.08 | 1218 | 1187 | 234.1 |
| B | 12 | 111 | 28208 | 115.43 | 1218 | 1187 | 234.1 |
| B | 0 | 219 | 26051 | 106.21 | 1218 | 1187 | 234.1 |
| C | 14 | 238 | 192217 | 668.92 | 1204 | 1213 | 285.5 |
| C | 15 | 208 | 73974 | 254.82 | 1204 | 1213 | 285.5 |
| C | 0 | 207 | 17083 | 55.58 | 1204 | 1213 | 285.5 |
| D | 1 | 52 | 1074645 | 3717.24 | 1203 | 1173 | 288.8 |
| D | 2 | 250 | 623403 | 2154.67 | 1203 | 1173 | 288.8 |
| D | 7 | 38 | 79733 | 272.04 | 1203 | 1173 | 288.8 |
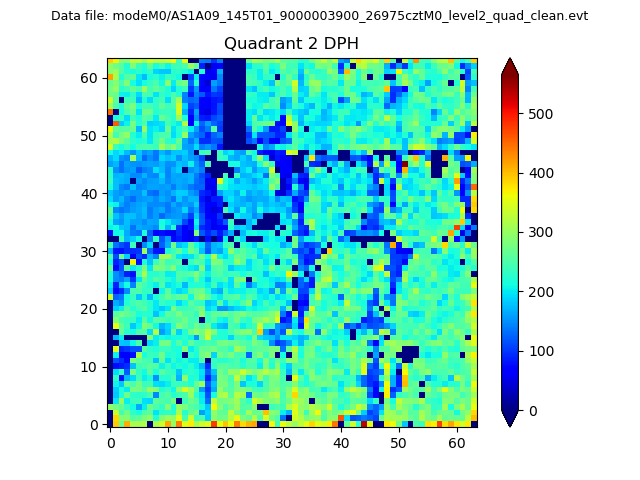
Histogram calculated using DETX and DETY for each event in the final _common_clean file
| Quadrant A | 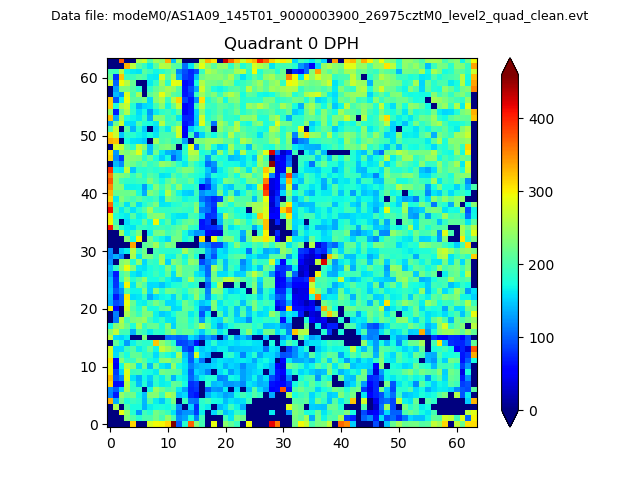 |
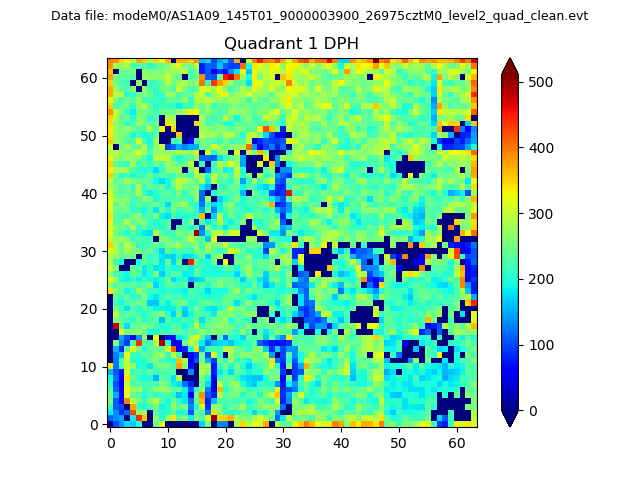 |
Quadrant B |
|---|---|---|---|
| Quadrant D | 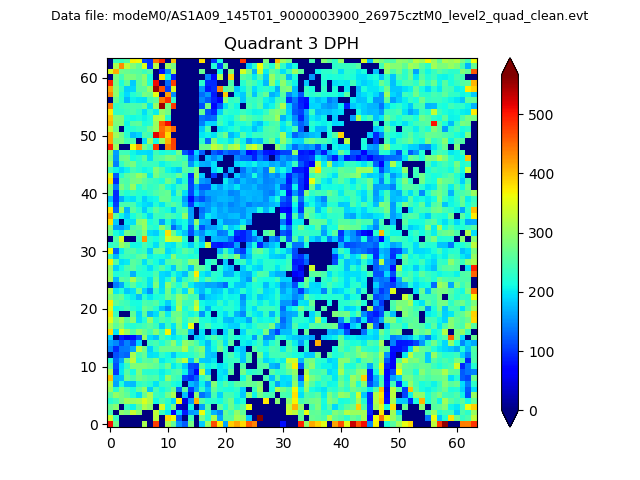 |
 |
Quadrant C |
| Plot type | Count rate plots | Images |
|---|---|---|
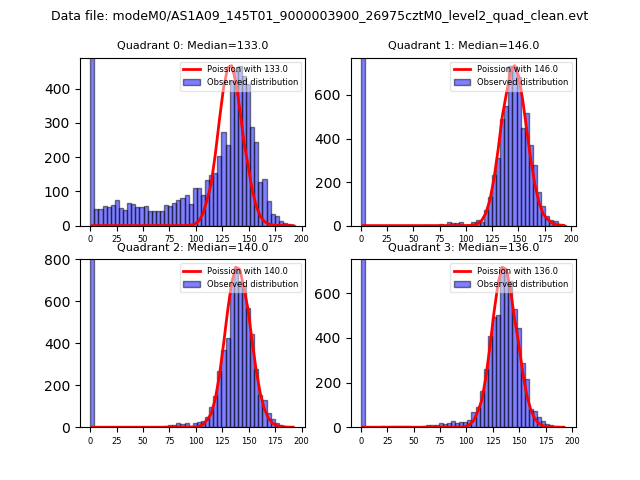
| Comparison with Poisson distribution Blue bars denote a histogram of data divided into 1 sec bins. Red curve is a Poisson curve with rate = median count rate of data. |
 |
 |
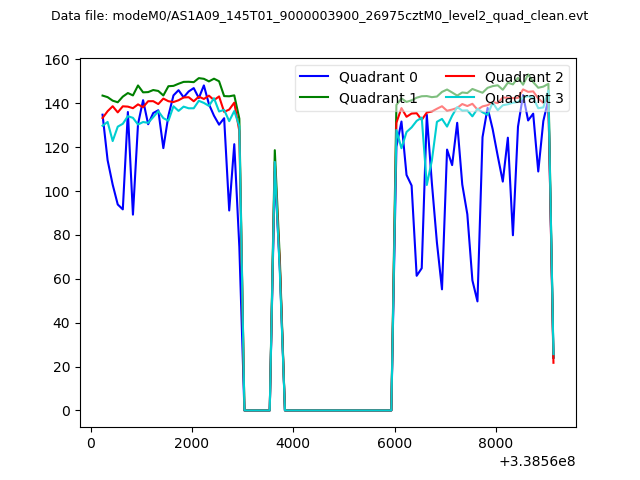
| Quadrant-wise count rates Data is divided into 100 sec bins |
 |
|
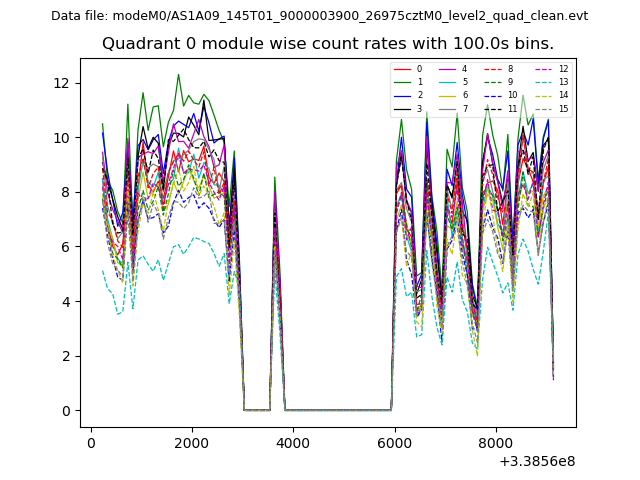
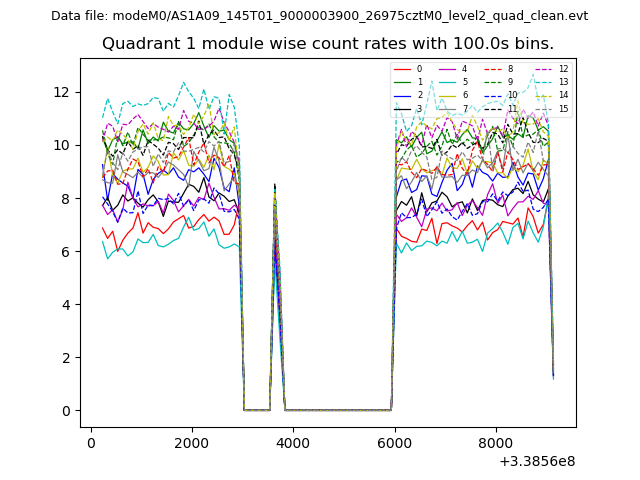
| Module-wise count rates for Quadrant A Data is divided into 100 sec bins |
 |
 |
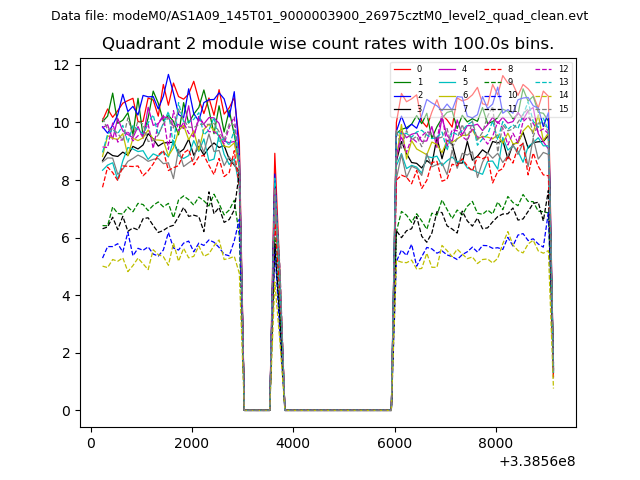
| Module-wise count rates for Quadrant B Data is divided into 100 sec bins |
 |
 |
| Module-wise count rates for Quadrant C Data is divided into 100 sec bins |
 |
 |
| Module-wise count rates for Quadrant D Data is divided into 100 sec bins |
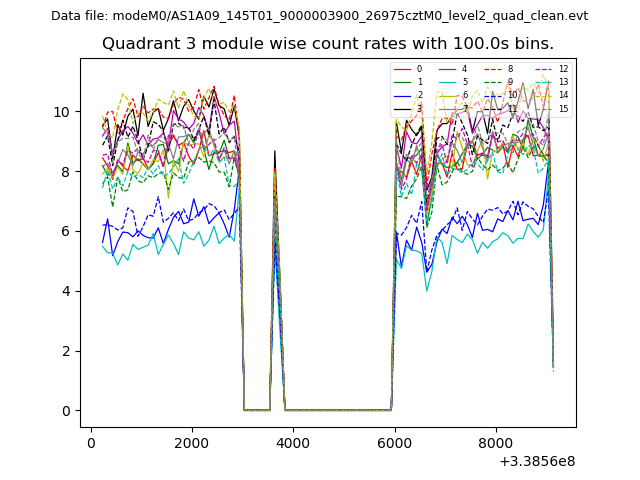 |
 |
| Parameter | Plot |
|---|---|
| CZT HV Monitor | 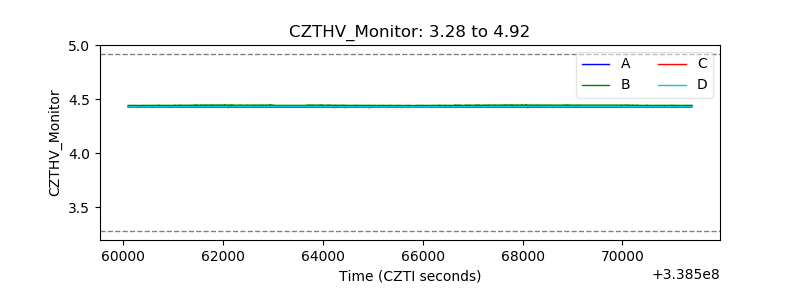 |
| D_VDD | 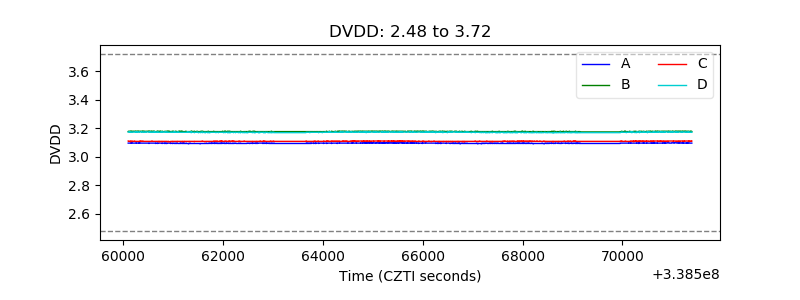 |
| Temperature 1 | 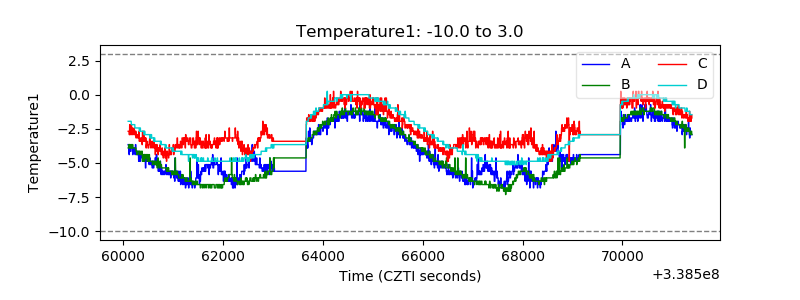 |
| Veto HV Monitor | 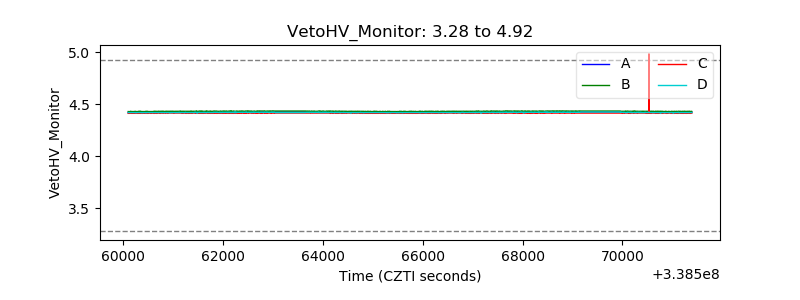 |
| Veto LLD | 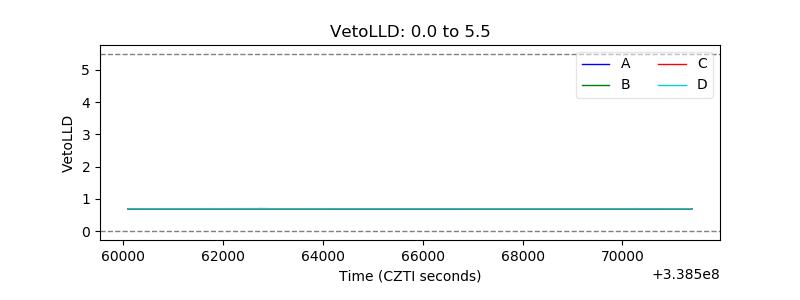 |
| Alpha Counter | 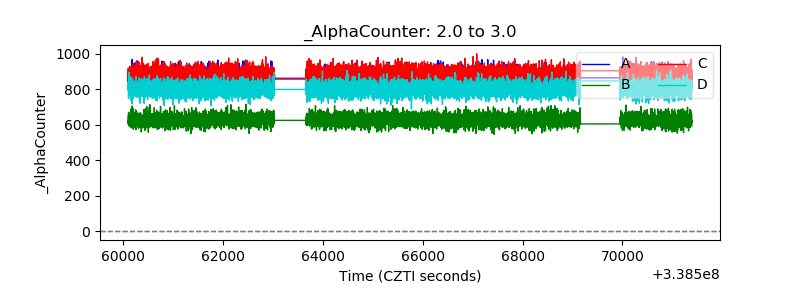 |
| _CPM_Rate | 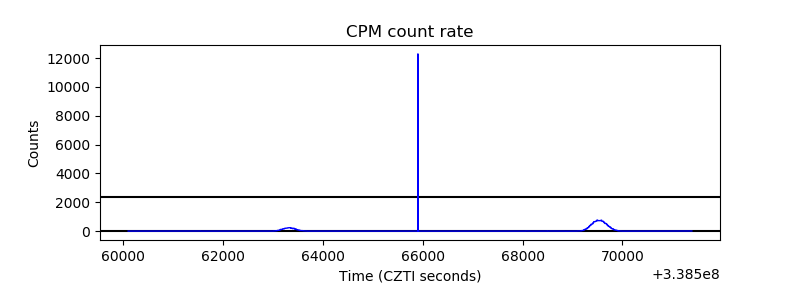 |
| CZT Counter | 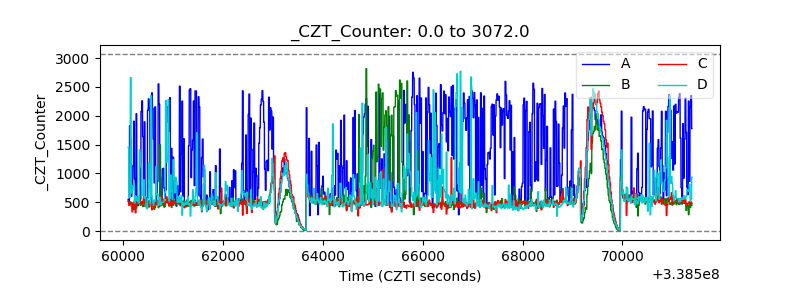 |
| +2.5 Volts monitor |  |
| +5 Volts monitor |  |
| _ROLL_ROT | 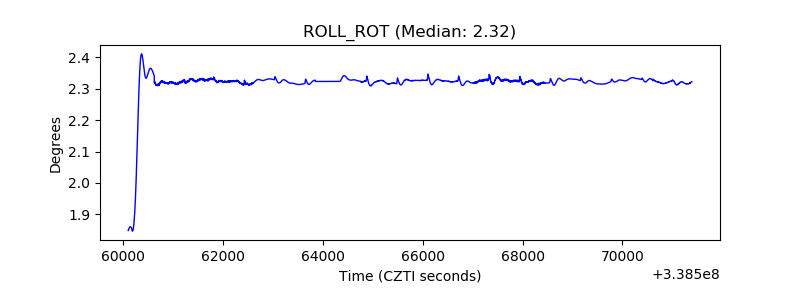 |
| _Roll_DEC | 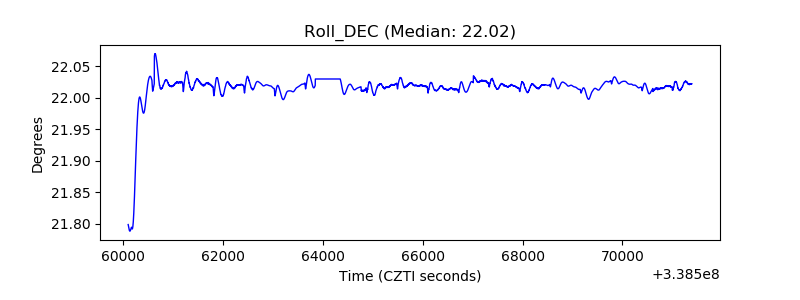 |
| _Roll_RA | 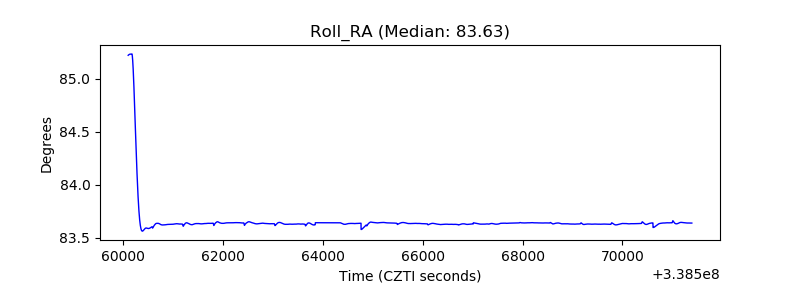 |
| Veto Counter | 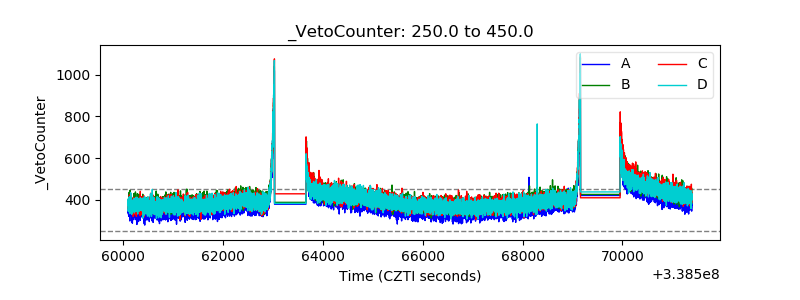 |