| Param | Original file | Final file |
|---|---|---|
| Filename | modeM0/AS1A09_145T01_9000003900_26976cztM0_level2.evt | modeM0/AS1A09_145T01_9000003900_26976cztM0_level2_quad_clean.evt |
| Size (bytes) | 681,629,760 | 75,260,160 |
| Size | 650.1 MB | 71.8 MB |
| Events in quadrant A | 8,526,634 | 362,816 |
| Events in quadrant B | 3,444,669 | 500,166 |
| Events in quadrant C | 3,512,019 | 479,758 |
| Events in quadrant D | 4,704,798 | 466,925 |
| Mode M0 | |||
|---|---|---|---|
| Quadrant | BADHDUFLAG | Total packets | Discarded packets |
| A | 0 | 29930 | 0 |
| B | 0 | 14253 | 0 |
| C | 0 | 14458 | 0 |
| D | 0 | 18454 | 0 |
| Mode M9 | |||
|---|---|---|---|
| Quadrant | BADHDUFLAG | Total packets | Discarded packets |
| A | 0 | 18 | 0 |
| B | 0 | 18 | 0 |
| C | 0 | 18 | 0 |
| D | 0 | 18 | 0 |
| Quadrant | Total seconds | Saturated seconds | Saturation percentage |
|---|---|---|---|
| A | 6720 | 2354 | 35.029762% |
| B | 6720 | 69 | 1.026786% |
| C | 6721 | 132 | 1.963993% |
| D | 6721 | 281 | 4.180925% |
Noise dominated data is calculated using 1-second bins in cleaned event files. If a bin has >2000 counts, and if more than 50% of those come from <1% of pixels, then it is considered to be noise-dominated and hence unusable.
| Quadrant | # 1 sec bins | Bins with >0 counts | Bins with >2000 counts | High rate bins dominated by noise | Noise dominated (total time) | Noise dominated (detector-on time) | Marked lightcurve |
|---|---|---|---|---|---|---|---|
| A | 8515 | 6720 | 1762 | 1762 | 20.69% | 26.22% | 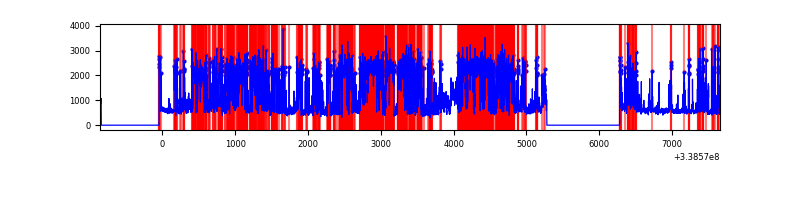 |
| B | 8515 | 6720 | 1 | 1 | 0.01% | 0.01% | 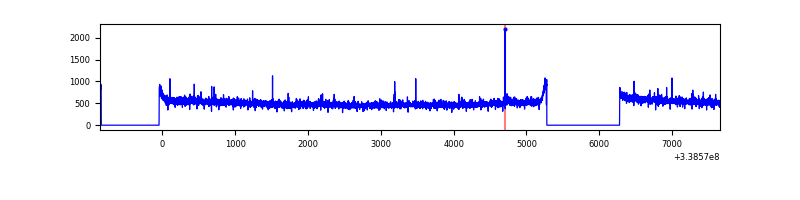 |
| C | 8516 | 6721 | 13 | 13 | 0.15% | 0.19% | 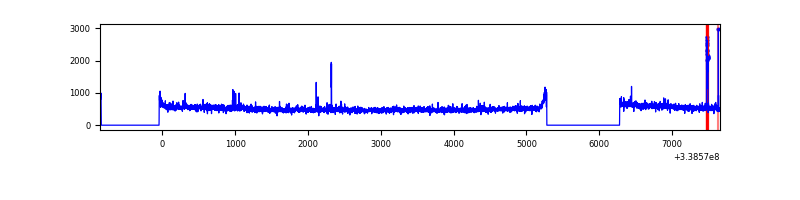 |
| D | 8516 | 6721 | 189 | 189 | 2.22% | 2.81% | 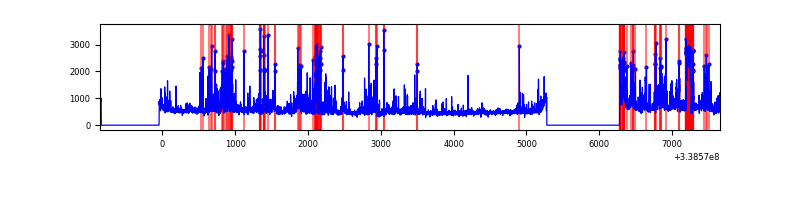 |
Top three noisy pixels from each quadrant. If the there are fewer than three noisy pixels in the level2.evt file, extra rows are filled as -1
| Pixel properties | Quadrant properties | ||||||
|---|---|---|---|---|---|---|---|
| Quadrant | DetID | PixID | Counts | Sigma | Mean | Median | Sigma |
| A | 14 | 235 | 5672576 | 38342.22 | 731 | 717 | 147.9 |
| A | 8 | 192 | 27904 | 183.79 | 731 | 717 | 147.9 |
| A | 13 | 254 | 10117 | 63.54 | 731 | 717 | 147.9 |
| B | 12 | 111 | 19872 | 113.25 | 875 | 855 | 167.9 |
| B | 0 | 219 | 19552 | 111.34 | 875 | 855 | 167.9 |
| B | 11 | 111 | 17677 | 100.17 | 875 | 855 | 167.9 |
| C | 14 | 238 | 134905 | 675.16 | 844 | 850 | 198.6 |
| C | 15 | 208 | 55996 | 277.74 | 844 | 850 | 198.6 |
| C | 2 | 16 | 18715 | 89.98 | 844 | 850 | 198.6 |
| D | 1 | 52 | 807897 | 3985.81 | 842 | 821 | 202.5 |
| D | 2 | 250 | 311244 | 1533.05 | 842 | 821 | 202.5 |
| D | 7 | 38 | 179876 | 884.28 | 842 | 821 | 202.5 |
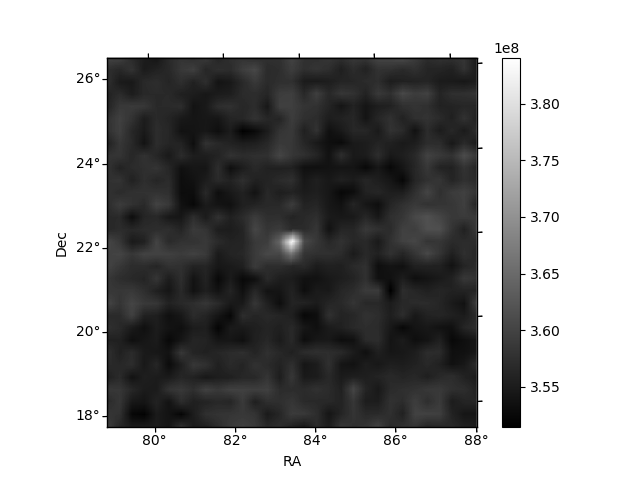
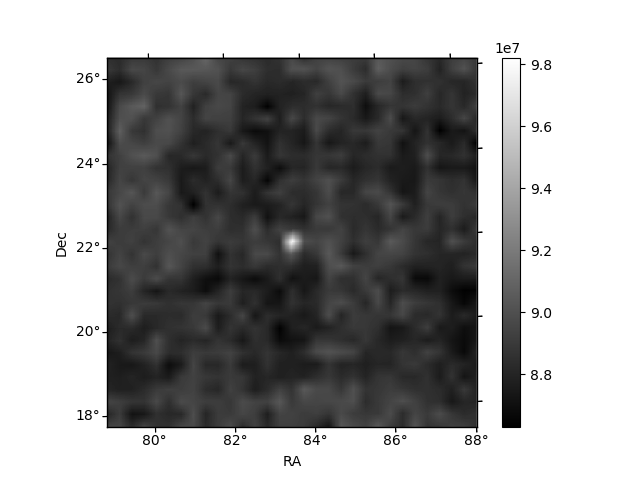
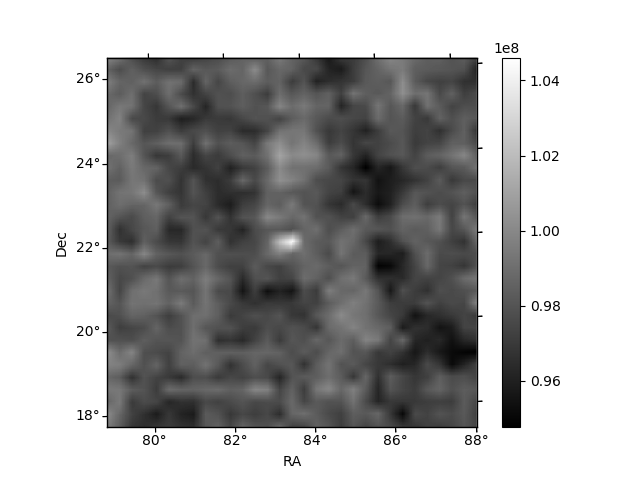
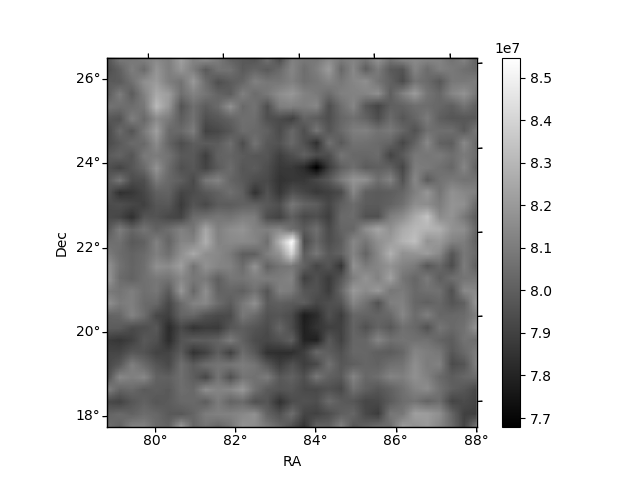
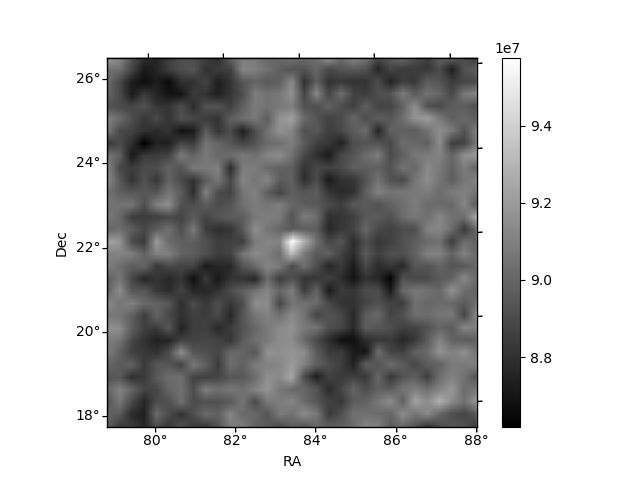
Histogram calculated using DETX and DETY for each event in the final _common_clean file
| Quadrant A | 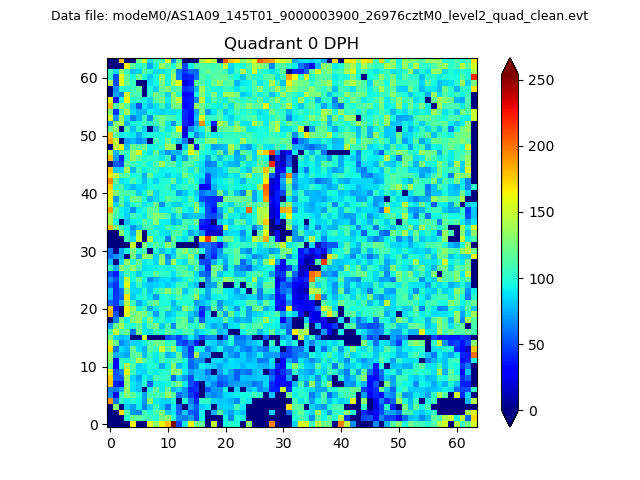 |
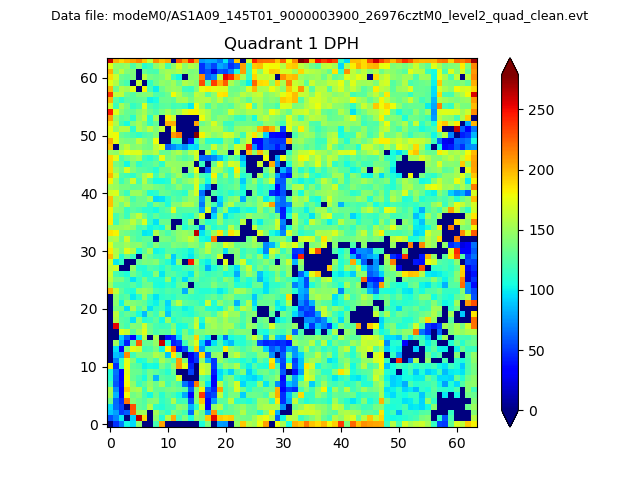 |
Quadrant B |
|---|---|---|---|
| Quadrant D | 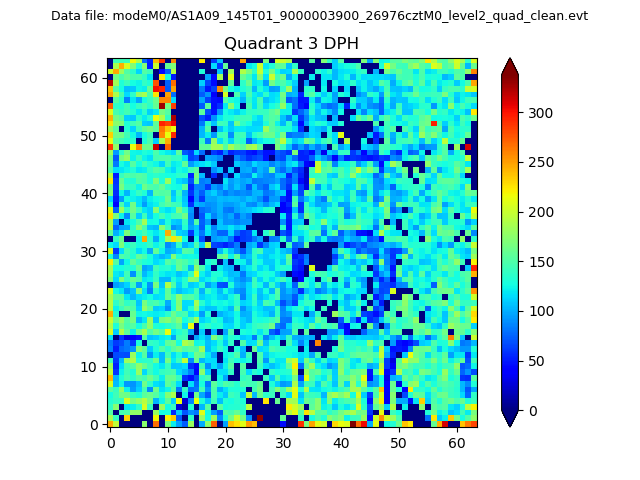 |
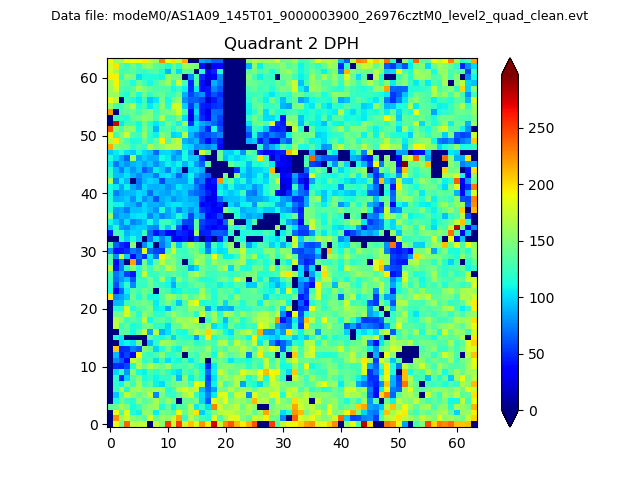 |
Quadrant C |
| Plot type | Count rate plots | Images |
|---|---|---|
| Comparison with Poisson distribution Blue bars denote a histogram of data divided into 1 sec bins. Red curve is a Poisson curve with rate = median count rate of data. |
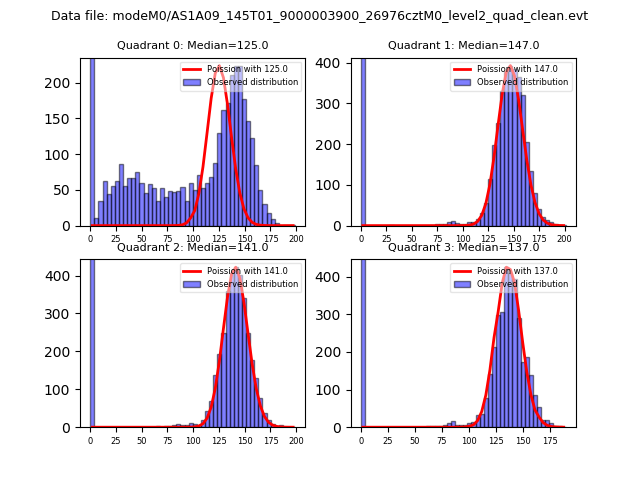 |
 |
| Quadrant-wise count rates Data is divided into 100 sec bins |
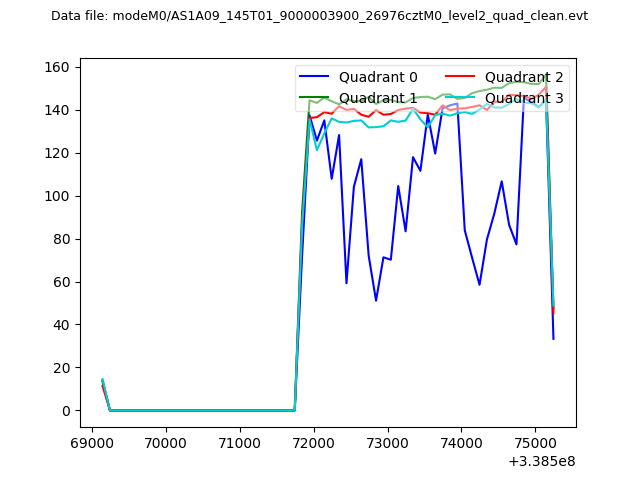 |
|
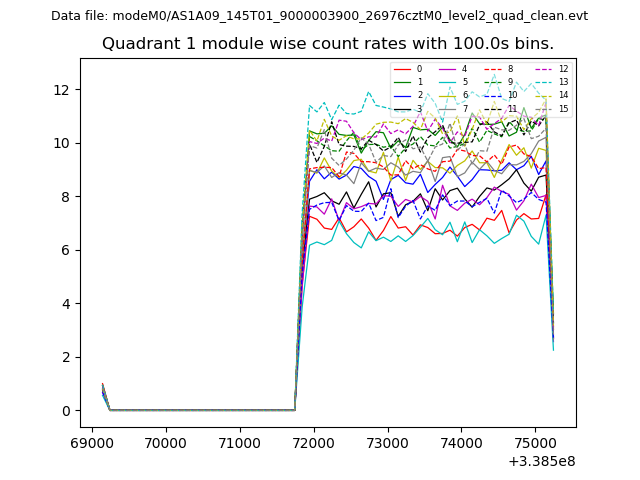
| Module-wise count rates for Quadrant A Data is divided into 100 sec bins |
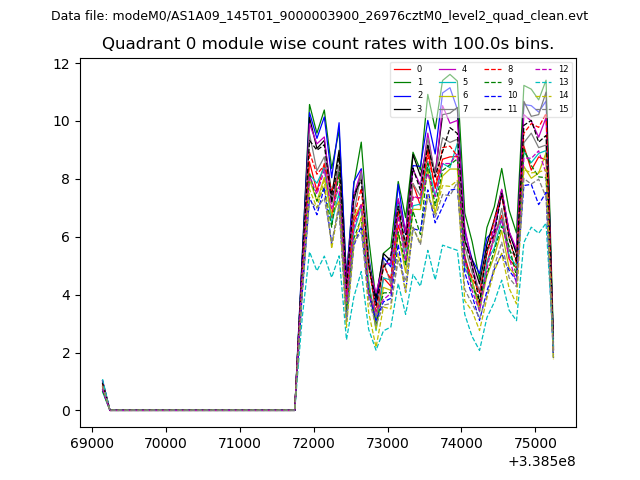 |
 |
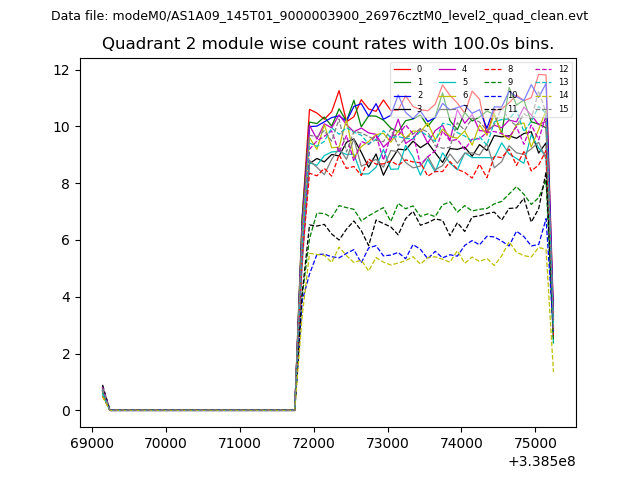
| Module-wise count rates for Quadrant B Data is divided into 100 sec bins |
 |
 |
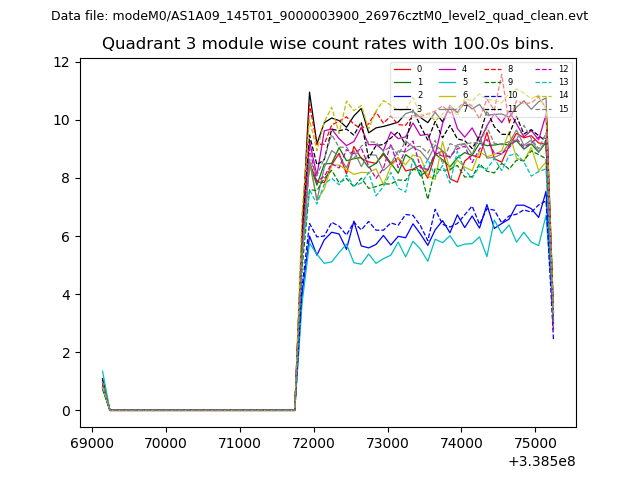
| Module-wise count rates for Quadrant C Data is divided into 100 sec bins |
 |
 |
| Module-wise count rates for Quadrant D Data is divided into 100 sec bins |
 |
 |
| Parameter | Plot |
|---|---|
| CZT HV Monitor | 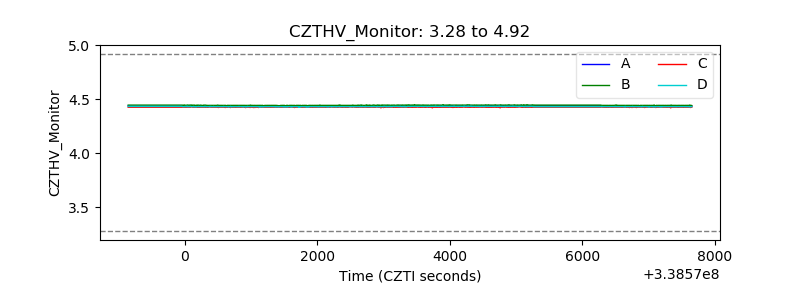 |
| D_VDD | 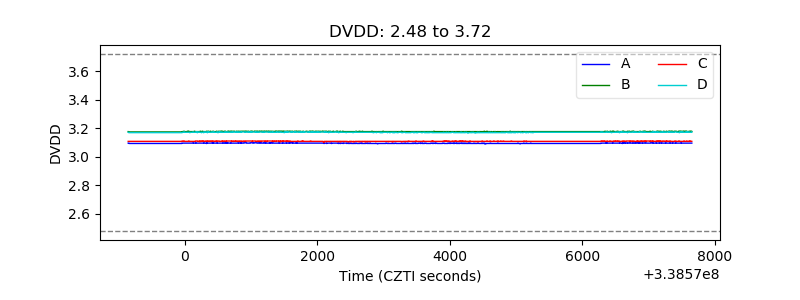 |
| Temperature 1 | 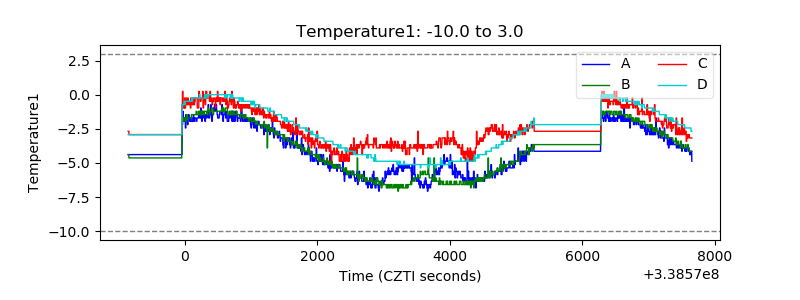 |
| Veto HV Monitor | 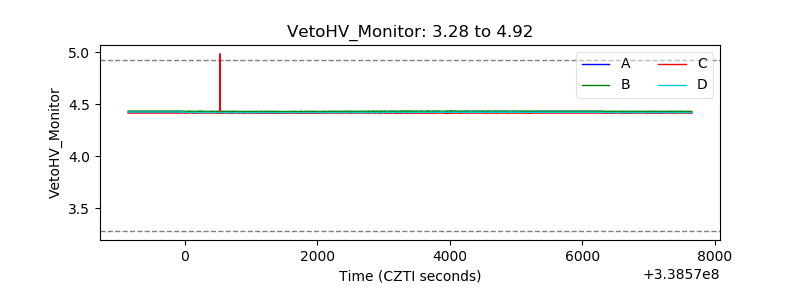 |
| Veto LLD | 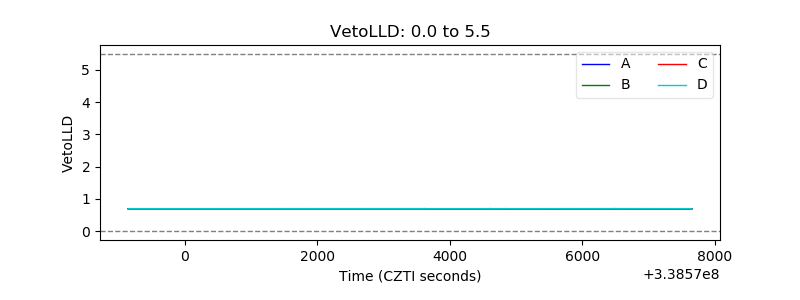 |
| Alpha Counter |  |
| _CPM_Rate | 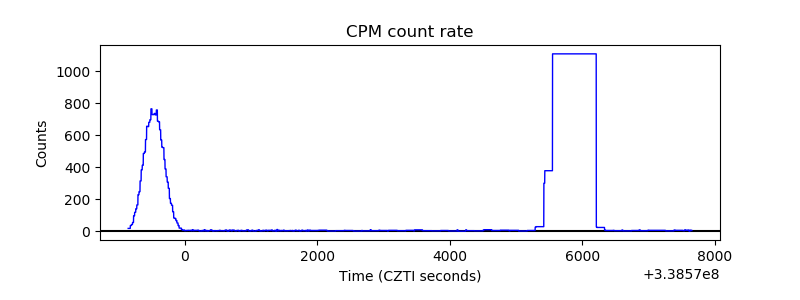 |
| CZT Counter | 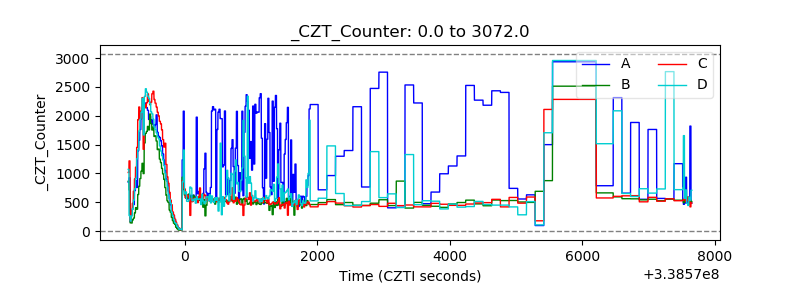 |
| +2.5 Volts monitor |  |
| +5 Volts monitor | 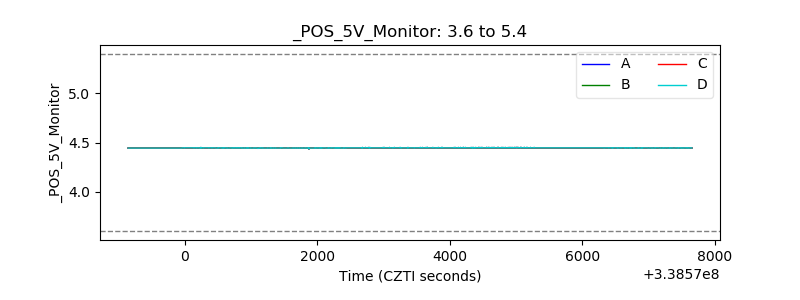 |
| _ROLL_ROT | 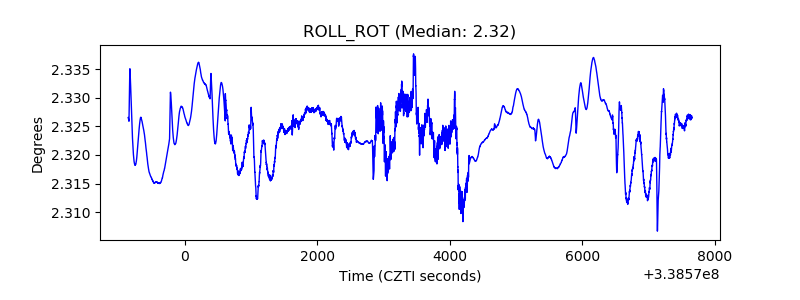 |
| _Roll_DEC | 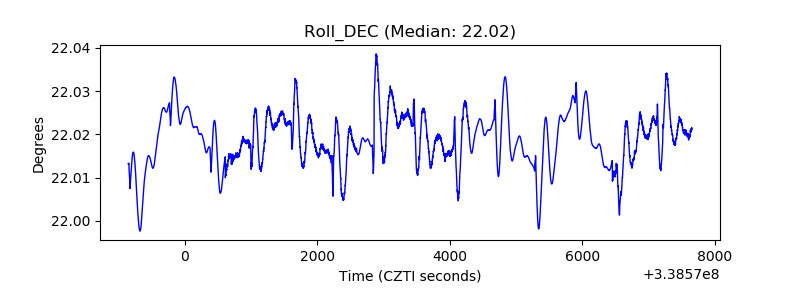 |
| _Roll_RA | 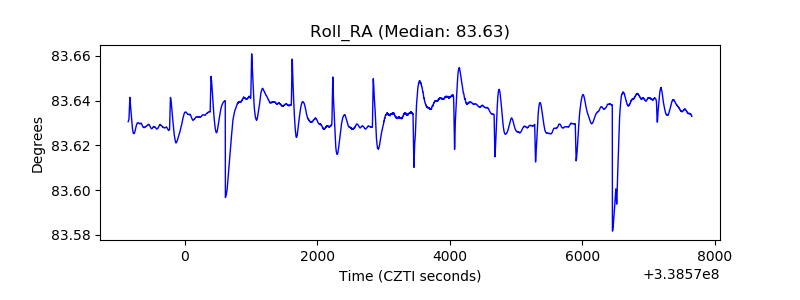 |
| Veto Counter | 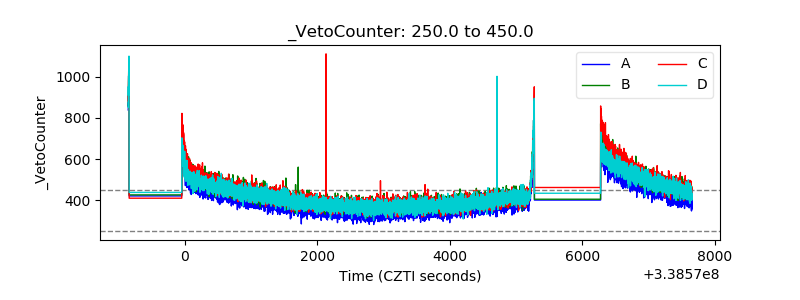 |