| Param | Original file | Final file |
|---|---|---|
| Filename | modeM0/AS1A09_145T01_9000003900_26978cztM0_level2.evt | modeM0/AS1A09_145T01_9000003900_26978cztM0_level2_quad_clean.evt |
| Size (bytes) | 580,705,920 | 89,530,560 |
| Size | 553.8 MB | 85.4 MB |
| Events in quadrant A | 5,826,905 | 543,059 |
| Events in quadrant B | 3,344,934 | 595,980 |
| Events in quadrant C | 3,415,129 | 573,333 |
| Events in quadrant D | 4,569,736 | 555,540 |
| Mode M0 | |||
|---|---|---|---|
| Quadrant | BADHDUFLAG | Total packets | Discarded packets |
| A | 0 | 21640 | 0 |
| B | 0 | 13860 | 0 |
| C | 0 | 14101 | 0 |
| D | 0 | 17823 | 0 |
| Mode M9 | |||
|---|---|---|---|
| Quadrant | BADHDUFLAG | Total packets | Discarded packets |
| A | 0 | 11 | 0 |
| B | 0 | 11 | 0 |
| C | 0 | 11 | 0 |
| D | 0 | 11 | 0 |
| Quadrant | Total seconds | Saturated seconds | Saturation percentage |
|---|---|---|---|
| A | 6347 | 799 | 12.588625% |
| B | 6347 | 37 | 0.582953% |
| C | 6347 | 102 | 1.607058% |
| D | 6347 | 257 | 4.049157% |
Noise dominated data is calculated using 1-second bins in cleaned event files. If a bin has >2000 counts, and if more than 50% of those come from <1% of pixels, then it is considered to be noise-dominated and hence unusable.
| Quadrant | # 1 sec bins | Bins with >0 counts | Bins with >2000 counts | High rate bins dominated by noise | Noise dominated (total time) | Noise dominated (detector-on time) | Marked lightcurve |
|---|---|---|---|---|---|---|---|
| A | 7477 | 6347 | 516 | 516 | 6.90% | 8.13% | 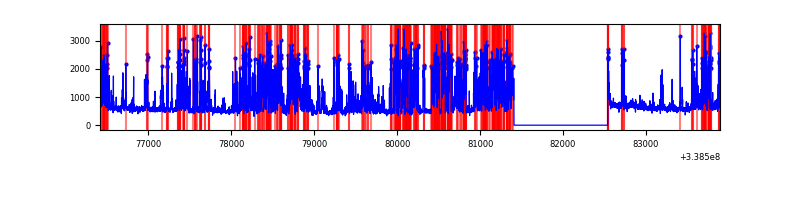 |
| B | 7477 | 6347 | 2 | 2 | 0.03% | 0.03% | 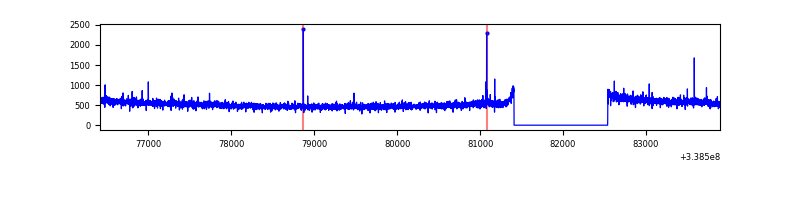 |
| C | 7477 | 6348 | 14 | 14 | 0.19% | 0.22% | 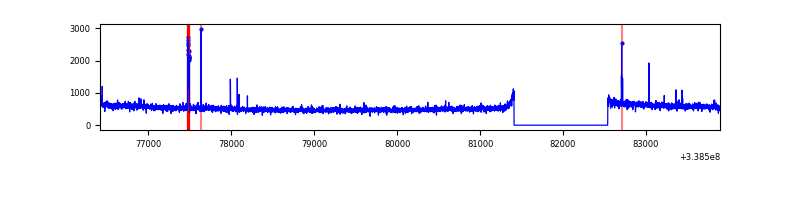 |
| D | 7477 | 6347 | 191 | 191 | 2.55% | 3.01% | 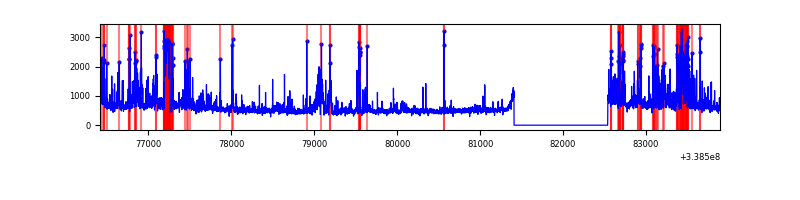 |
Top three noisy pixels from each quadrant. If the there are fewer than three noisy pixels in the level2.evt file, extra rows are filled as -1
| Pixel properties | Quadrant properties | ||||||
|---|---|---|---|---|---|---|---|
| Quadrant | DetID | PixID | Counts | Sigma | Mean | Median | Sigma |
| A | 14 | 235 | 2642425 | 16292.1 | 810 | 799 | 162.1 |
| A | 6 | 16 | 39335 | 237.67 | 810 | 799 | 162.1 |
| A | 8 | 192 | 13772 | 80.01 | 810 | 799 | 162.1 |
| B | 12 | 111 | 18629 | 111.67 | 847 | 830 | 159.4 |
| B | 11 | 111 | 16500 | 98.31 | 847 | 830 | 159.4 |
| B | 14 | 111 | 14298 | 84.5 | 847 | 830 | 159.4 |
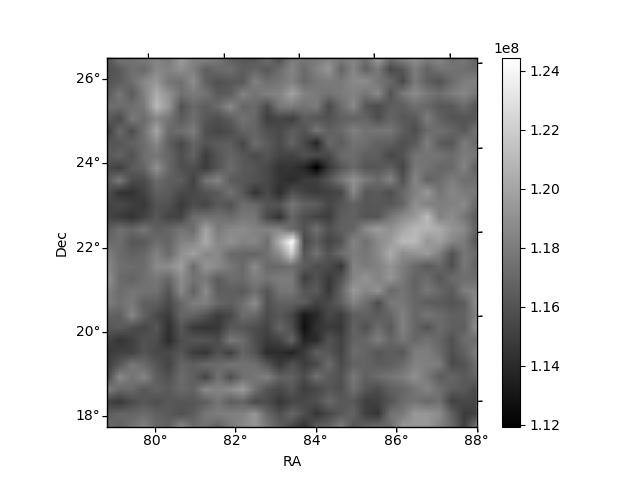
| C | 14 | 238 | 131374 | 675.03 | 822 | 831 | 193.4 |
| C | 15 | 208 | 54335 | 276.66 | 822 | 831 | 193.4 |
| C | 2 | 16 | 24801 | 123.95 | 822 | 831 | 193.4 |
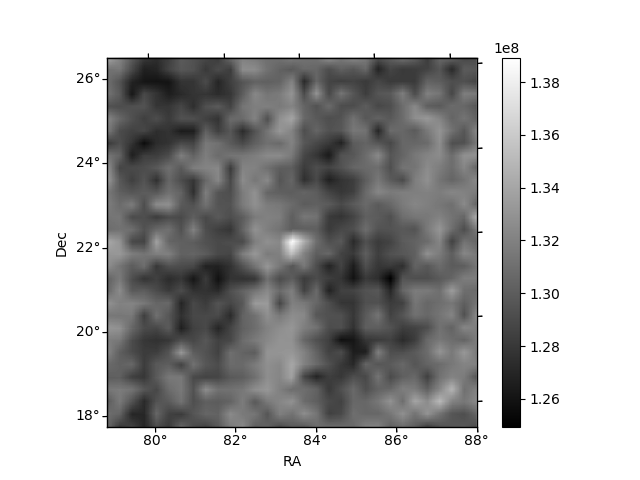
| D | 1 | 52 | 1111980 | 5743.96 | 815 | 797 | 193.5 |
| D | 2 | 250 | 173575 | 893.13 | 815 | 797 | 193.5 |
| D | 7 | 38 | 53229 | 271.03 | 815 | 797 | 193.5 |
Histogram calculated using DETX and DETY for each event in the final _common_clean file
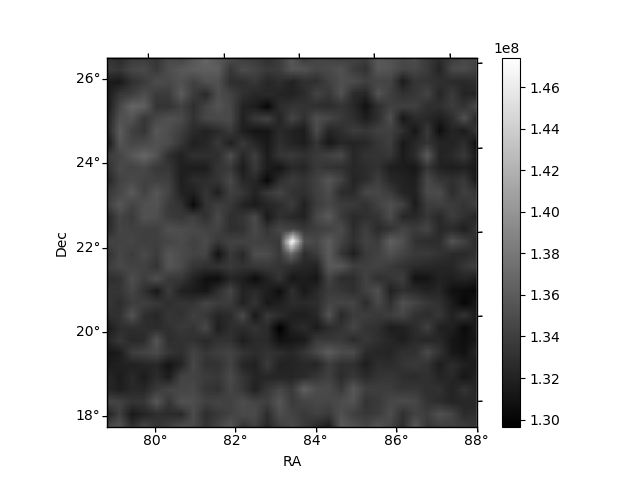
| Quadrant A |  |
 |
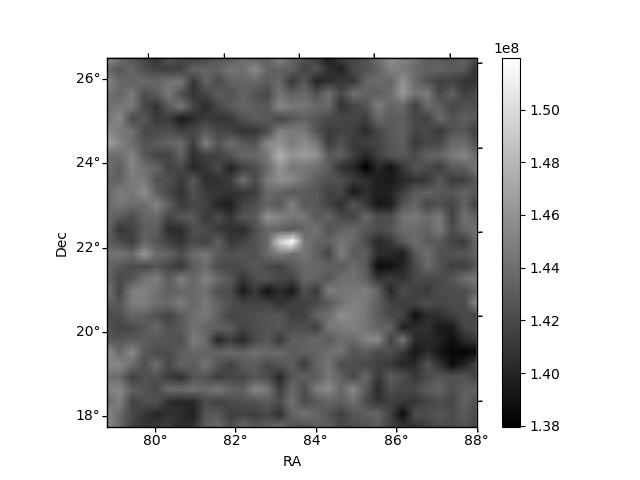
Quadrant B |
|---|---|---|---|
| Quadrant D | 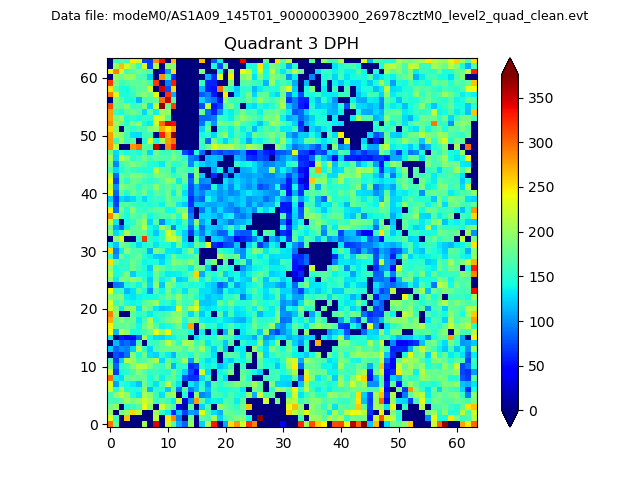 |
 |
Quadrant C |
| Plot type | Count rate plots | Images |
|---|---|---|
| Comparison with Poisson distribution Blue bars denote a histogram of data divided into 1 sec bins. Red curve is a Poisson curve with rate = median count rate of data. |
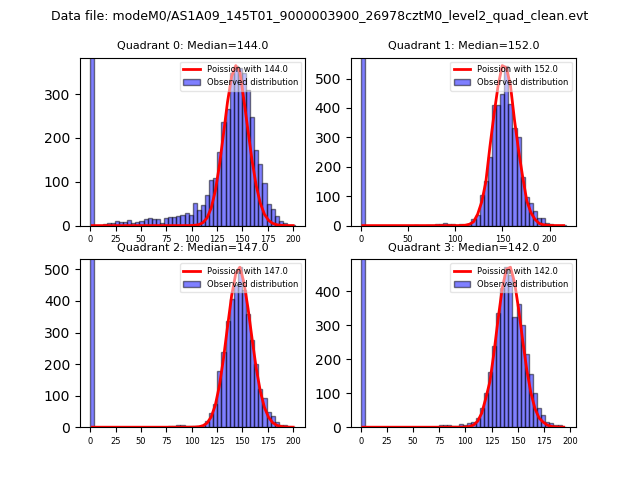 |
 |
| Quadrant-wise count rates Data is divided into 100 sec bins |
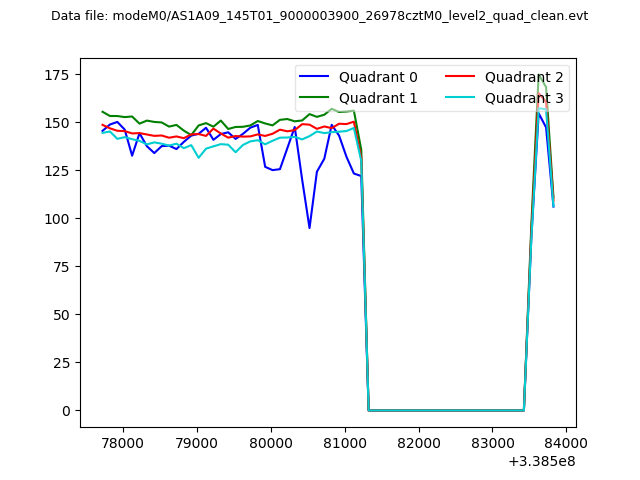 |
|
| Module-wise count rates for Quadrant A Data is divided into 100 sec bins |
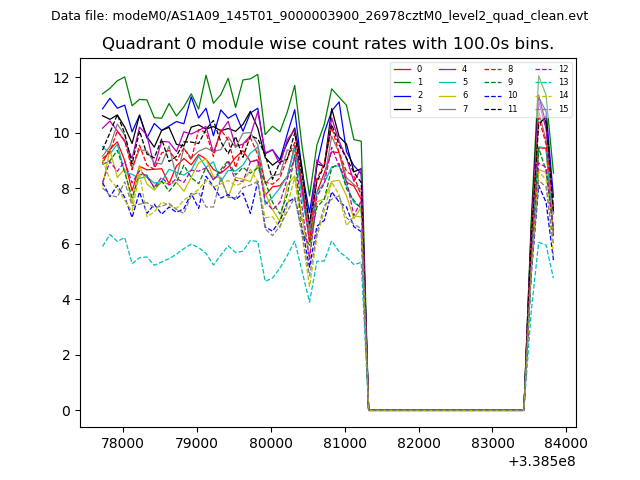 |
 |
| Module-wise count rates for Quadrant B Data is divided into 100 sec bins |
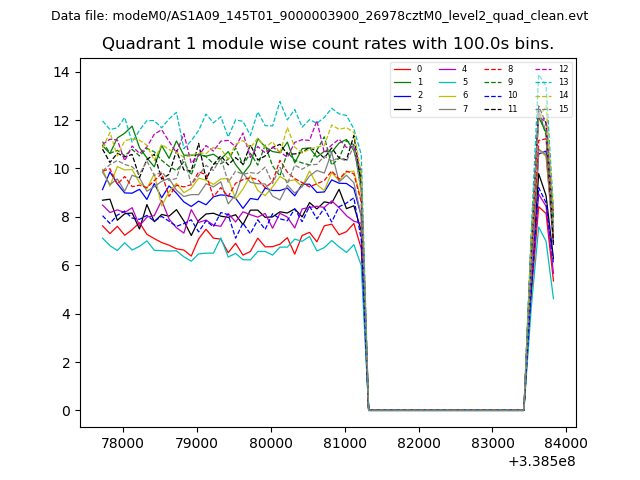 |
 |
| Module-wise count rates for Quadrant C Data is divided into 100 sec bins |
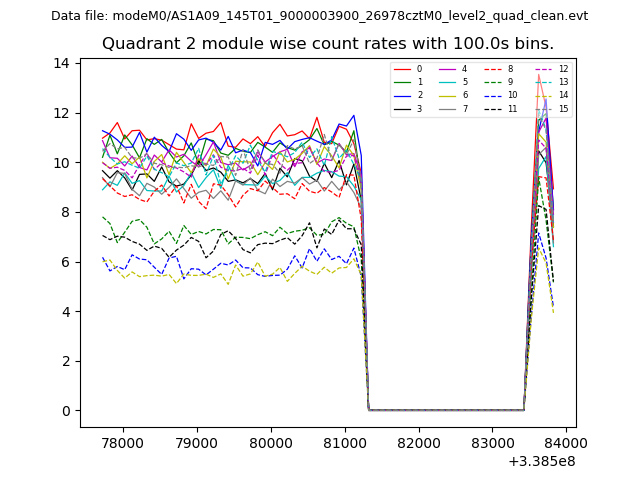 |
 |
| Module-wise count rates for Quadrant D Data is divided into 100 sec bins |
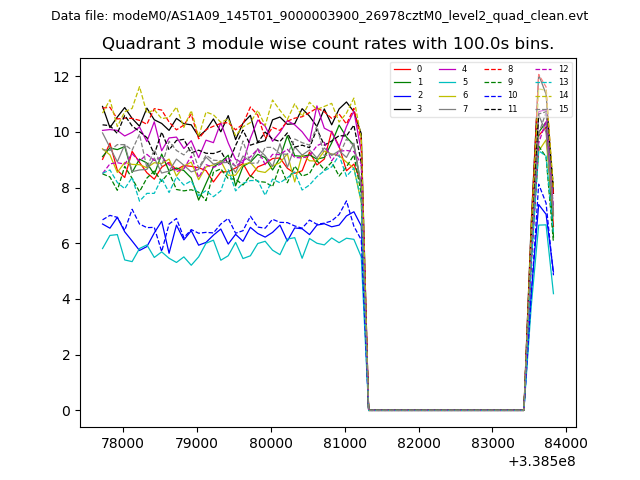 |
 |
| Parameter | Plot |
|---|---|
| CZT HV Monitor | 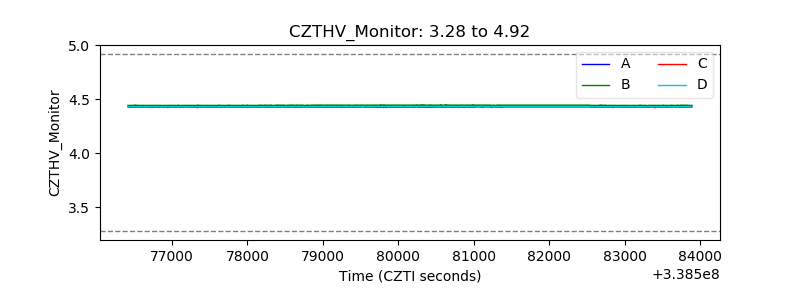 |
| D_VDD | 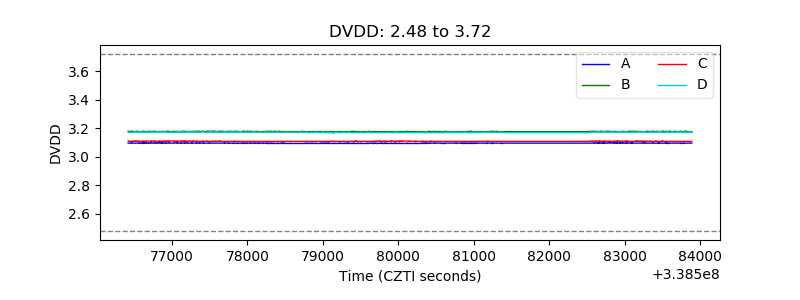 |
| Temperature 1 | 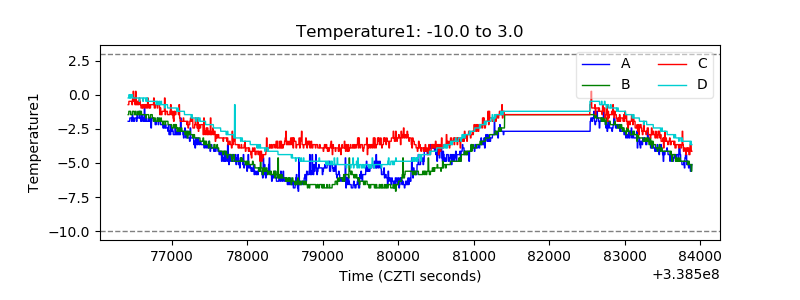 |
| Veto HV Monitor | 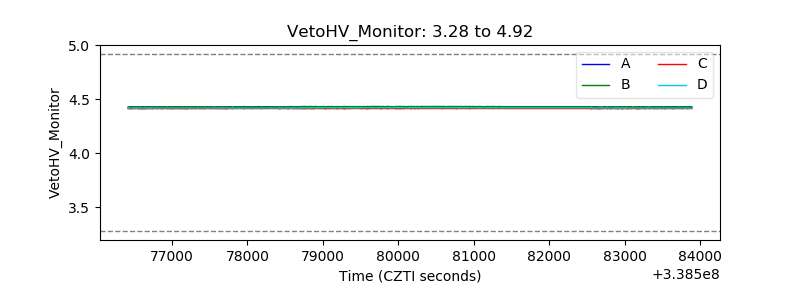 |
| Veto LLD |  |
| Alpha Counter | 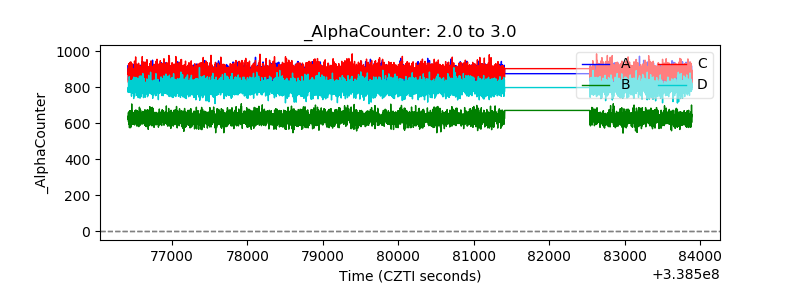 |
| _CPM_Rate | 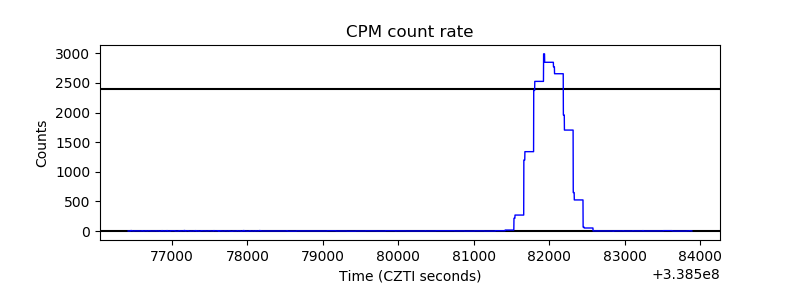 |
| CZT Counter | 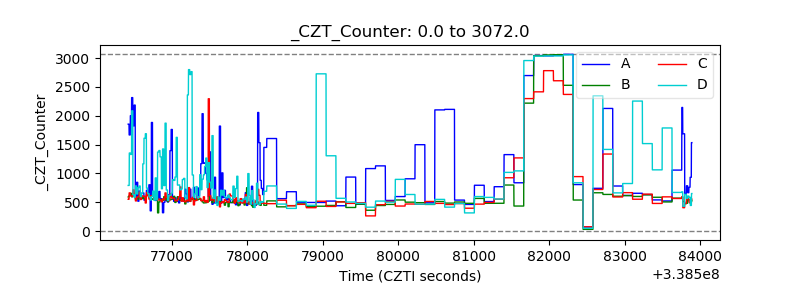 |
| +2.5 Volts monitor |  |
| +5 Volts monitor | 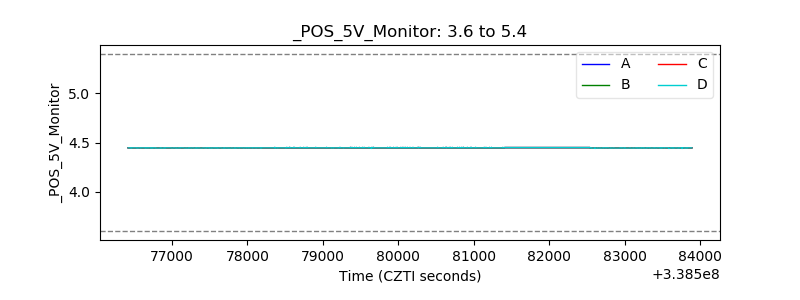 |
| _ROLL_ROT | 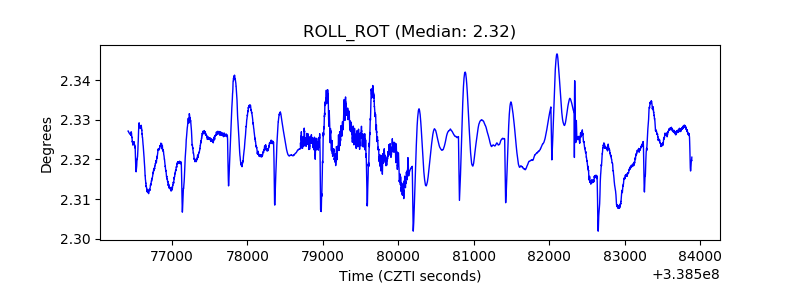 |
| _Roll_DEC | 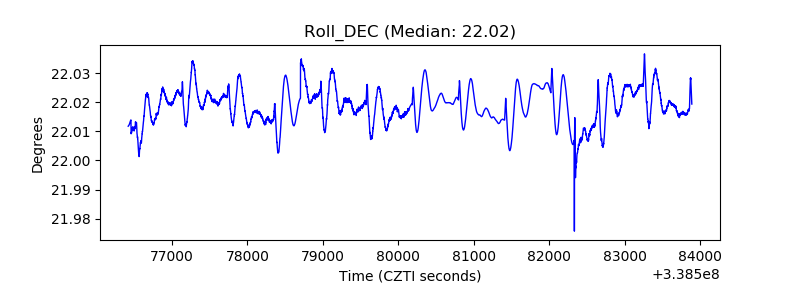 |
| _Roll_RA | 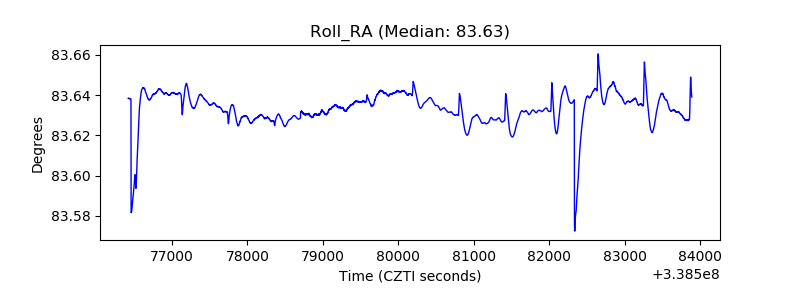 |
| Veto Counter | 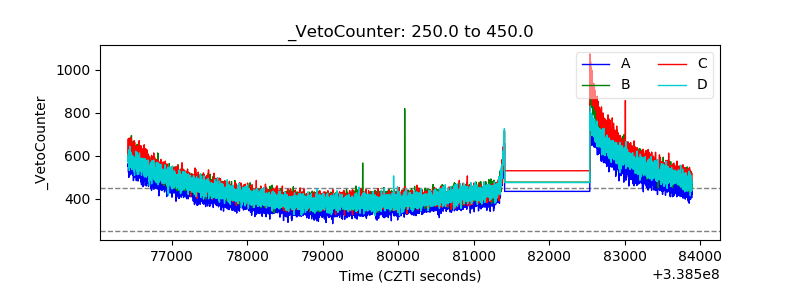 |