| Param | Original file | Final file |
|---|---|---|
| Filename | modeM0/AS1A09_145T01_9000003900_26979cztM0_level2.evt | modeM0/AS1A09_145T01_9000003900_26979cztM0_level2_quad_clean.evt |
| Size (bytes) | 671,279,040 | 98,380,800 |
| Size | 640.2 MB | 93.8 MB |
| Events in quadrant A | 8,366,366 | 516,934 |
| Events in quadrant B | 3,488,741 | 698,085 |
| Events in quadrant C | 3,564,733 | 672,070 |
| Events in quadrant D | 4,479,439 | 647,572 |
| Mode M0 | |||
|---|---|---|---|
| Quadrant | BADHDUFLAG | Total packets | Discarded packets |
| A | 0 | 29366 | 0 |
| B | 0 | 14433 | 0 |
| C | 0 | 14721 | 0 |
| D | 0 | 17587 | 0 |
| Mode M9 | |||
|---|---|---|---|
| Quadrant | BADHDUFLAG | Total packets | Discarded packets |
| A | 0 | 19 | 0 |
| B | 0 | 20 | 0 |
| C | 0 | 20 | 0 |
| D | 0 | 20 | 0 |
| Quadrant | Total seconds | Saturated seconds | Saturation percentage |
|---|---|---|---|
| A | 6367 | 2228 | 34.992932% |
| B | 6366 | 57 | 0.895382% |
| C | 6366 | 114 | 1.790763% |
| D | 6366 | 241 | 3.785737% |
Noise dominated data is calculated using 1-second bins in cleaned event files. If a bin has >2000 counts, and if more than 50% of those come from <1% of pixels, then it is considered to be noise-dominated and hence unusable.
| Quadrant | # 1 sec bins | Bins with >0 counts | Bins with >2000 counts | High rate bins dominated by noise | Noise dominated (total time) | Noise dominated (detector-on time) | Marked lightcurve |
|---|---|---|---|---|---|---|---|
| A | 7591 | 6366 | 1752 | 1752 | 23.08% | 27.52% | 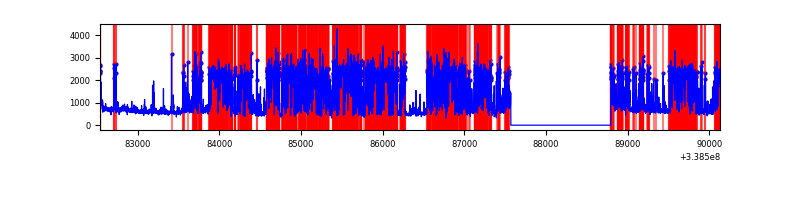 |
| B | 7591 | 6366 | 0 | 0 | 0.00% | 0.00% | 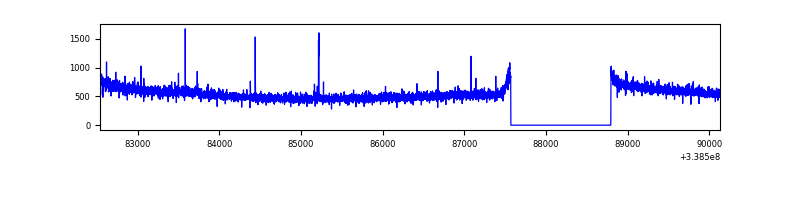 |
| C | 7591 | 6366 | 3 | 3 | 0.04% | 0.05% | 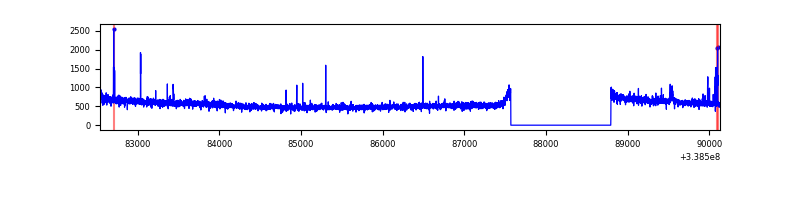 |
| D | 7591 | 6366 | 148 | 148 | 1.95% | 2.32% | 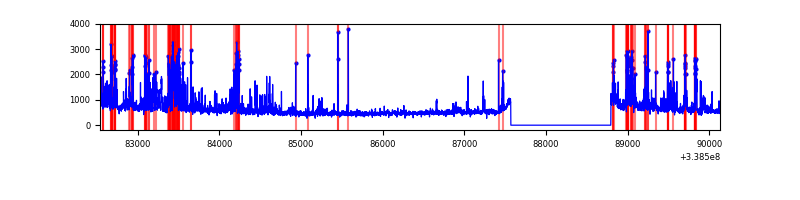 |
Top three noisy pixels from each quadrant. If the there are fewer than three noisy pixels in the level2.evt file, extra rows are filled as -1
| Pixel properties | Quadrant properties | ||||||
|---|---|---|---|---|---|---|---|
| Quadrant | DetID | PixID | Counts | Sigma | Mean | Median | Sigma |
| A | 14 | 235 | 5416759 | 36607.46 | 743 | 733 | 147.9 |
| A | 6 | 16 | 48586 | 323.44 | 743 | 733 | 147.9 |
| A | 8 | 192 | 24746 | 162.31 | 743 | 733 | 147.9 |
| B | 12 | 111 | 18999 | 108.01 | 887 | 868 | 167.9 |
| B | 11 | 111 | 16893 | 95.46 | 887 | 868 | 167.9 |
| B | 14 | 111 | 14855 | 83.32 | 887 | 868 | 167.9 |
| C | 14 | 238 | 136755 | 676.98 | 863 | 875 | 200.7 |
| C | 2 | 16 | 32512 | 157.62 | 863 | 875 | 200.7 |
| C | 15 | 208 | 25112 | 120.75 | 863 | 875 | 200.7 |
| D | 1 | 52 | 964443 | 4753.17 | 856 | 836 | 202.7 |
| D | 2 | 250 | 167923 | 824.19 | 856 | 836 | 202.7 |
| D | 11 | 176 | 71680 | 349.45 | 856 | 836 | 202.7 |
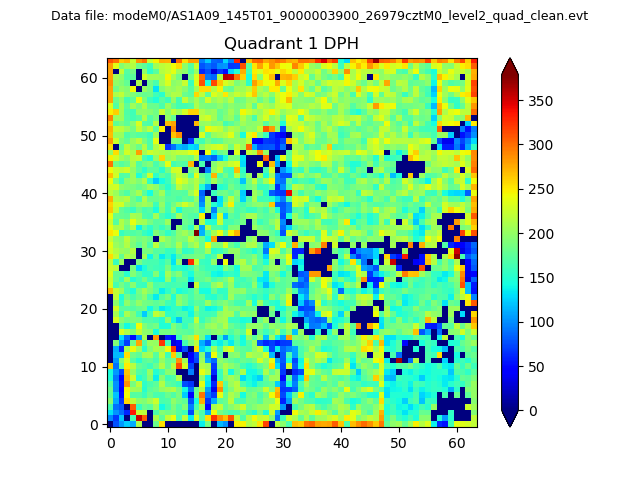
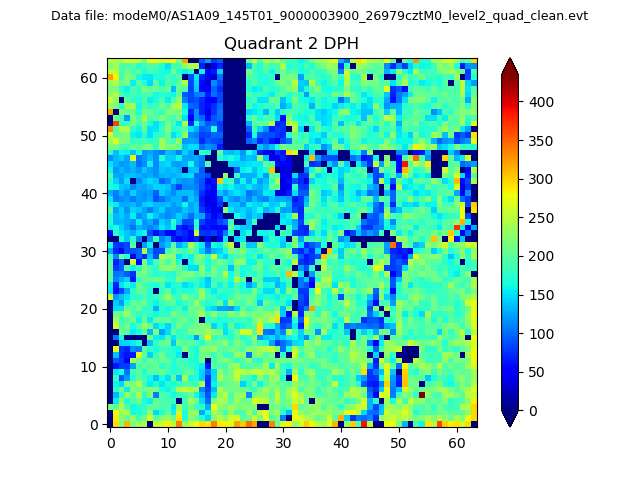
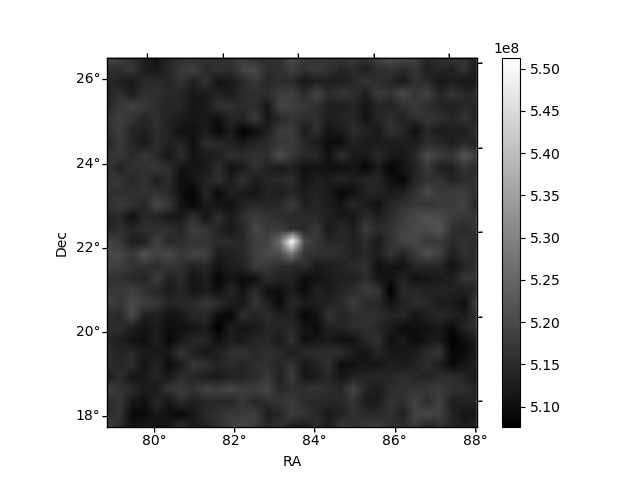
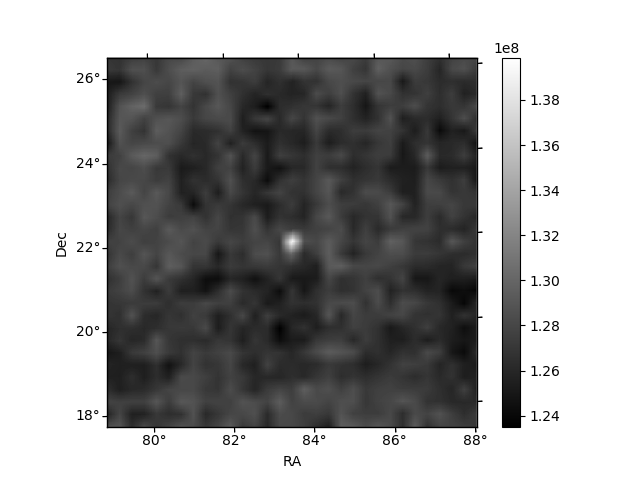
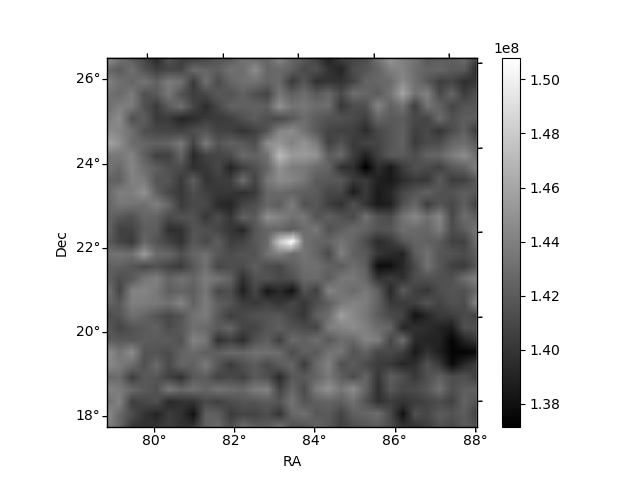
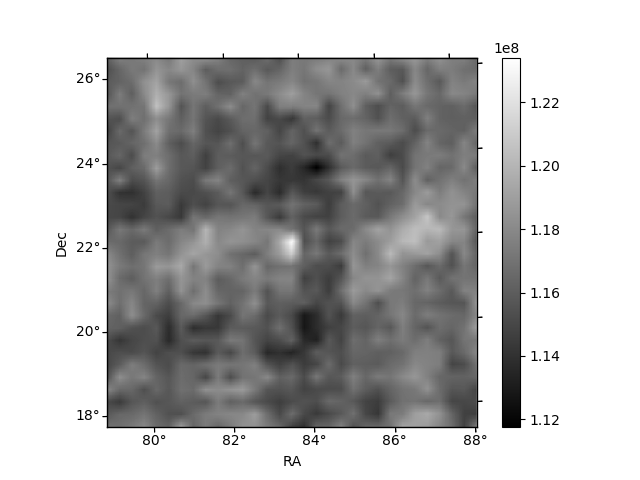
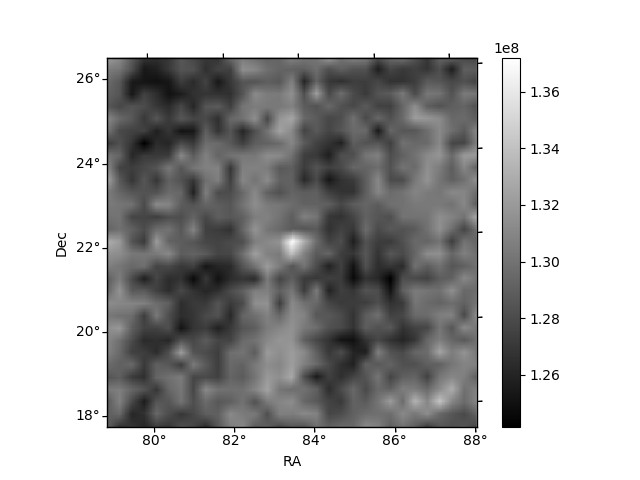
Histogram calculated using DETX and DETY for each event in the final _common_clean file
| Quadrant A |  |
 |
Quadrant B |
|---|---|---|---|
| Quadrant D | 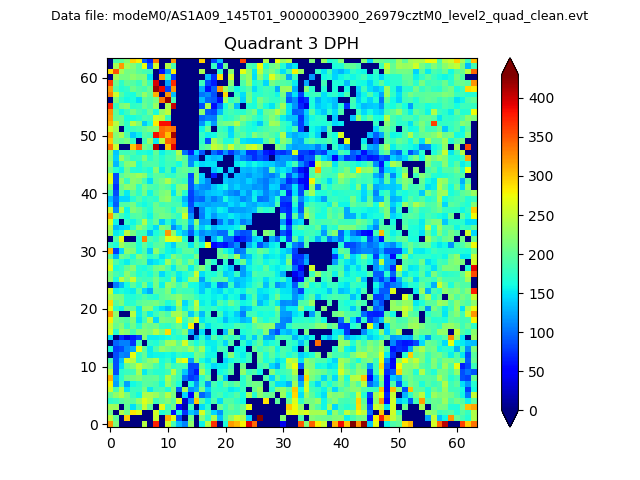 |
 |
Quadrant C |
| Plot type | Count rate plots | Images |
|---|---|---|
| Comparison with Poisson distribution Blue bars denote a histogram of data divided into 1 sec bins. Red curve is a Poisson curve with rate = median count rate of data. |
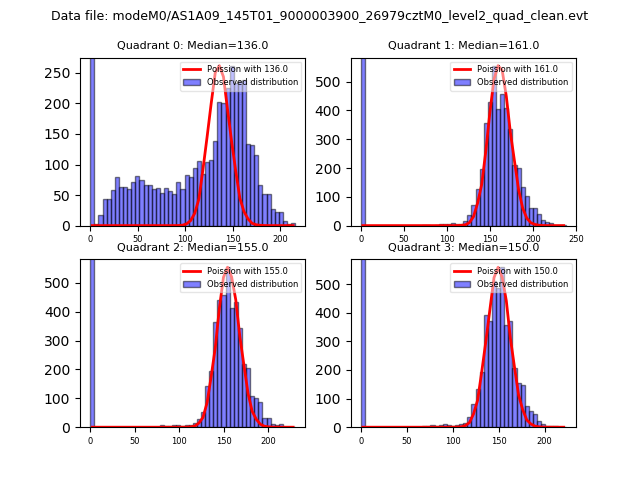 |
 |
| Quadrant-wise count rates Data is divided into 100 sec bins |
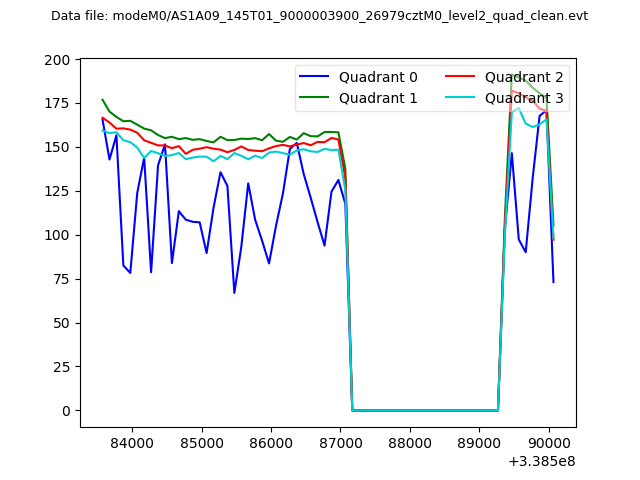 |
|
| Module-wise count rates for Quadrant A Data is divided into 100 sec bins |
 |
 |
| Module-wise count rates for Quadrant B Data is divided into 100 sec bins |
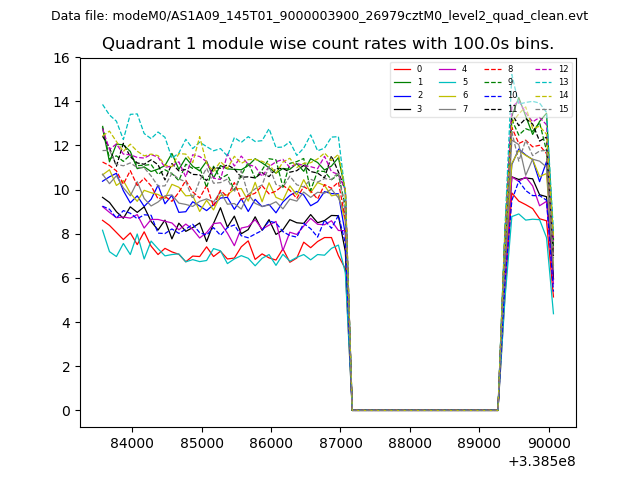 |
 |
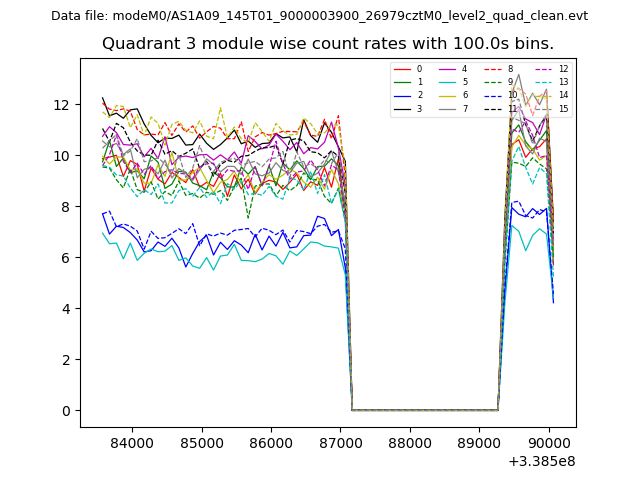
| Module-wise count rates for Quadrant C Data is divided into 100 sec bins |
 |
 |
| Module-wise count rates for Quadrant D Data is divided into 100 sec bins |
 |
 |
| Parameter | Plot |
|---|---|
| CZT HV Monitor | 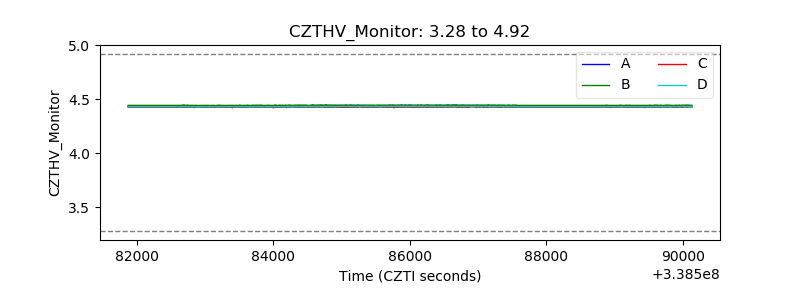 |
| D_VDD | 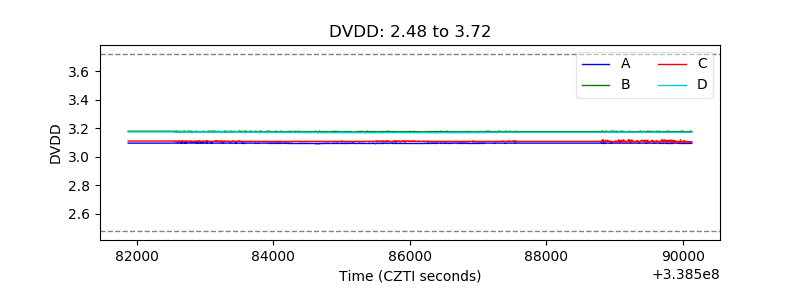 |
| Temperature 1 | 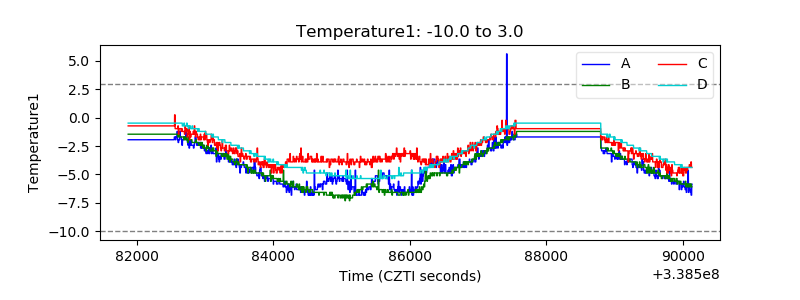 |
| Veto HV Monitor | 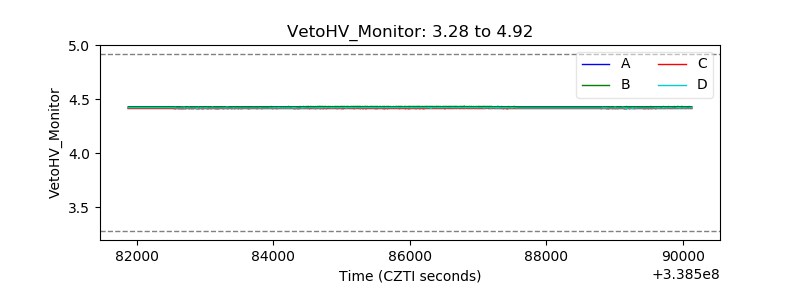 |
| Veto LLD | 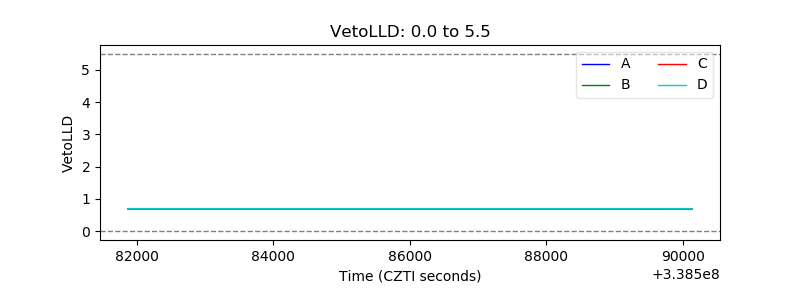 |
| Alpha Counter | 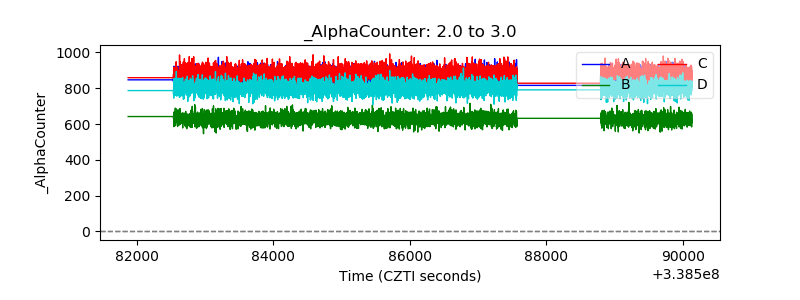 |
| _CPM_Rate | 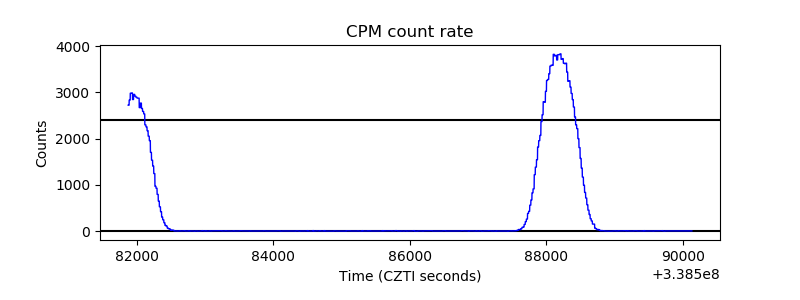 |
| CZT Counter | 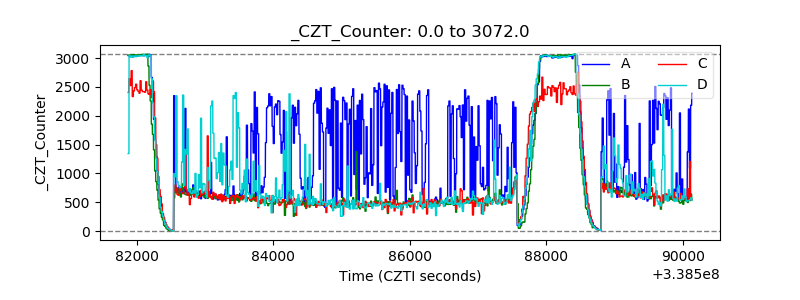 |
| +2.5 Volts monitor |  |
| +5 Volts monitor | 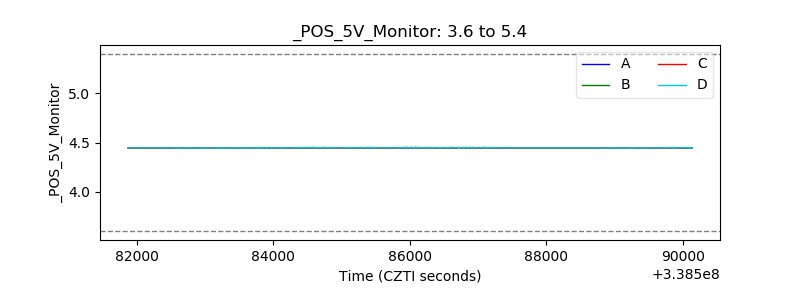 |
| _ROLL_ROT | 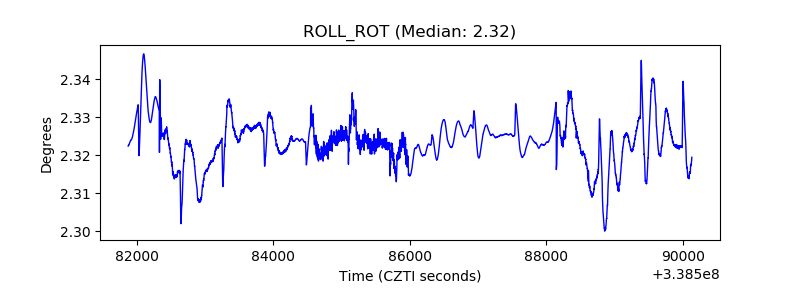 |
| _Roll_DEC | 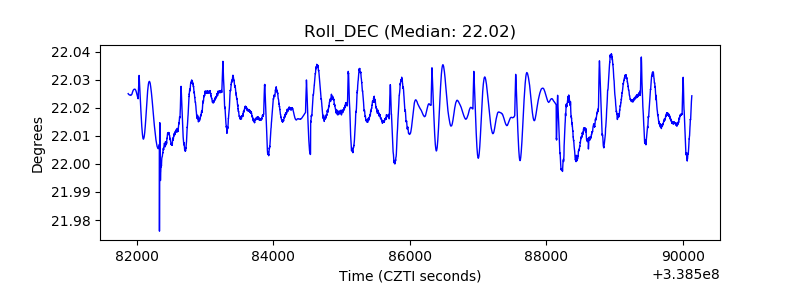 |
| _Roll_RA | 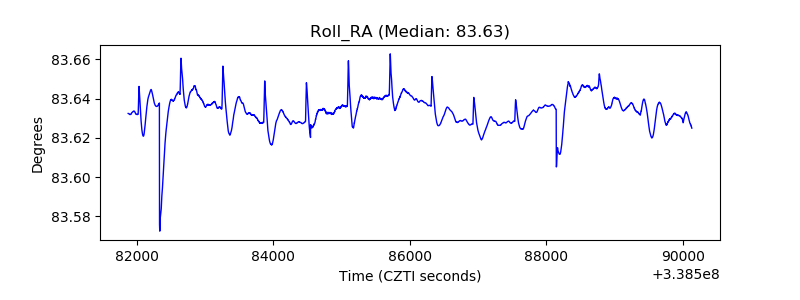 |
| Veto Counter | 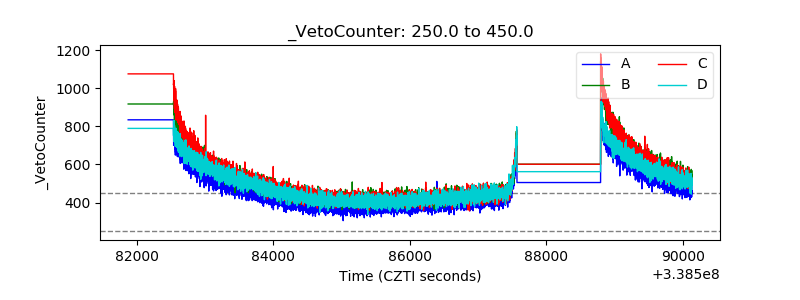 |