| Param | Original file | Final file |
|---|---|---|
| Filename | modeM0/AS1A09_145T01_9000003900_26980cztM0_level2.evt | modeM0/AS1A09_145T01_9000003900_26980cztM0_level2_quad_clean.evt |
| Size (bytes) | 736,718,400 | 107,530,560 |
| Size | 702.6 MB | 102.5 MB |
| Events in quadrant A | 10,372,781 | 505,862 |
| Events in quadrant B | 3,483,008 | 807,891 |
| Events in quadrant C | 3,598,632 | 770,441 |
| Events in quadrant D | 4,436,377 | 736,986 |
| Mode M0 | |||
|---|---|---|---|
| Quadrant | BADHDUFLAG | Total packets | Discarded packets |
| A | 0 | 35189 | 0 |
| B | 0 | 14358 | 0 |
| C | 0 | 14704 | 0 |
| D | 0 | 17287 | 0 |
| Mode M9 | |||
|---|---|---|---|
| Quadrant | BADHDUFLAG | Total packets | Discarded packets |
| A | 0 | 14 | 0 |
| B | 0 | 15 | 0 |
| C | 0 | 15 | 0 |
| D | 0 | 15 | 0 |
| Quadrant | Total seconds | Saturated seconds | Saturation percentage |
|---|---|---|---|
| A | 6225 | 3294 | 52.915663% |
| B | 6225 | 59 | 0.947791% |
| C | 6225 | 105 | 1.686747% |
| D | 6225 | 194 | 3.116466% |
Noise dominated data is calculated using 1-second bins in cleaned event files. If a bin has >2000 counts, and if more than 50% of those come from <1% of pixels, then it is considered to be noise-dominated and hence unusable.
| Quadrant | # 1 sec bins | Bins with >0 counts | Bins with >2000 counts | High rate bins dominated by noise | Noise dominated (total time) | Noise dominated (detector-on time) | Marked lightcurve |
|---|---|---|---|---|---|---|---|
| A | 7540 | 6226 | 2822 | 2822 | 37.43% | 45.33% | 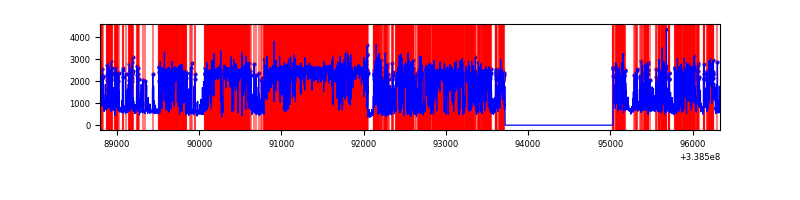 |
| B | 7540 | 6226 | 0 | 0 | 0.00% | 0.00% | 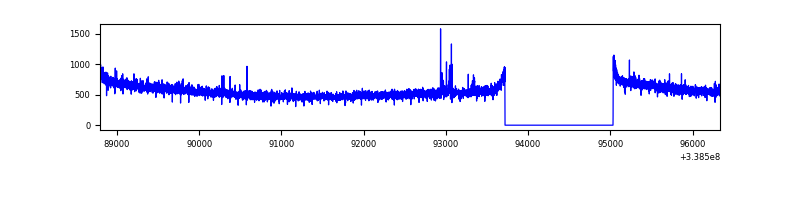 |
| C | 7540 | 6225 | 6 | 6 | 0.08% | 0.10% | 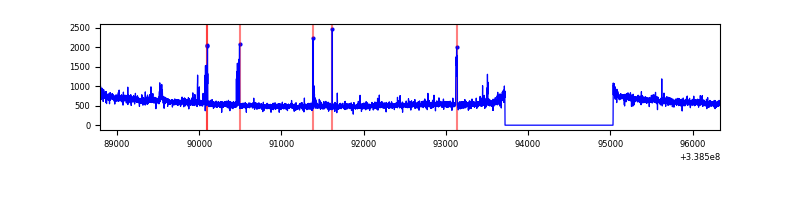 |
| D | 7540 | 6226 | 129 | 129 | 1.71% | 2.07% | 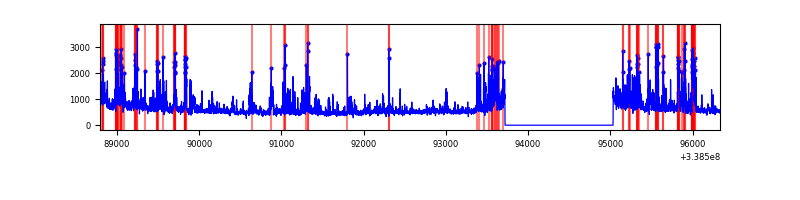 |
Top three noisy pixels from each quadrant. If the there are fewer than three noisy pixels in the level2.evt file, extra rows are filled as -1
| Pixel properties | Quadrant properties | ||||||
|---|---|---|---|---|---|---|---|
| Quadrant | DetID | PixID | Counts | Sigma | Mean | Median | Sigma |
| A | 14 | 235 | 7650188 | 60229.79 | 635 | 625 | 127.0 |
| A | 6 | 16 | 240248 | 1886.7 | 635 | 625 | 127.0 |
| A | 8 | 192 | 24058 | 184.5 | 635 | 625 | 127.0 |
| B | 12 | 111 | 19006 | 109.37 | 884 | 866 | 165.9 |
| B | 11 | 111 | 16783 | 95.97 | 884 | 866 | 165.9 |
| B | 14 | 111 | 15141 | 86.07 | 884 | 866 | 165.9 |
| C | 14 | 238 | 137965 | 690.83 | 856 | 870 | 198.5 |
| C | 2 | 16 | 63929 | 317.76 | 856 | 870 | 198.5 |
| C | 15 | 208 | 38324 | 188.73 | 856 | 870 | 198.5 |
| D | 1 | 52 | 973718 | 4807.45 | 847 | 829 | 202.4 |
| D | 2 | 250 | 210845 | 1037.78 | 847 | 829 | 202.4 |
| D | 2 | 234 | 29485 | 141.6 | 847 | 829 | 202.4 |
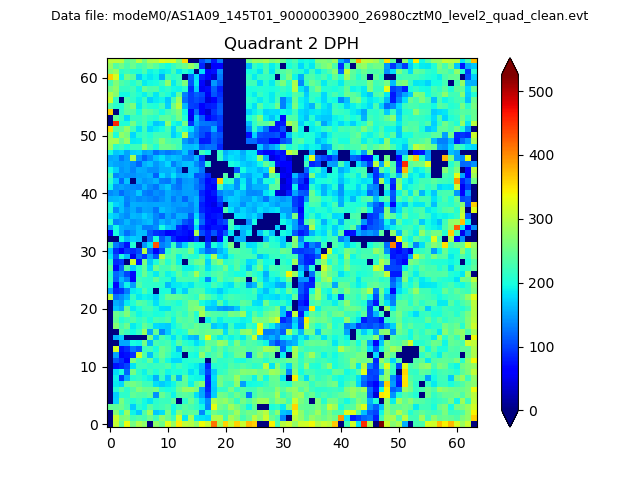
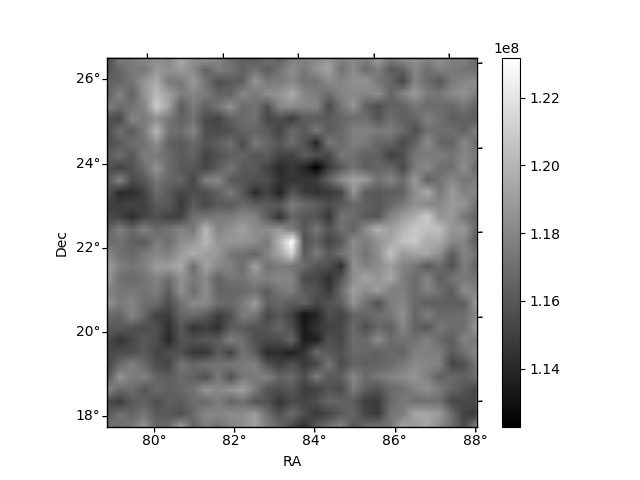
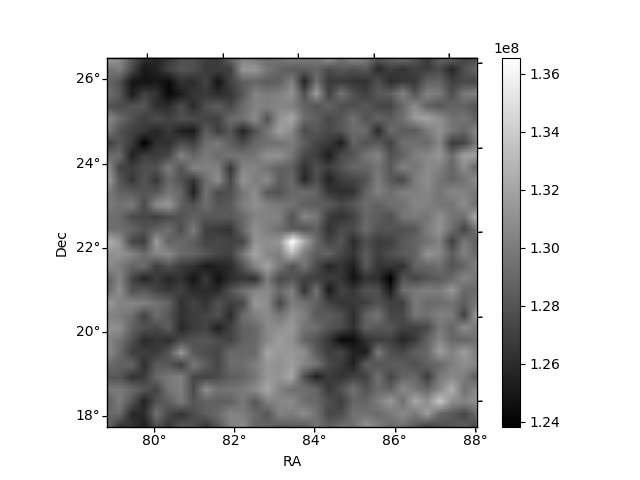
Histogram calculated using DETX and DETY for each event in the final _common_clean file
| Quadrant A | 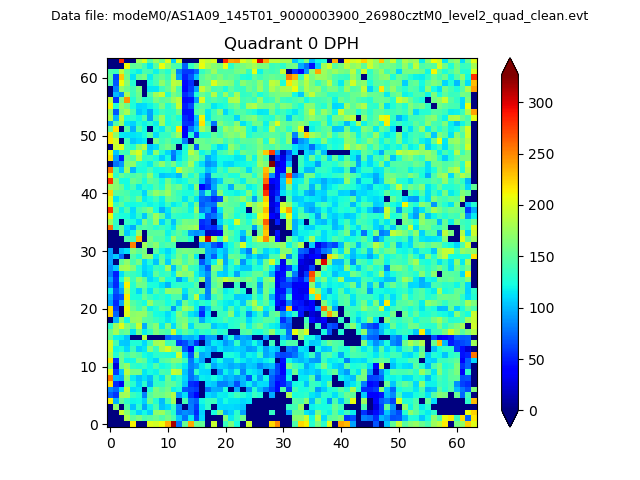 |
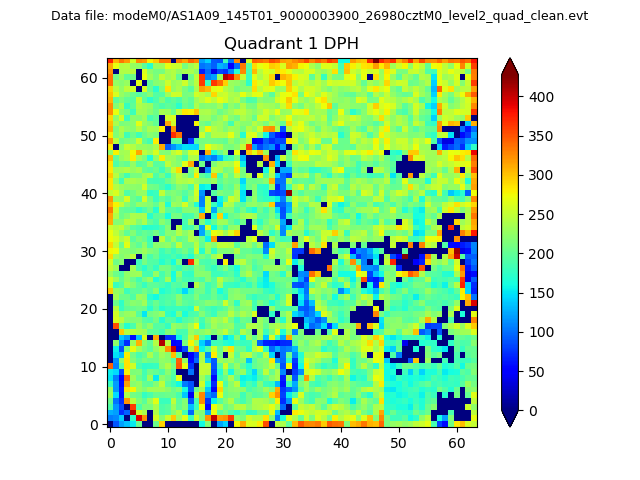 |
Quadrant B |
|---|---|---|---|
| Quadrant D | 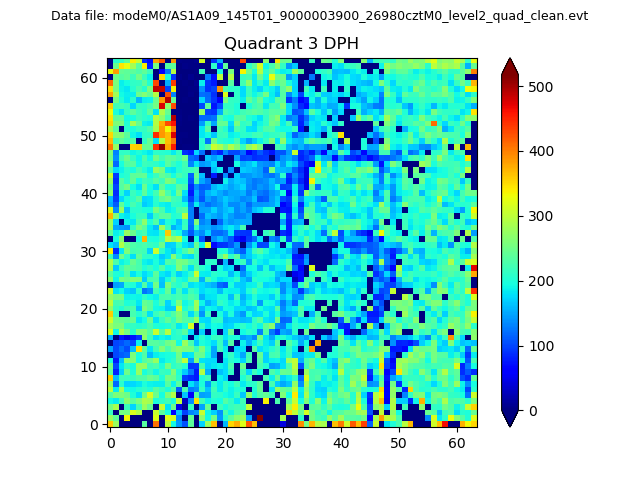 |
 |
Quadrant C |
| Plot type | Count rate plots | Images |
|---|---|---|
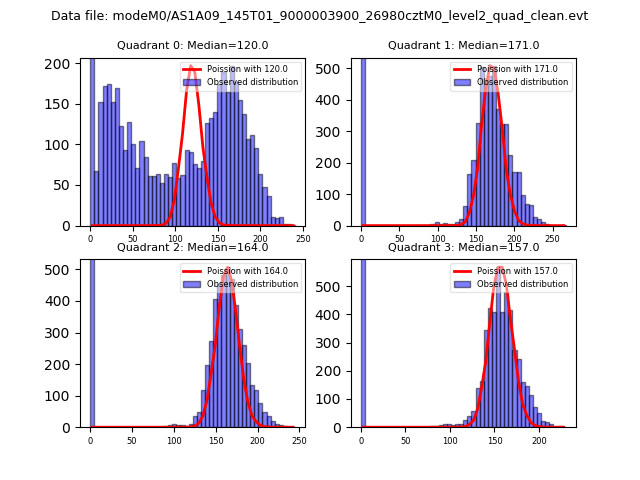
| Comparison with Poisson distribution Blue bars denote a histogram of data divided into 1 sec bins. Red curve is a Poisson curve with rate = median count rate of data. |
 |
 |
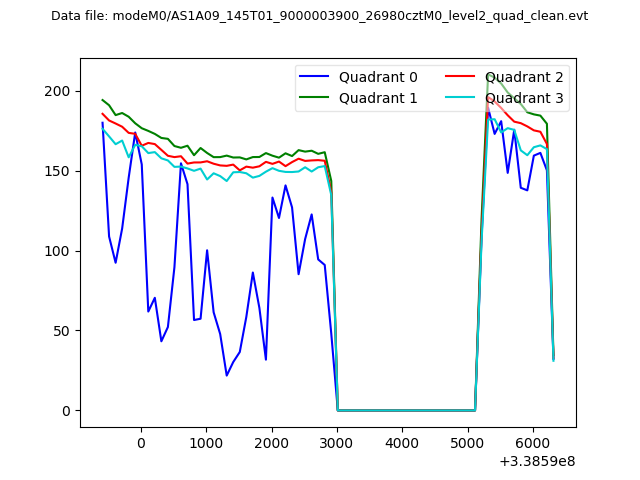
| Quadrant-wise count rates Data is divided into 100 sec bins |
 |
|
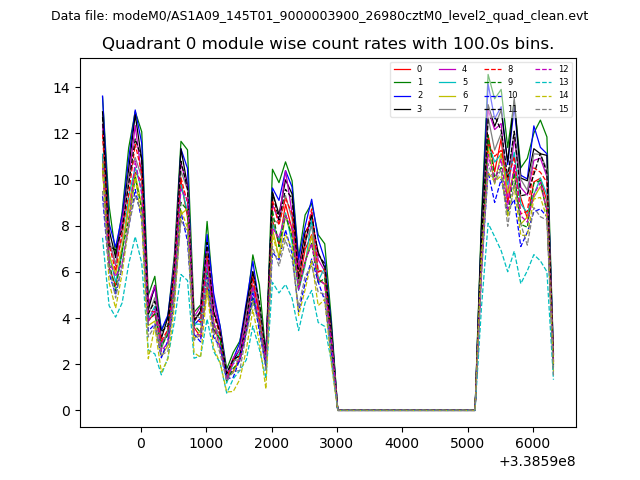
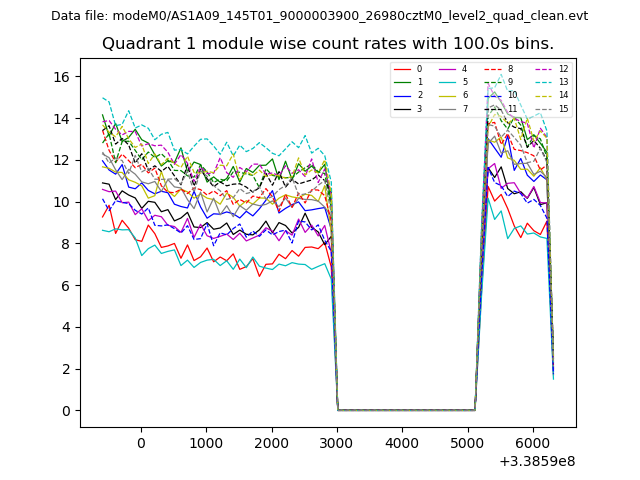
| Module-wise count rates for Quadrant A Data is divided into 100 sec bins |
 |
 |
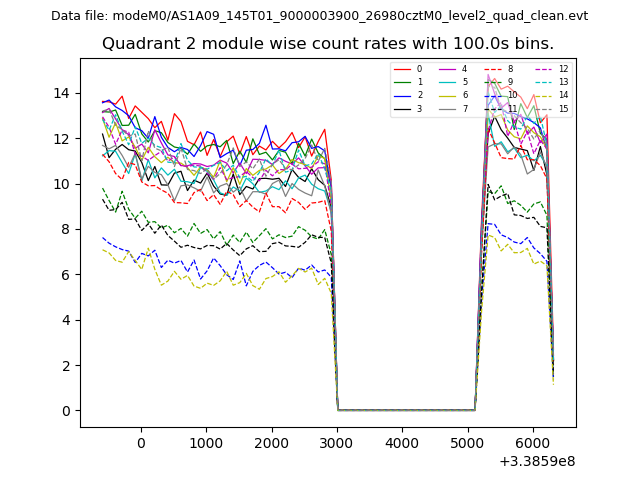
| Module-wise count rates for Quadrant B Data is divided into 100 sec bins |
 |
 |
| Module-wise count rates for Quadrant C Data is divided into 100 sec bins |
 |
 |
| Module-wise count rates for Quadrant D Data is divided into 100 sec bins |
 |
 |
| Parameter | Plot |
|---|---|
| CZT HV Monitor | 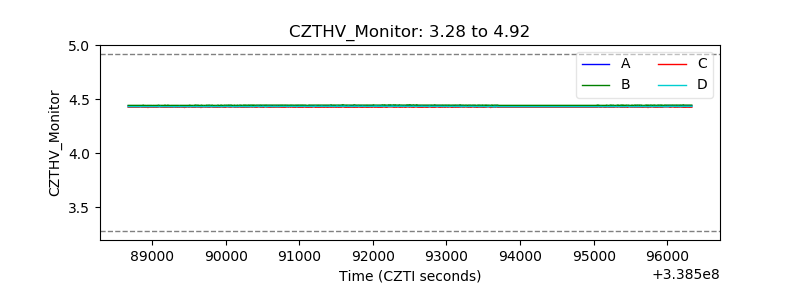 |
| D_VDD | 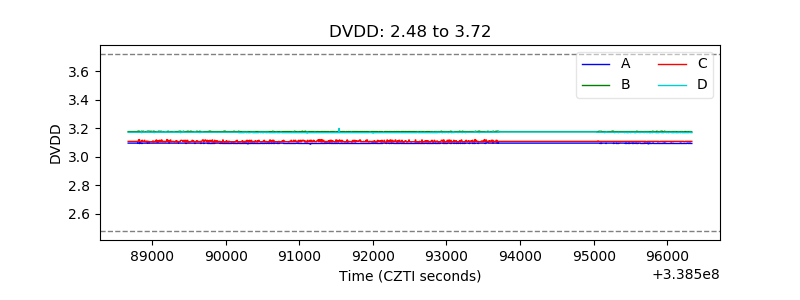 |
| Temperature 1 | 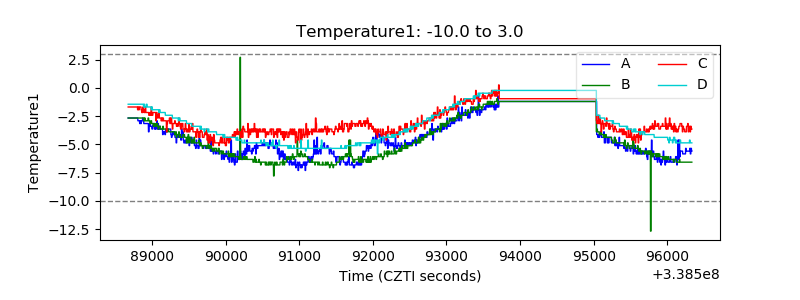 |
| Veto HV Monitor | 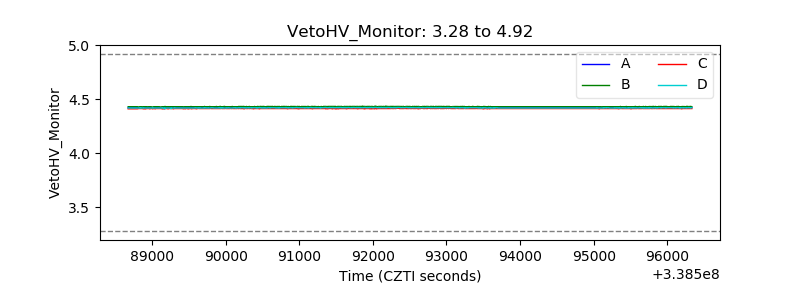 |
| Veto LLD | 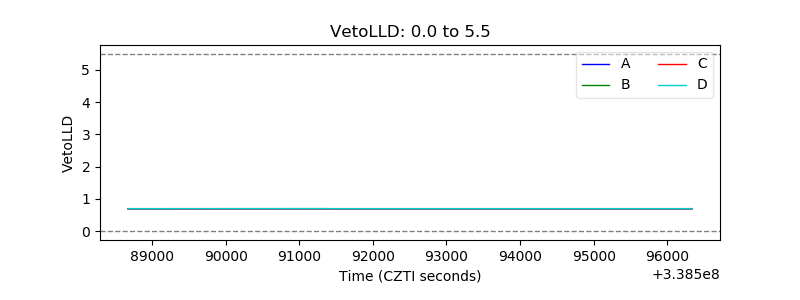 |
| Alpha Counter | 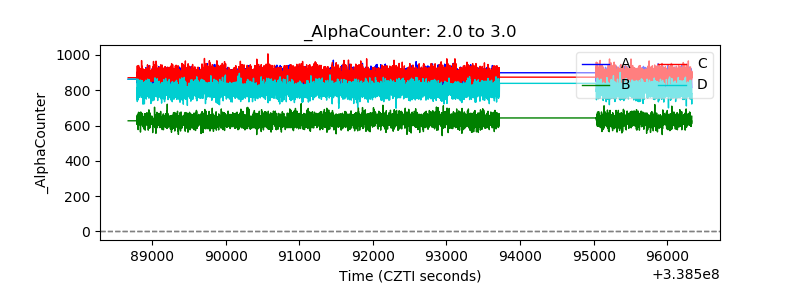 |
| _CPM_Rate | 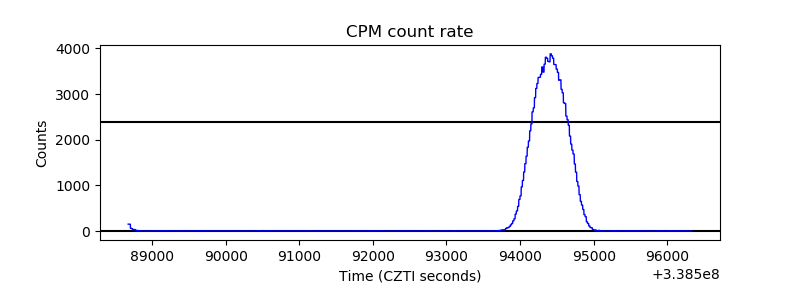 |
| CZT Counter | 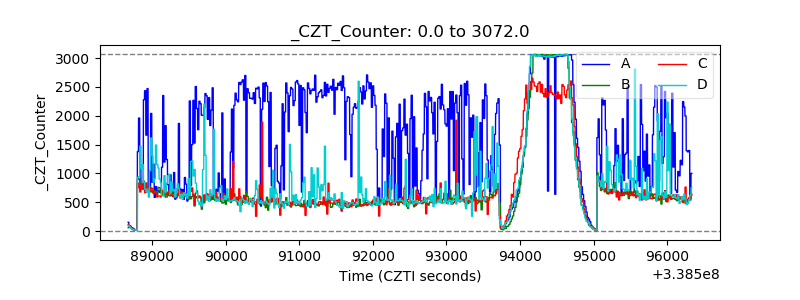 |
| +2.5 Volts monitor |  |
| +5 Volts monitor |  |
| _ROLL_ROT | 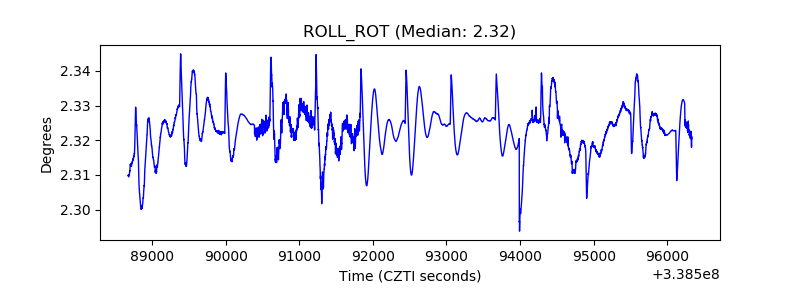 |
| _Roll_DEC |  |
| _Roll_RA | 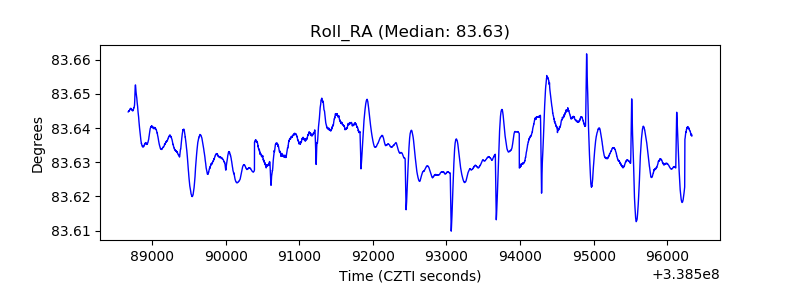 |
| Veto Counter | 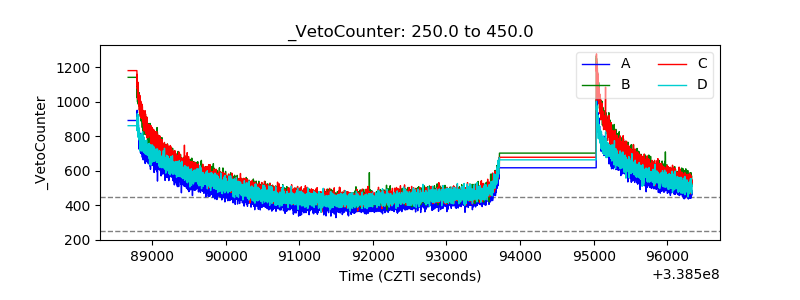 |