| Param | Original file | Final file |
|---|---|---|
| Filename | modeM0/AS1A09_145T01_9000003900_26981cztM0_level2.evt | modeM0/AS1A09_145T01_9000003900_26981cztM0_level2_quad_clean.evt |
| Size (bytes) | 651,294,720 | 117,604,800 |
| Size | 621.1 MB | 112.2 MB |
| Events in quadrant A | 8,540,855 | 646,082 |
| Events in quadrant B | 3,383,676 | 876,034 |
| Events in quadrant C | 3,474,972 | 824,350 |
| Events in quadrant D | 3,910,540 | 787,251 |
| Mode M0 | |||
|---|---|---|---|
| Quadrant | BADHDUFLAG | Total packets | Discarded packets |
| A | 0 | 29543 | 0 |
| B | 0 | 13857 | 0 |
| C | 0 | 14148 | 0 |
| D | 0 | 15633 | 0 |
| Mode M9 | |||
|---|---|---|---|
| Quadrant | BADHDUFLAG | Total packets | Discarded packets |
| A | 0 | 14 | 0 |
| B | 0 | 14 | 0 |
| C | 0 | 14 | 0 |
| D | 0 | 14 | 0 |
| Quadrant | Total seconds | Saturated seconds | Saturation percentage |
|---|---|---|---|
| A | 6123 | 2323 | 37.938919% |
| B | 6124 | 44 | 0.718485% |
| C | 6123 | 111 | 1.812837% |
| D | 6123 | 141 | 2.302793% |
Noise dominated data is calculated using 1-second bins in cleaned event files. If a bin has >2000 counts, and if more than 50% of those come from <1% of pixels, then it is considered to be noise-dominated and hence unusable.
| Quadrant | # 1 sec bins | Bins with >0 counts | Bins with >2000 counts | High rate bins dominated by noise | Noise dominated (total time) | Noise dominated (detector-on time) | Marked lightcurve |
|---|---|---|---|---|---|---|---|
| A | 7488 | 6124 | 1922 | 1922 | 25.67% | 31.38% | 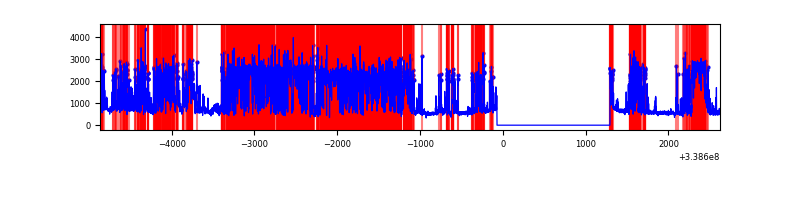 |
| B | 7489 | 6125 | 1 | 1 | 0.01% | 0.02% | 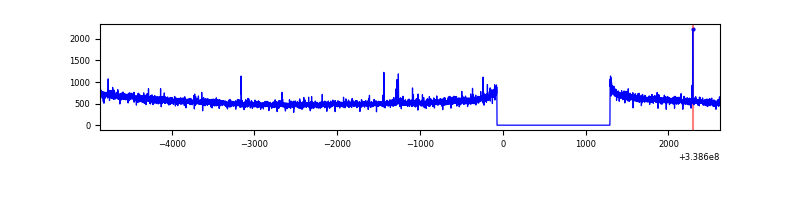 |
| C | 7488 | 6124 | 15 | 15 | 0.20% | 0.24% | 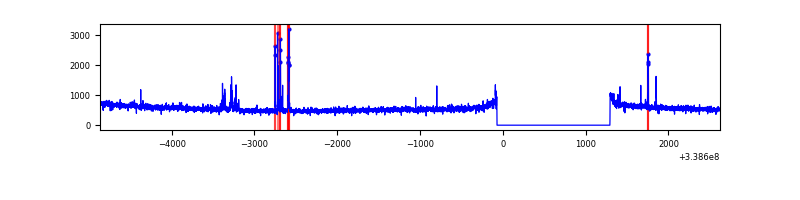 |
| D | 7488 | 6124 | 100 | 100 | 1.34% | 1.63% | 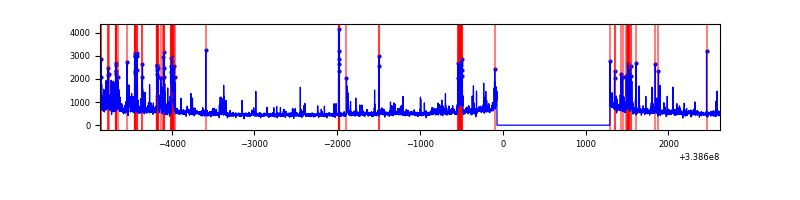 |
Top three noisy pixels from each quadrant. If the there are fewer than three noisy pixels in the level2.evt file, extra rows are filled as -1
| Pixel properties | Quadrant properties | ||||||
|---|---|---|---|---|---|---|---|
| Quadrant | DetID | PixID | Counts | Sigma | Mean | Median | Sigma |
| A | 14 | 235 | 5042826 | 35749.66 | 702 | 693 | 141.0 |
| A | 6 | 16 | 777816 | 5509.94 | 702 | 693 | 141.0 |
| A | 8 | 192 | 11711 | 78.12 | 702 | 693 | 141.0 |
| B | 0 | 219 | 23207 | 139.62 | 858 | 841 | 160.2 |
| B | 12 | 111 | 18348 | 109.29 | 858 | 841 | 160.2 |
| B | 11 | 111 | 16251 | 96.2 | 858 | 841 | 160.2 |
| C | 14 | 238 | 136293 | 707.71 | 825 | 835 | 191.4 |
| C | 15 | 208 | 116199 | 602.73 | 825 | 835 | 191.4 |
| C | 13 | 61 | 5839 | 26.14 | 825 | 835 | 191.4 |
| D | 1 | 52 | 587563 | 2752.35 | 805 | 795 | 213.2 |
| D | 2 | 250 | 205930 | 962.23 | 805 | 795 | 213.2 |
| D | 2 | 234 | 27898 | 127.13 | 805 | 795 | 213.2 |
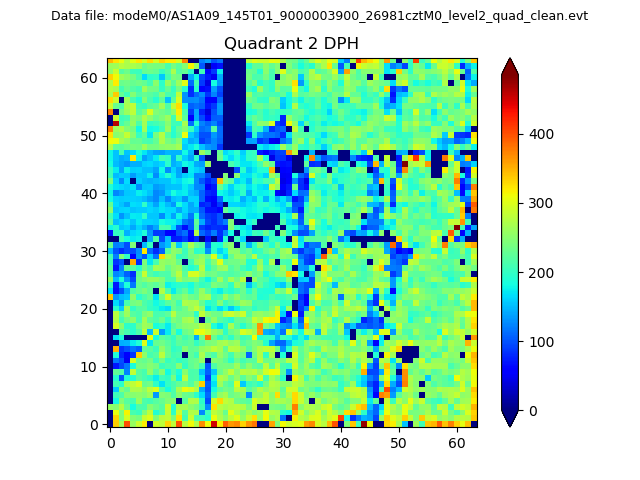
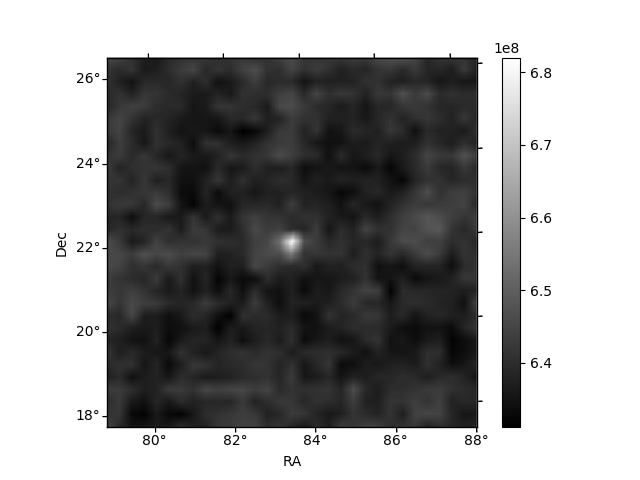
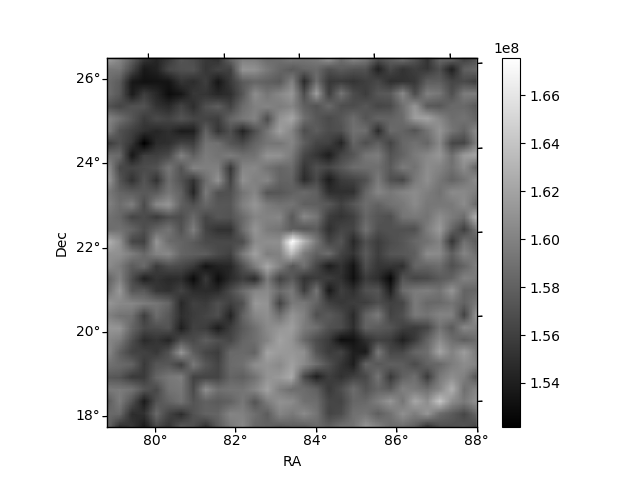
Histogram calculated using DETX and DETY for each event in the final _common_clean file
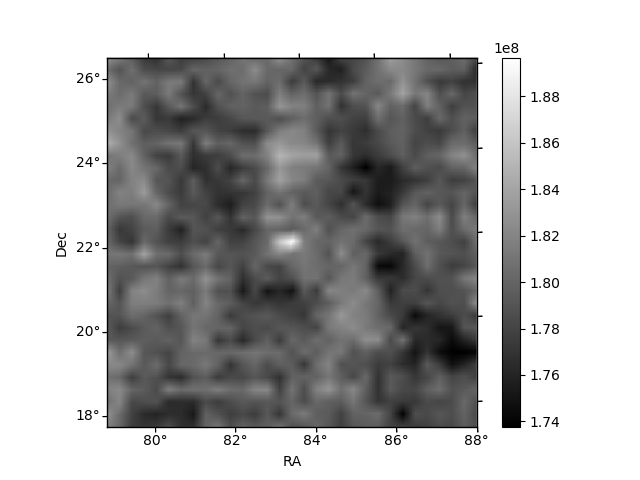
| Quadrant A | 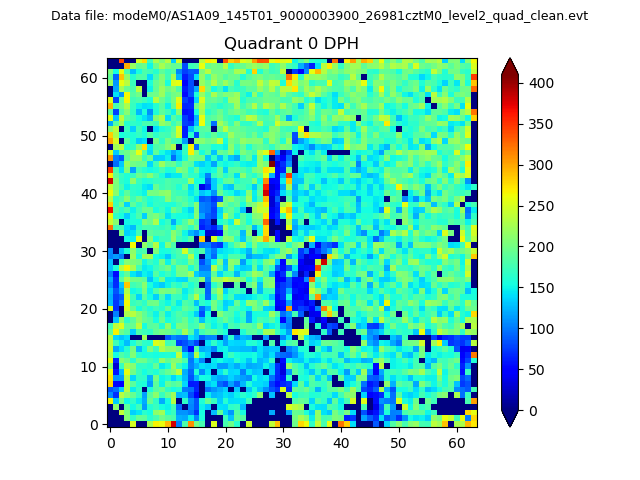 |
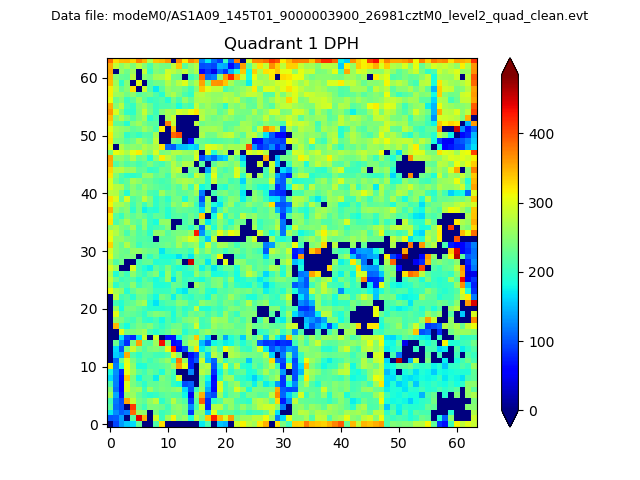 |
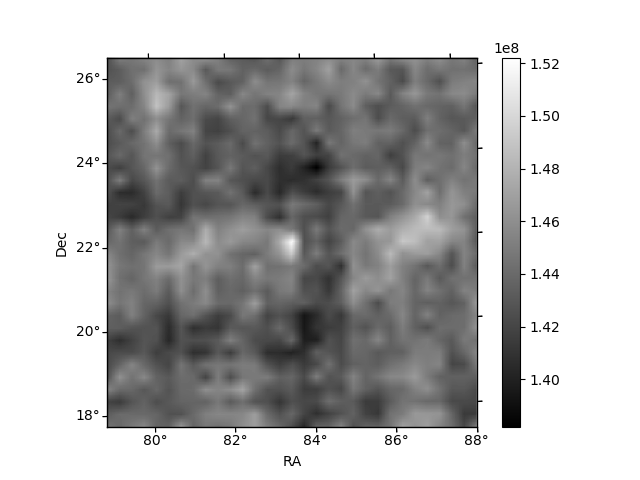
Quadrant B |
|---|---|---|---|
| Quadrant D | 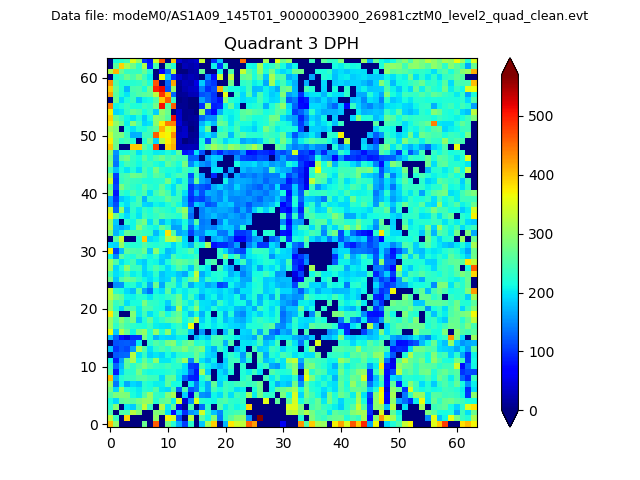 |
 |
Quadrant C |
| Plot type | Count rate plots | Images |
|---|---|---|
| Comparison with Poisson distribution Blue bars denote a histogram of data divided into 1 sec bins. Red curve is a Poisson curve with rate = median count rate of data. |
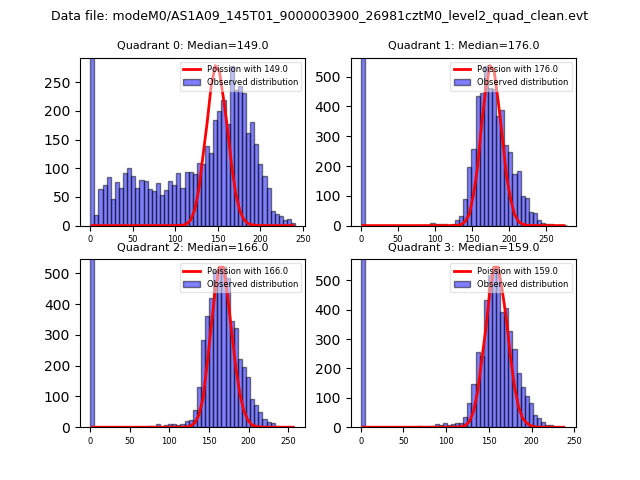 |
 |
| Quadrant-wise count rates Data is divided into 100 sec bins |
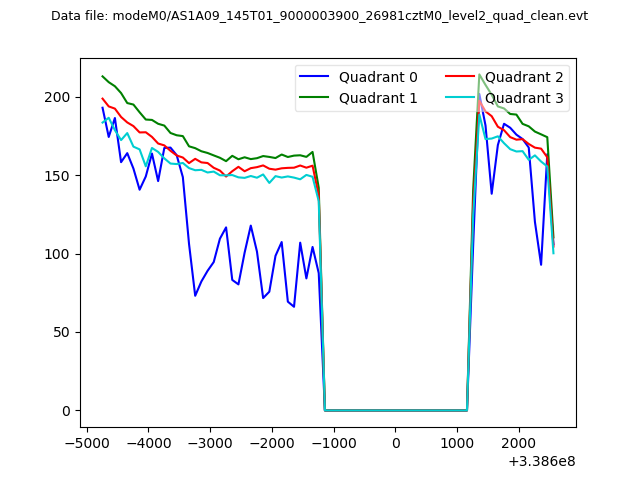 |
|
| Module-wise count rates for Quadrant A Data is divided into 100 sec bins |
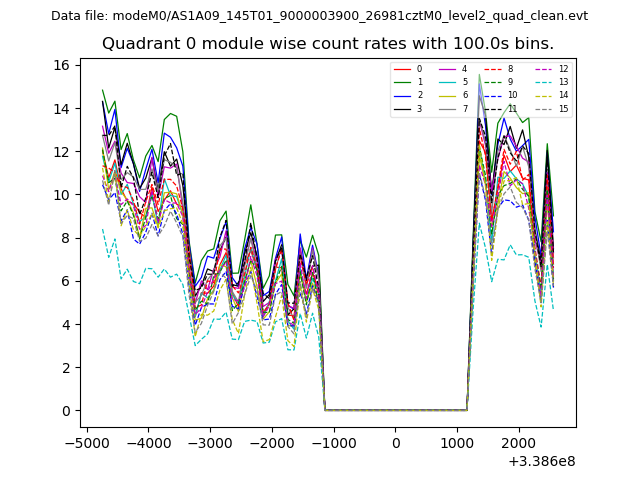 |
 |
| Module-wise count rates for Quadrant B Data is divided into 100 sec bins |
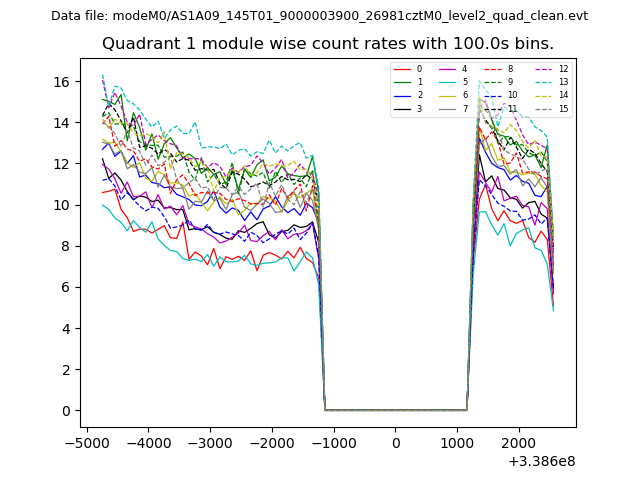 |
 |
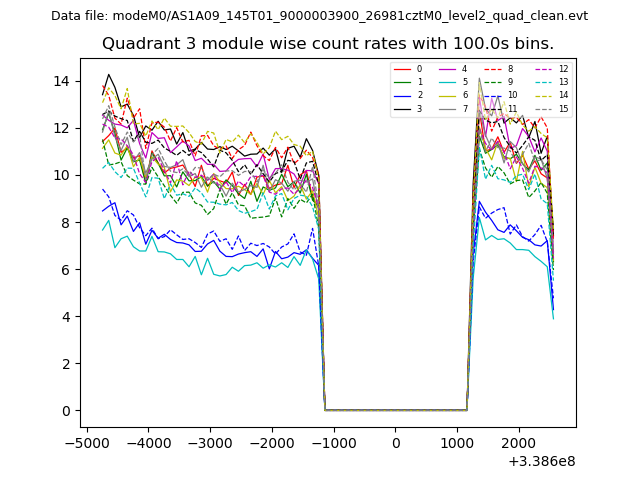
| Module-wise count rates for Quadrant C Data is divided into 100 sec bins |
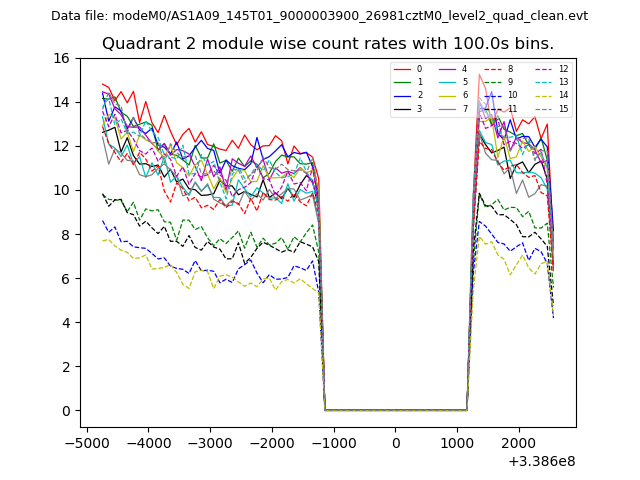 |
 |
| Module-wise count rates for Quadrant D Data is divided into 100 sec bins |
 |
 |
| Parameter | Plot |
|---|---|
| CZT HV Monitor | 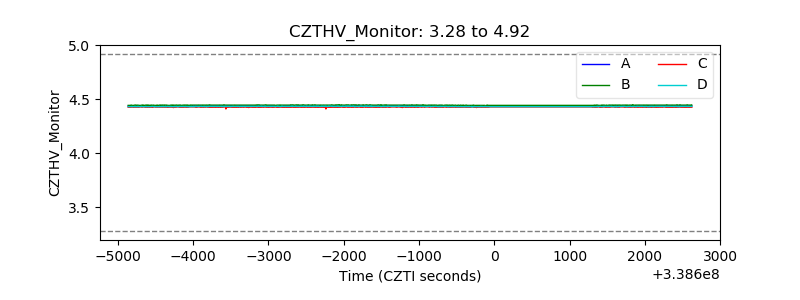 |
| D_VDD | 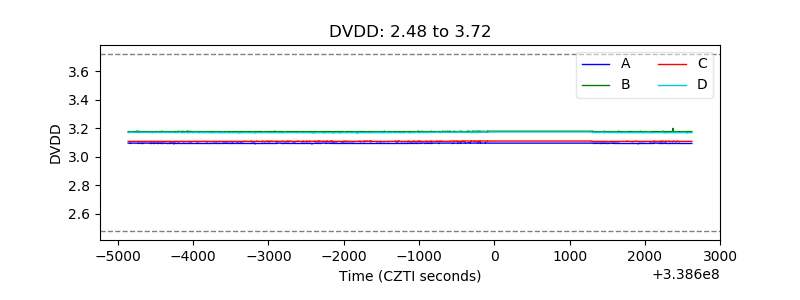 |
| Temperature 1 | 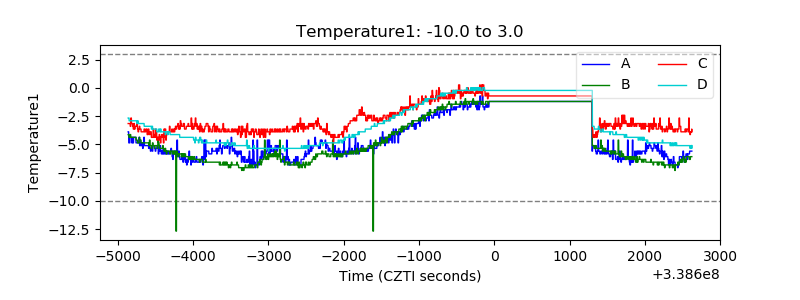 |
| Veto HV Monitor | 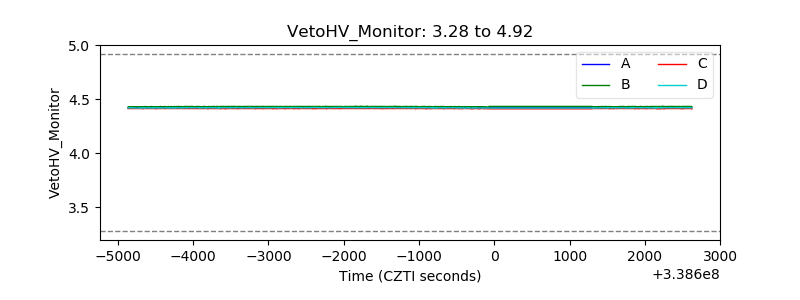 |
| Veto LLD | 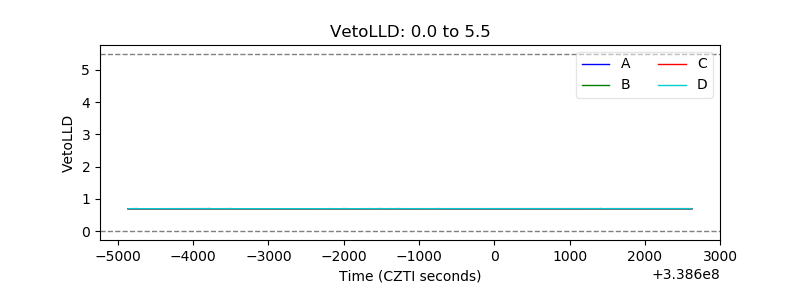 |
| Alpha Counter | 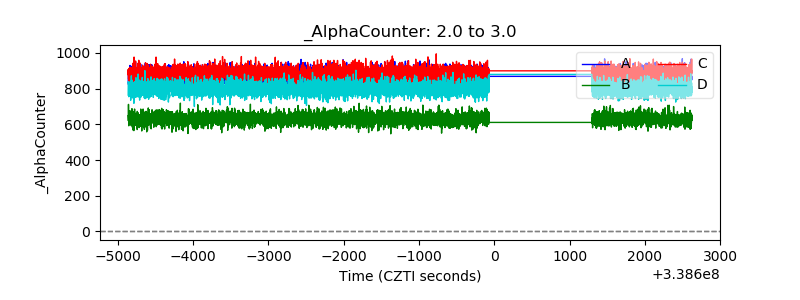 |
| _CPM_Rate | 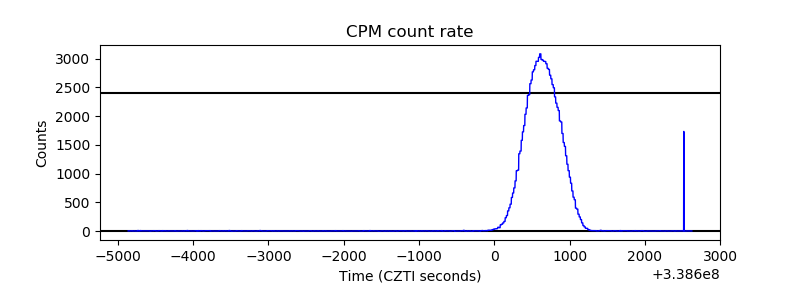 |
| CZT Counter | 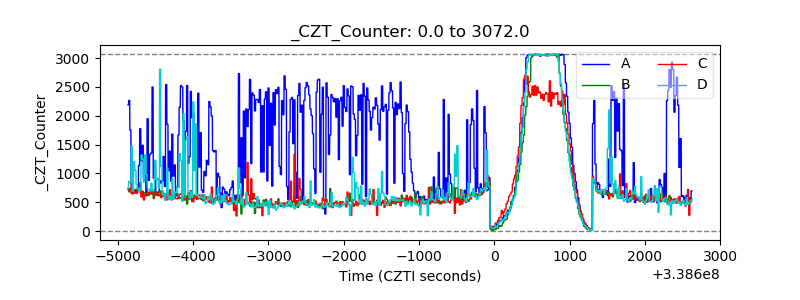 |
| +2.5 Volts monitor |  |
| +5 Volts monitor |  |
| _ROLL_ROT | 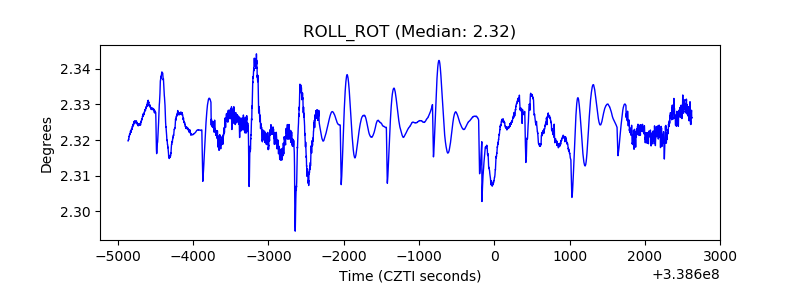 |
| _Roll_DEC | 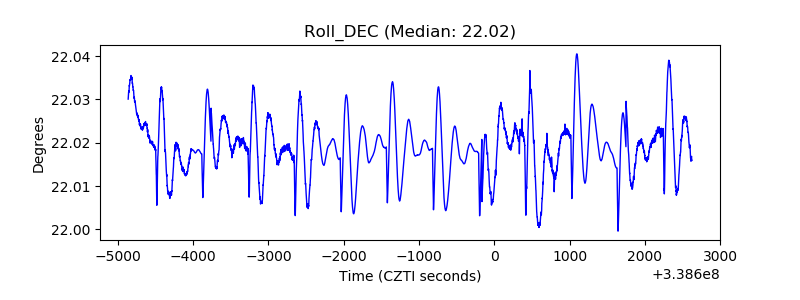 |
| _Roll_RA | 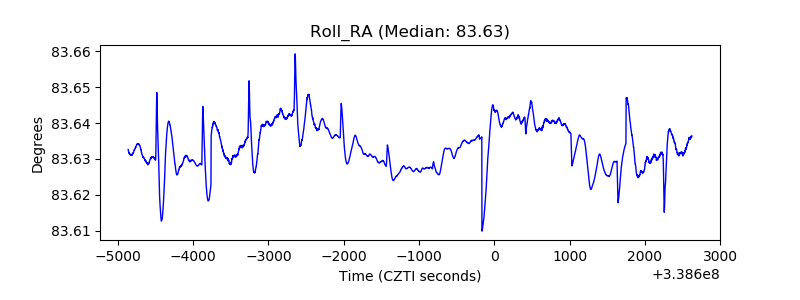 |
| Veto Counter | 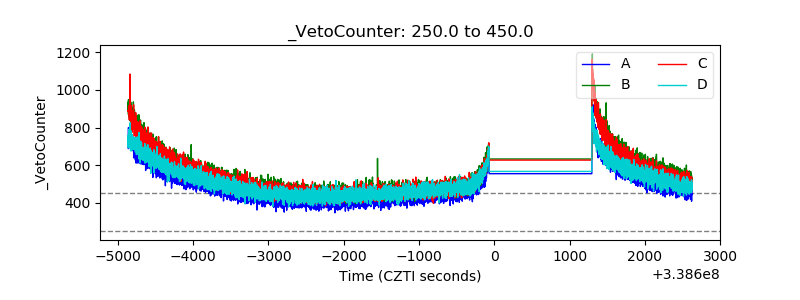 |