| Param | Original file | Final file |
|---|---|---|
| Filename | modeM0/AS1A09_145T01_9000003900_26982cztM0_level2.evt | modeM0/AS1A09_145T01_9000003900_26982cztM0_level2_quad_clean.evt |
| Size (bytes) | 704,776,320 | 109,154,880 |
| Size | 672.1 MB | 104.1 MB |
| Events in quadrant A | 10,239,062 | 570,314 |
| Events in quadrant B | 3,385,671 | 811,439 |
| Events in quadrant C | 3,361,691 | 763,996 |
| Events in quadrant D | 3,936,435 | 724,798 |
| Mode M0 | |||
|---|---|---|---|
| Quadrant | BADHDUFLAG | Total packets | Discarded packets |
| A | 0 | 34648 | 0 |
| B | 0 | 13763 | 0 |
| C | 0 | 13682 | 0 |
| D | 0 | 15734 | 0 |
| Mode M9 | |||
|---|---|---|---|
| Quadrant | BADHDUFLAG | Total packets | Discarded packets |
| A | 0 | 13 | 0 |
| B | 0 | 14 | 0 |
| C | 0 | 14 | 0 |
| D | 0 | 14 | 0 |
| Quadrant | Total seconds | Saturated seconds | Saturation percentage |
|---|---|---|---|
| A | 6226 | 3212 | 51.590106% |
| B | 6226 | 83 | 1.333119% |
| C | 6226 | 116 | 1.863155% |
| D | 6226 | 198 | 3.180212% |
Noise dominated data is calculated using 1-second bins in cleaned event files. If a bin has >2000 counts, and if more than 50% of those come from <1% of pixels, then it is considered to be noise-dominated and hence unusable.
| Quadrant | # 1 sec bins | Bins with >0 counts | Bins with >2000 counts | High rate bins dominated by noise | Noise dominated (total time) | Noise dominated (detector-on time) | Marked lightcurve |
|---|---|---|---|---|---|---|---|
| A | 7526 | 6226 | 2687 | 2687 | 35.70% | 43.16% |  |
| B | 7526 | 6226 | 4 | 4 | 0.05% | 0.06% |  |
| C | 7526 | 6227 | 3 | 3 | 0.04% | 0.05% |  |
| D | 7526 | 6227 | 143 | 143 | 1.90% | 2.30% |  |
Top three noisy pixels from each quadrant. If the there are fewer than three noisy pixels in the level2.evt file, extra rows are filled as -1
| Pixel properties | Quadrant properties | ||||||
|---|---|---|---|---|---|---|---|
| Quadrant | DetID | PixID | Counts | Sigma | Mean | Median | Sigma |
| A | 14 | 235 | 5051792 | 38948.85 | 642 | 634 | 129.7 |
| A | 6 | 16 | 2688324 | 20724.44 | 642 | 634 | 129.7 |
| A | 8 | 192 | 23609 | 177.16 | 642 | 634 | 129.7 |
| B | 15 | 222 | 21480 | 128.78 | 854 | 836 | 160.3 |
| B | 0 | 219 | 20397 | 122.02 | 854 | 836 | 160.3 |
| B | 12 | 111 | 18355 | 109.28 | 854 | 836 | 160.3 |
| C | 14 | 238 | 132007 | 687.2 | 821 | 830 | 190.9 |
| C | 15 | 208 | 29040 | 147.78 | 821 | 830 | 190.9 |
| C | 13 | 61 | 5633 | 25.16 | 821 | 830 | 190.9 |
| D | 1 | 52 | 717505 | 3401.64 | 797 | 785 | 210.7 |
| D | 2 | 250 | 147550 | 696.56 | 797 | 785 | 210.7 |
| D | 2 | 234 | 26894 | 123.92 | 797 | 785 | 210.7 |
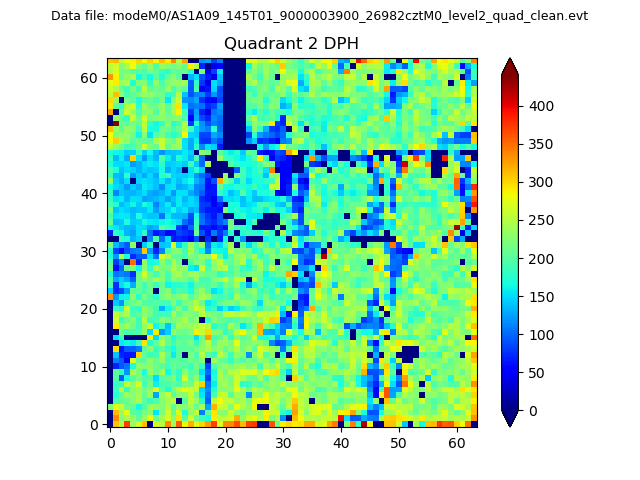
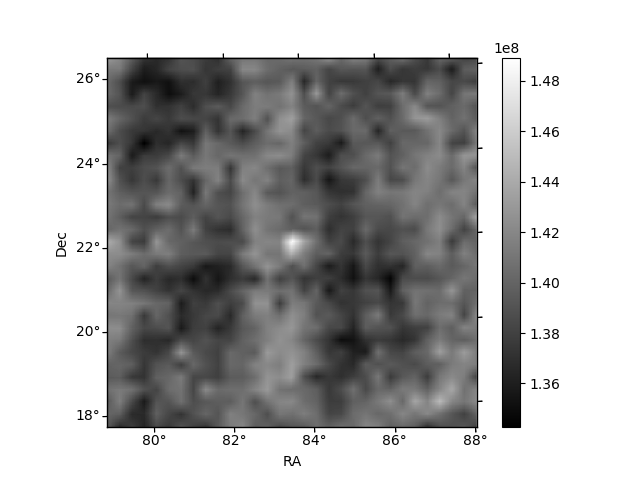
Histogram calculated using DETX and DETY for each event in the final _common_clean file
| Quadrant A | 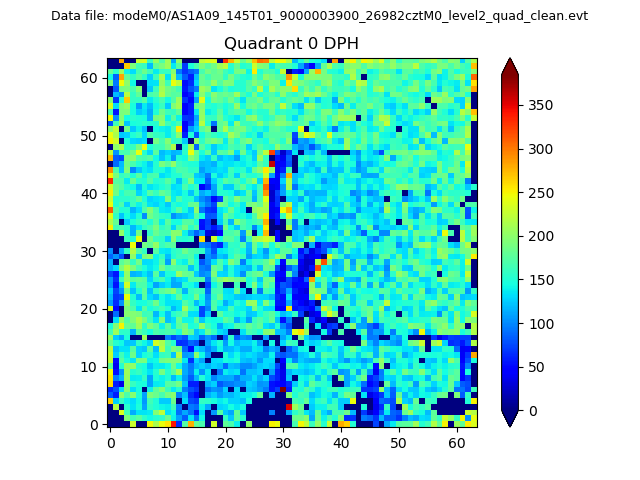 |
 |
Quadrant B |
|---|---|---|---|
| Quadrant D | 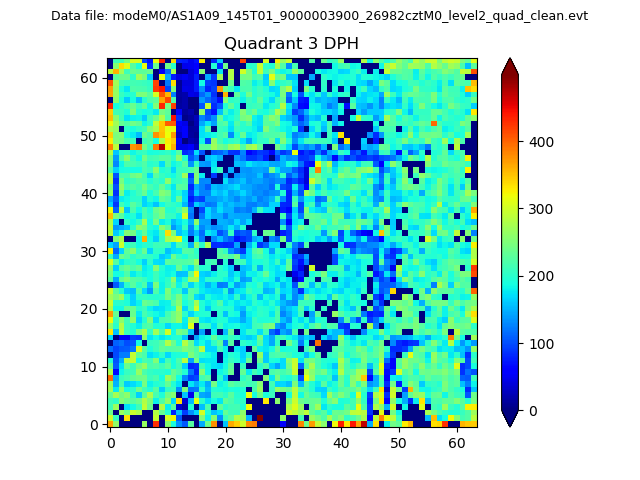 |
 |
Quadrant C |
| Plot type | Count rate plots | Images |
|---|---|---|
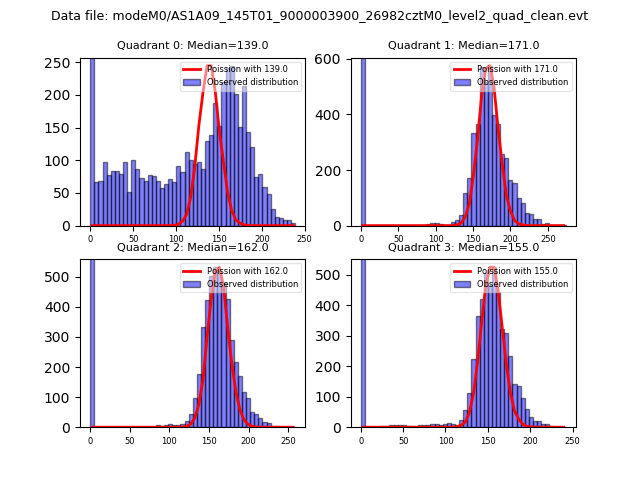
| Comparison with Poisson distribution Blue bars denote a histogram of data divided into 1 sec bins. Red curve is a Poisson curve with rate = median count rate of data. |
 |
 |
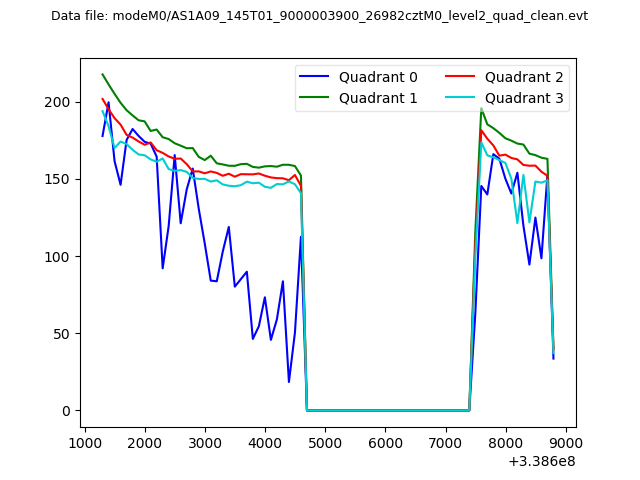
| Quadrant-wise count rates Data is divided into 100 sec bins |
 |
|
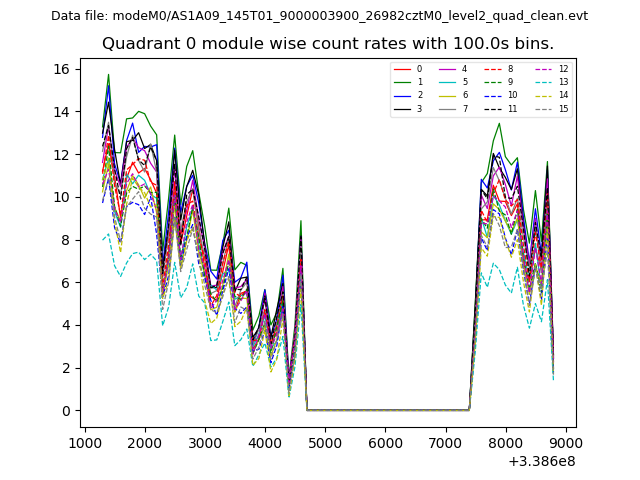
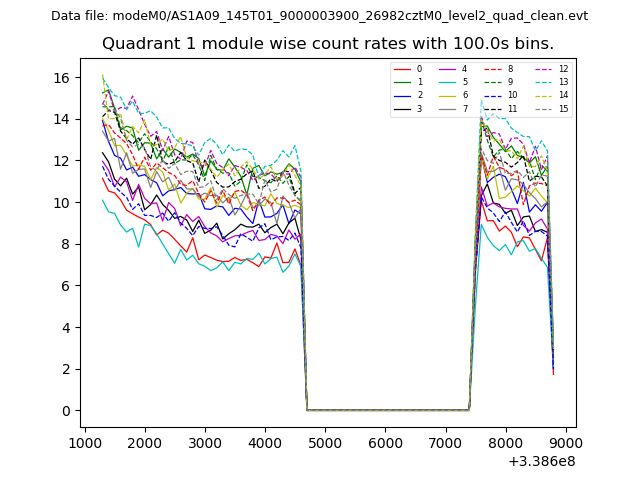
| Module-wise count rates for Quadrant A Data is divided into 100 sec bins |
 |
 |
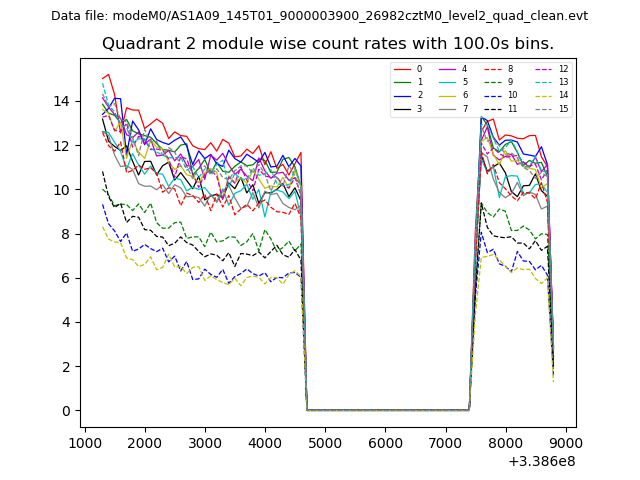
| Module-wise count rates for Quadrant B Data is divided into 100 sec bins |
 |
 |
| Module-wise count rates for Quadrant C Data is divided into 100 sec bins |
 |
 |
| Module-wise count rates for Quadrant D Data is divided into 100 sec bins |
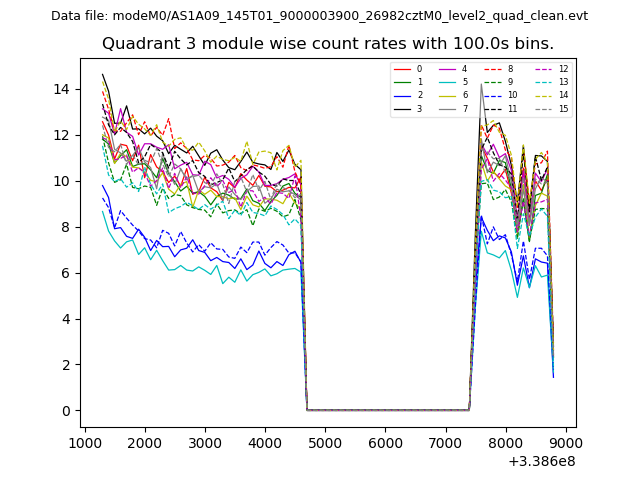 |
 |
| Parameter | Plot |
|---|---|
| CZT HV Monitor | 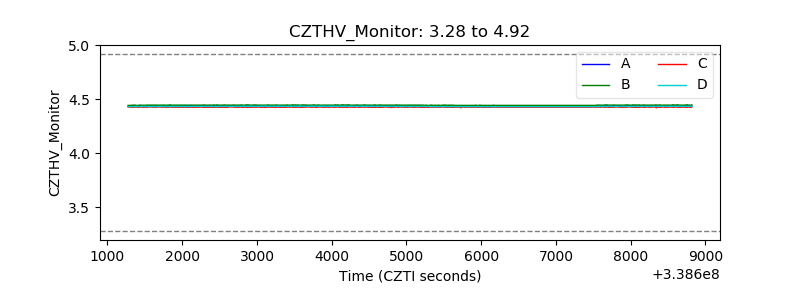 |
| D_VDD | 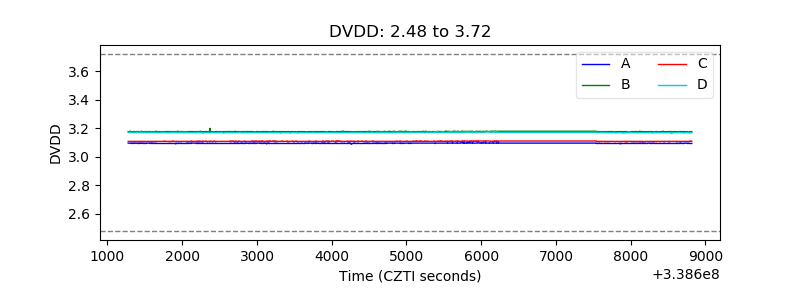 |
| Temperature 1 | 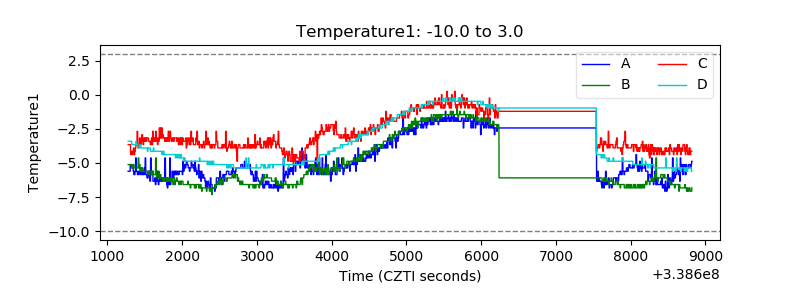 |
| Veto HV Monitor | 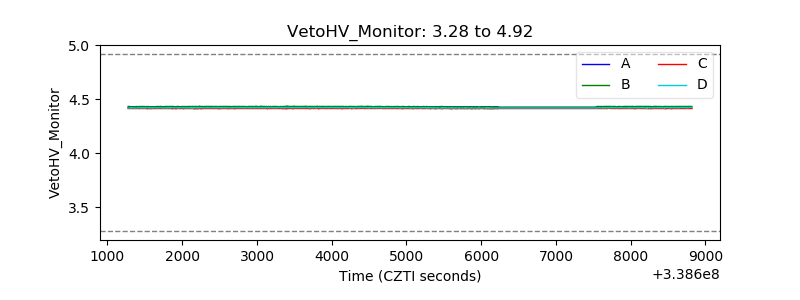 |
| Veto LLD | 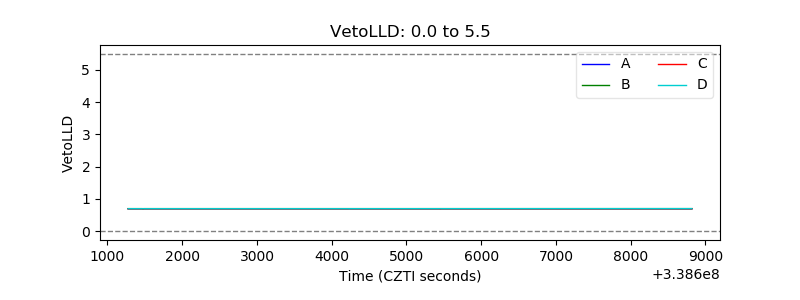 |
| Alpha Counter | 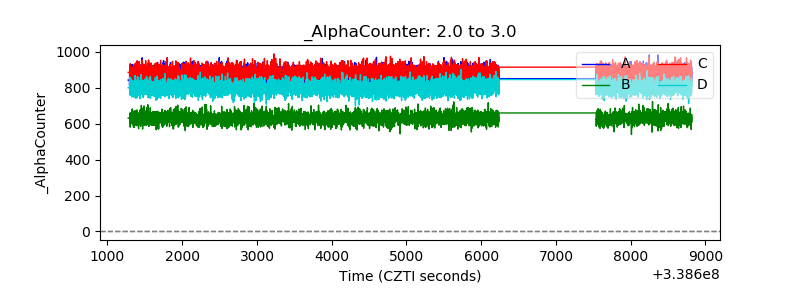 |
| _CPM_Rate | 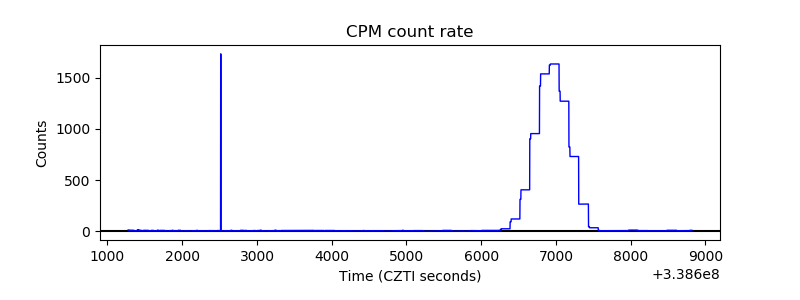 |
| CZT Counter |  |
| +2.5 Volts monitor |  |
| +5 Volts monitor | 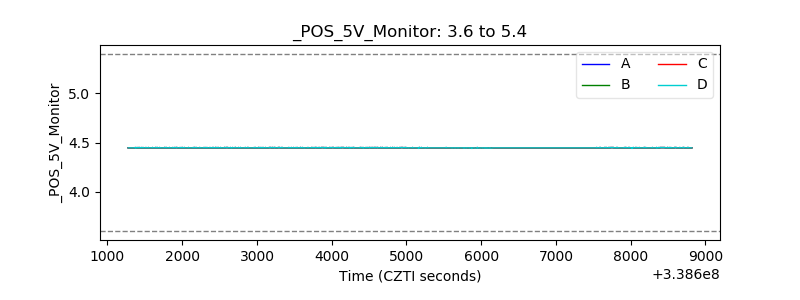 |
| _ROLL_ROT | 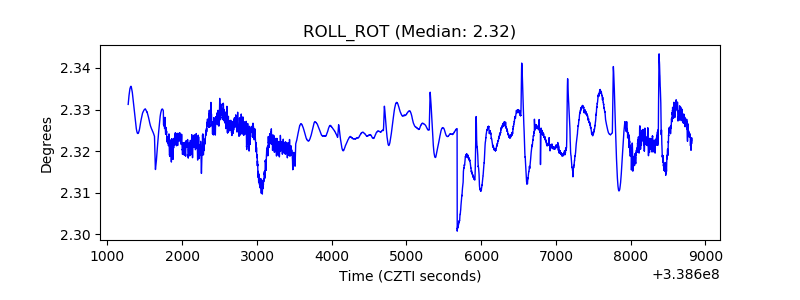 |
| _Roll_DEC | 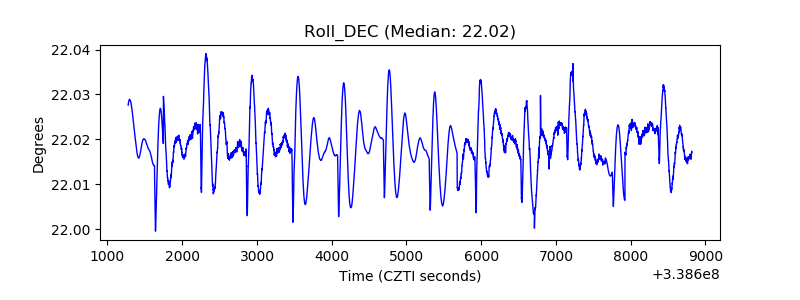 |
| _Roll_RA | 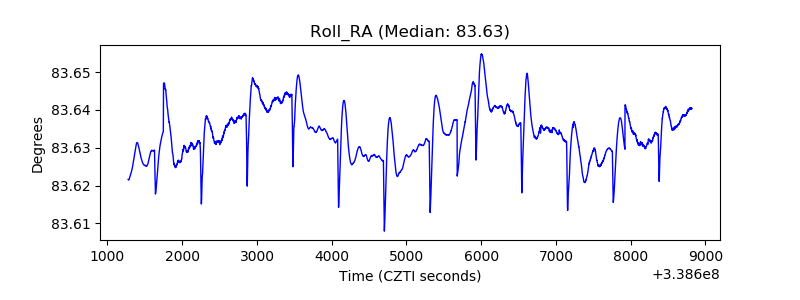 |
| Veto Counter | 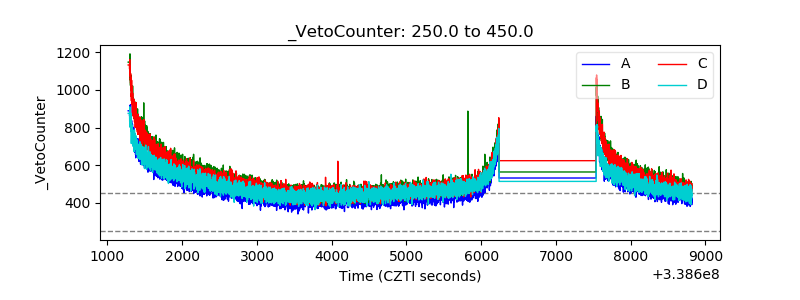 |