| Param | Original file | Final file |
|---|---|---|
| Filename | modeM0/AS1A09_145T01_9000003900_26983cztM0_level2.evt | modeM0/AS1A09_145T01_9000003900_26983cztM0_level2_quad_clean.evt |
| Size (bytes) | 739,252,800 | 106,871,040 |
| Size | 705.0 MB | 101.9 MB |
| Events in quadrant A | 10,682,093 | 589,260 |
| Events in quadrant B | 3,520,797 | 761,507 |
| Events in quadrant C | 3,495,003 | 721,408 |
| Events in quadrant D | 4,229,699 | 689,085 |
| Mode M0 | |||
|---|---|---|---|
| Quadrant | BADHDUFLAG | Total packets | Discarded packets |
| A | 0 | 36459 | 0 |
| B | 0 | 14555 | 0 |
| C | 0 | 14462 | 0 |
| D | 0 | 17060 | 0 |
| Mode M9 | |||
|---|---|---|---|
| Quadrant | BADHDUFLAG | Total packets | Discarded packets |
| A | 0 | 12 | 0 |
| B | 0 | 13 | 0 |
| C | 0 | 13 | 0 |
| D | 0 | 13 | 0 |
| Quadrant | Total seconds | Saturated seconds | Saturation percentage |
|---|---|---|---|
| A | 6812 | 3123 | 45.845567% |
| B | 6812 | 56 | 0.822079% |
| C | 6812 | 82 | 1.203758% |
| D | 6812 | 166 | 2.436876% |
Noise dominated data is calculated using 1-second bins in cleaned event files. If a bin has >2000 counts, and if more than 50% of those come from <1% of pixels, then it is considered to be noise-dominated and hence unusable.
| Quadrant | # 1 sec bins | Bins with >0 counts | Bins with >2000 counts | High rate bins dominated by noise | Noise dominated (total time) | Noise dominated (detector-on time) | Marked lightcurve |
|---|---|---|---|---|---|---|---|
| A | 7967 | 6813 | 2578 | 2578 | 32.36% | 37.84% |  |
| B | 7967 | 6812 | 0 | 0 | 0.00% | 0.00% | 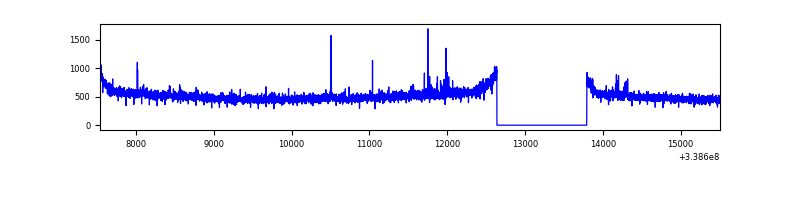 |
| C | 7967 | 6813 | 3 | 3 | 0.04% | 0.04% | 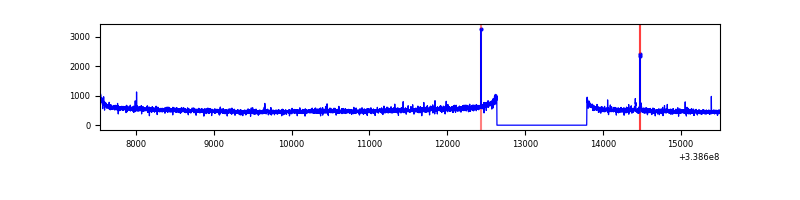 |
| D | 7967 | 6812 | 127 | 127 | 1.59% | 1.86% | 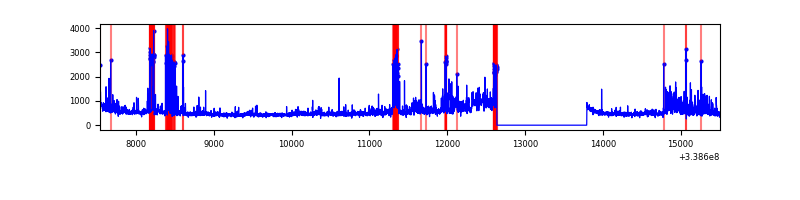 |
Top three noisy pixels from each quadrant. If the there are fewer than three noisy pixels in the level2.evt file, extra rows are filled as -1
| Pixel properties | Quadrant properties | ||||||
|---|---|---|---|---|---|---|---|
| Quadrant | DetID | PixID | Counts | Sigma | Mean | Median | Sigma |
| A | 14 | 235 | 7730307 | 55717.61 | 687 | 676 | 138.7 |
| A | 6 | 16 | 260777 | 1874.89 | 687 | 676 | 138.7 |
| A | 8 | 192 | 23513 | 164.62 | 687 | 676 | 138.7 |
| B | 12 | 111 | 19811 | 112.17 | 888 | 871 | 168.8 |
| B | 0 | 230 | 19321 | 109.27 | 888 | 871 | 168.8 |
| B | 11 | 111 | 17414 | 97.98 | 888 | 871 | 168.8 |
| C | 14 | 238 | 137897 | 680.53 | 854 | 862 | 201.4 |
| C | 15 | 208 | 27384 | 131.71 | 854 | 862 | 201.4 |
| C | 13 | 61 | 5824 | 24.64 | 854 | 862 | 201.4 |
| D | 1 | 52 | 906819 | 4135.2 | 834 | 820 | 219.1 |
| D | 2 | 250 | 135189 | 613.29 | 834 | 820 | 219.1 |
| D | 2 | 234 | 26956 | 119.29 | 834 | 820 | 219.1 |
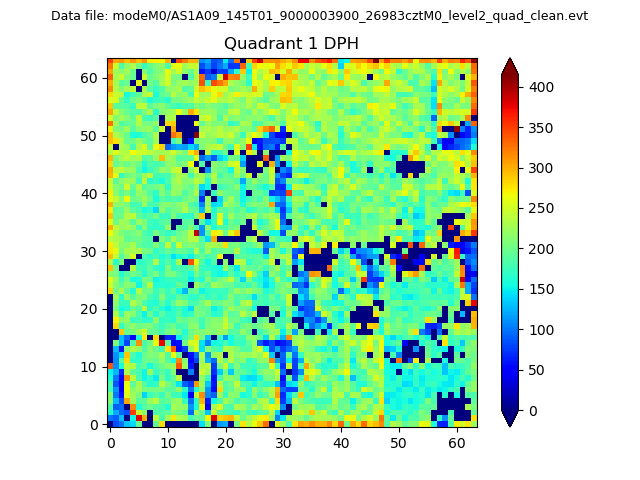
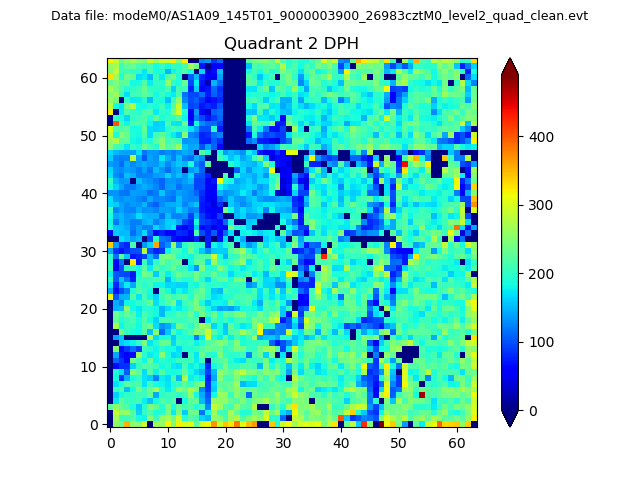
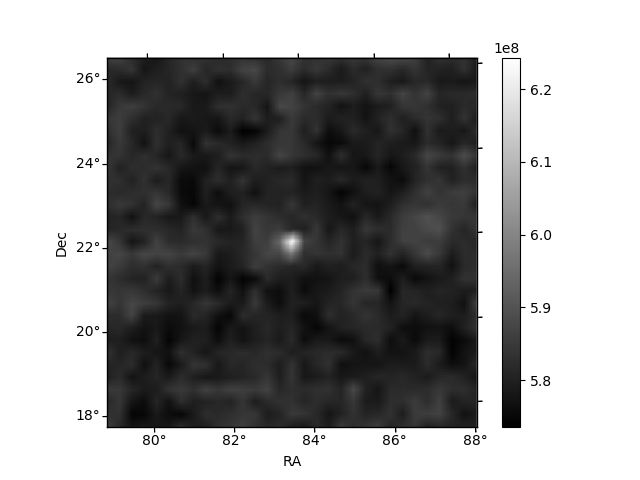
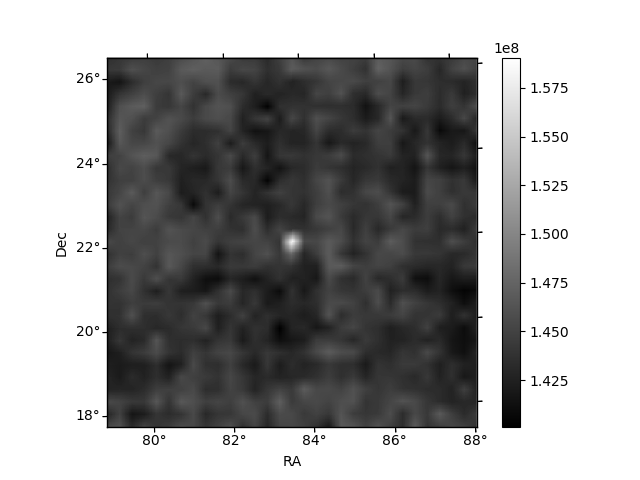
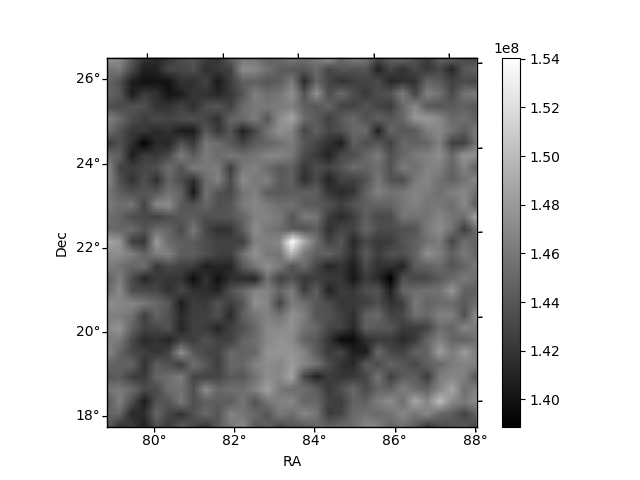
Histogram calculated using DETX and DETY for each event in the final _common_clean file
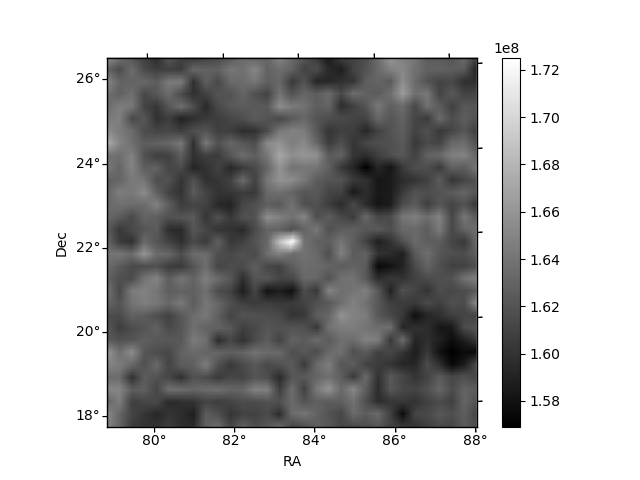
| Quadrant A | 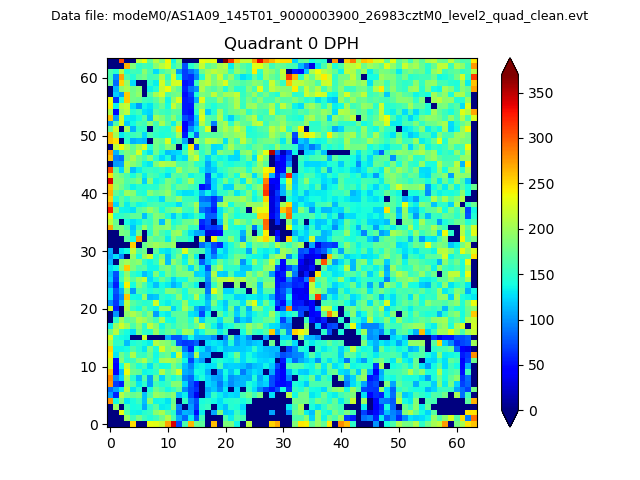 |
 |
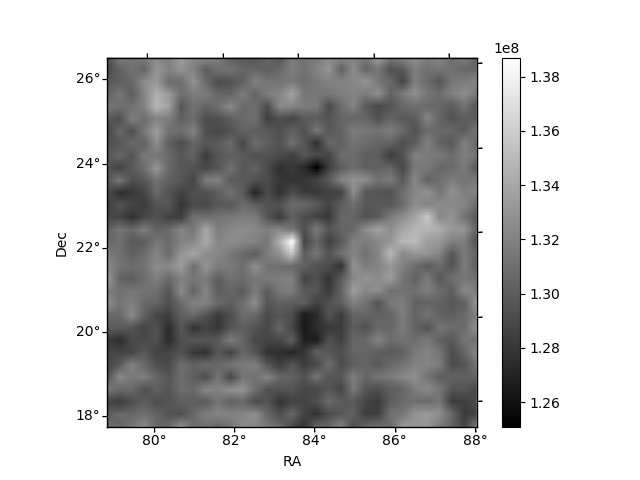
Quadrant B |
|---|---|---|---|
| Quadrant D | 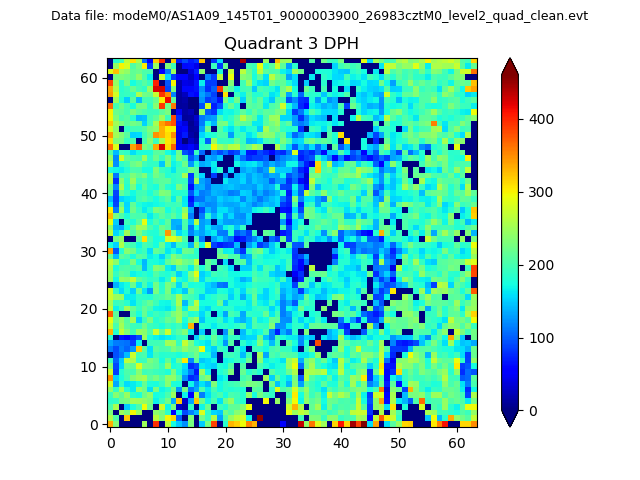 |
 |
Quadrant C |
| Plot type | Count rate plots | Images |
|---|---|---|
| Comparison with Poisson distribution Blue bars denote a histogram of data divided into 1 sec bins. Red curve is a Poisson curve with rate = median count rate of data. |
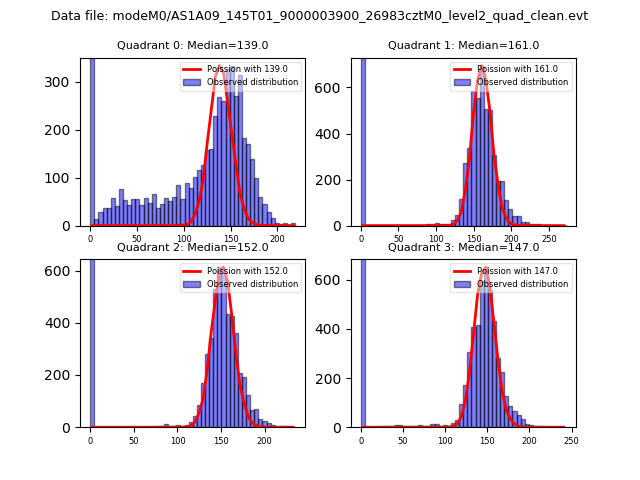 |
 |
| Quadrant-wise count rates Data is divided into 100 sec bins |
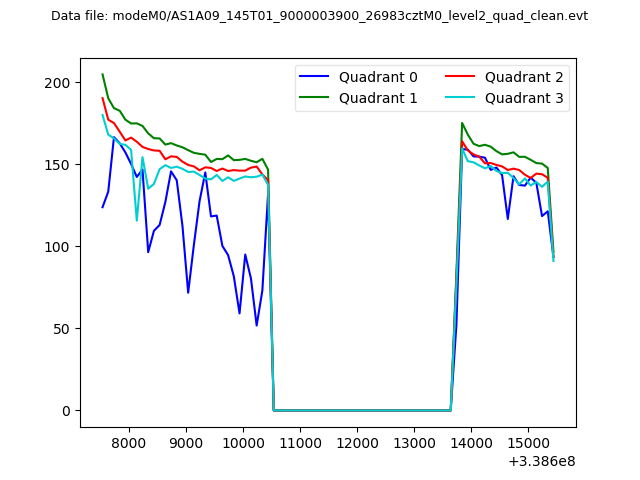 |
|
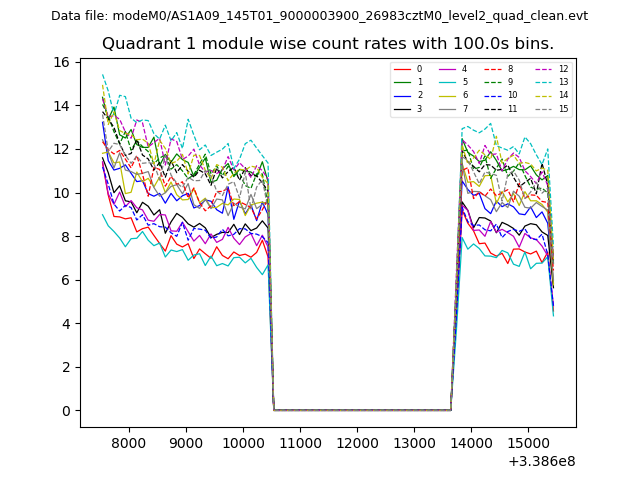
| Module-wise count rates for Quadrant A Data is divided into 100 sec bins |
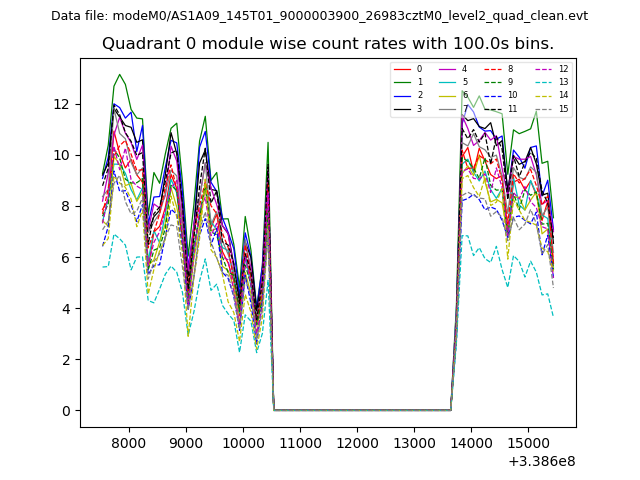 |
 |
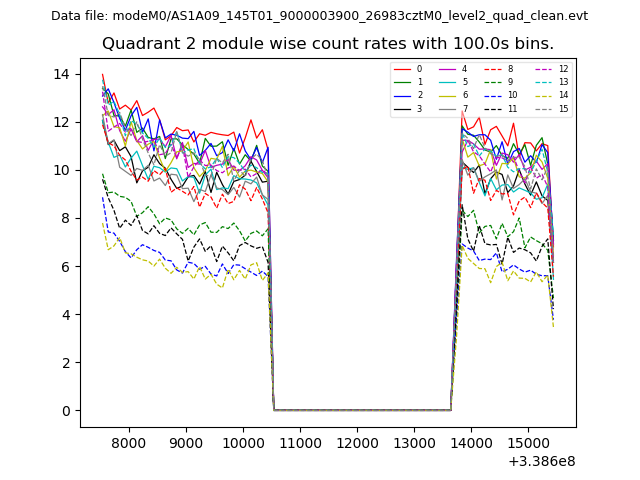
| Module-wise count rates for Quadrant B Data is divided into 100 sec bins |
 |
 |
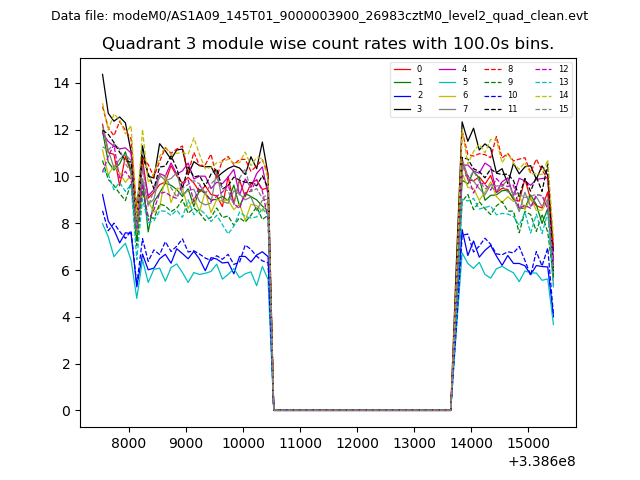
| Module-wise count rates for Quadrant C Data is divided into 100 sec bins |
 |
 |
| Module-wise count rates for Quadrant D Data is divided into 100 sec bins |
 |
 |
| Parameter | Plot |
|---|---|
| CZT HV Monitor | 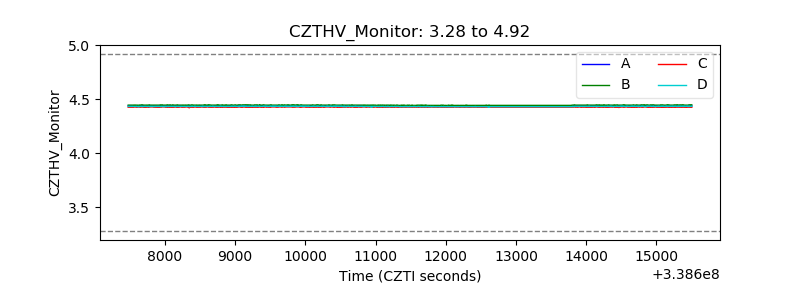 |
| D_VDD | 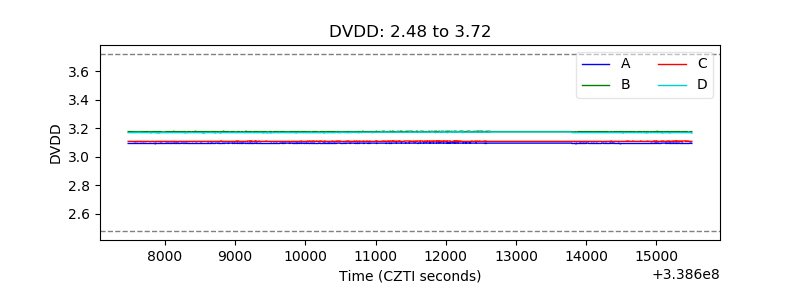 |
| Temperature 1 | 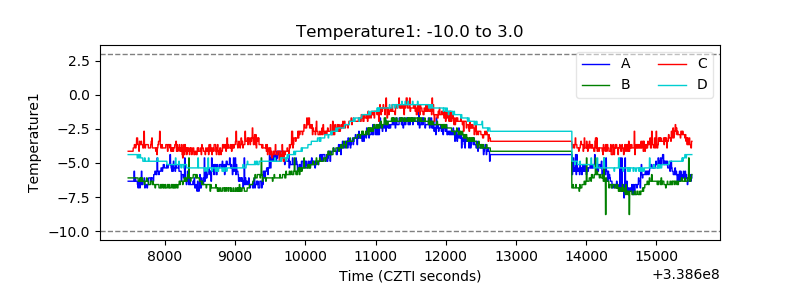 |
| Veto HV Monitor | 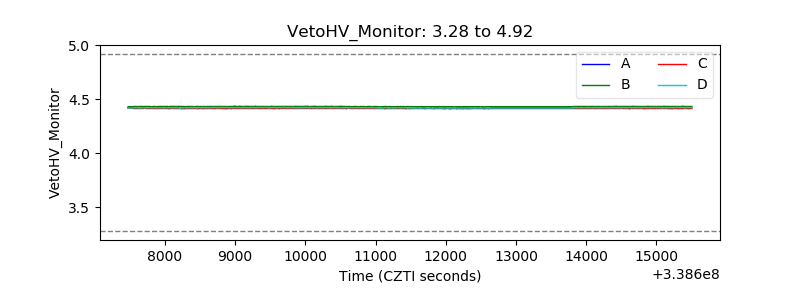 |
| Veto LLD | 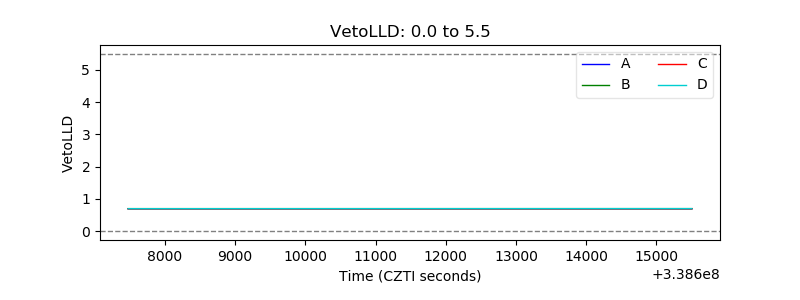 |
| Alpha Counter | 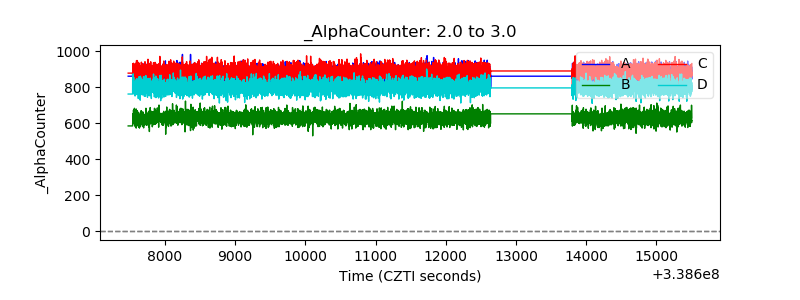 |
| _CPM_Rate | 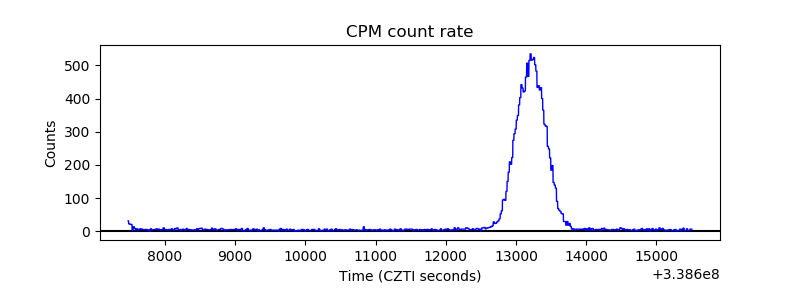 |
| CZT Counter | 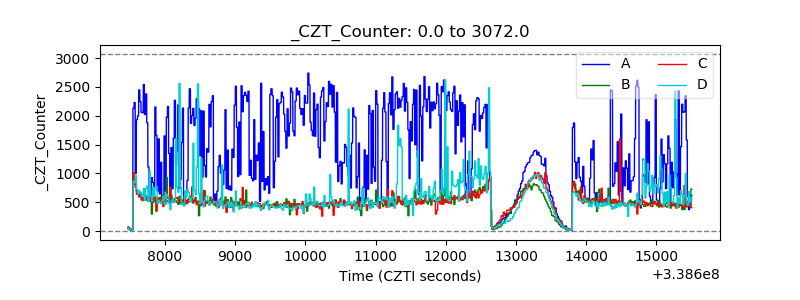 |
| +2.5 Volts monitor |  |
| +5 Volts monitor |  |
| _ROLL_ROT | 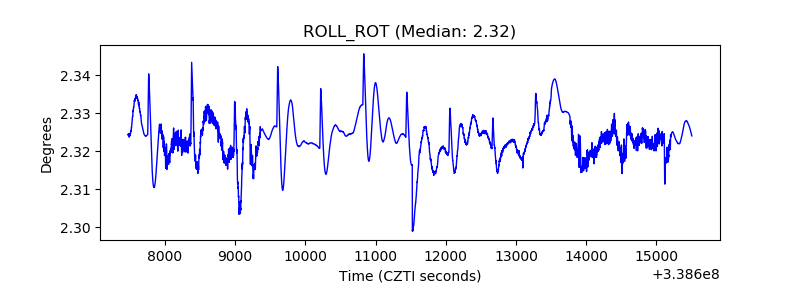 |
| _Roll_DEC | 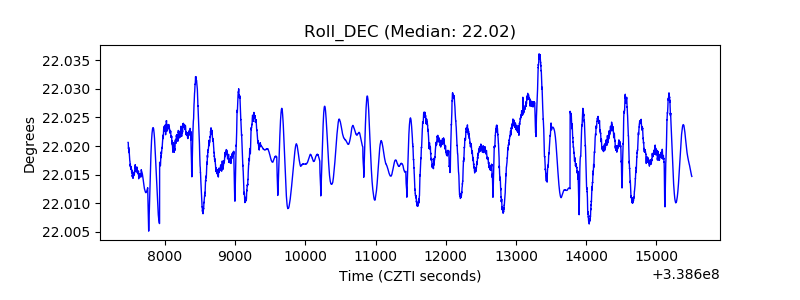 |
| _Roll_RA | 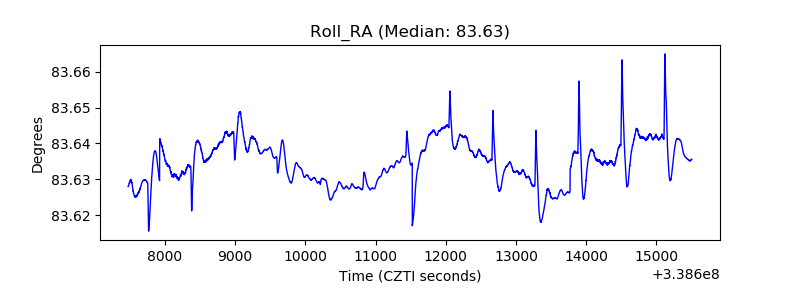 |
| Veto Counter | 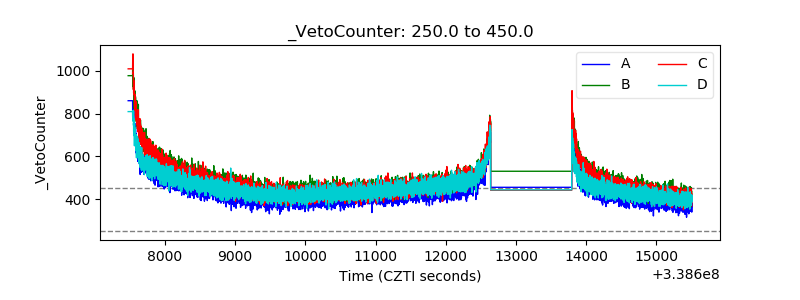 |