| Param | Original file | Final file |
|---|---|---|
| Filename | modeM0/AS1A09_145T01_9000003900_26985cztM0_level2.evt | modeM0/AS1A09_145T01_9000003900_26985cztM0_level2_quad_clean.evt |
| Size (bytes) | 773,795,520 | 99,293,760 |
| Size | 737.9 MB | 94.7 MB |
| Events in quadrant A | 9,160,071 | 559,814 |
| Events in quadrant B | 3,408,763 | 695,922 |
| Events in quadrant C | 3,399,209 | 667,016 |
| Events in quadrant D | 6,998,587 | 600,800 |
| Mode M0 | |||
|---|---|---|---|
| Quadrant | BADHDUFLAG | Total packets | Discarded packets |
| A | 0 | 31880 | 0 |
| B | 0 | 14319 | 0 |
| C | 0 | 14321 | 0 |
| D | 0 | 25426 | 0 |
| Mode M9 | |||
|---|---|---|---|
| Quadrant | BADHDUFLAG | Total packets | Discarded packets |
| A | 0 | 3 | 0 |
| B | 0 | 3 | 0 |
| C | 0 | 3 | 0 |
| D | 0 | 3 | 0 |
| Quadrant | Total seconds | Saturated seconds | Saturation percentage |
|---|---|---|---|
| A | 6924 | 2215 | 31.990179% |
| B | 6924 | 125 | 1.805315% |
| C | 6925 | 148 | 2.137184% |
| D | 6925 | 899 | 12.981949% |
Noise dominated data is calculated using 1-second bins in cleaned event files. If a bin has >2000 counts, and if more than 50% of those come from <1% of pixels, then it is considered to be noise-dominated and hence unusable.
| Quadrant | # 1 sec bins | Bins with >0 counts | Bins with >2000 counts | High rate bins dominated by noise | Noise dominated (total time) | Noise dominated (detector-on time) | Marked lightcurve |
|---|---|---|---|---|---|---|---|
| A | 7229 | 6924 | 1742 | 1742 | 24.10% | 25.16% | 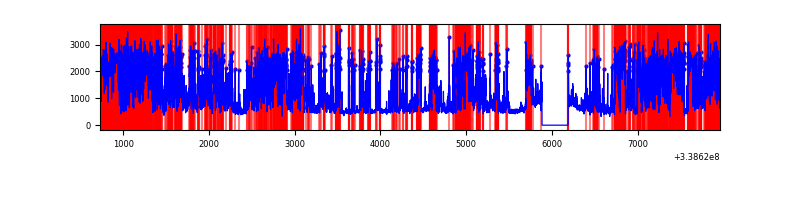 |
| B | 7229 | 6925 | 1 | 1 | 0.01% | 0.01% | 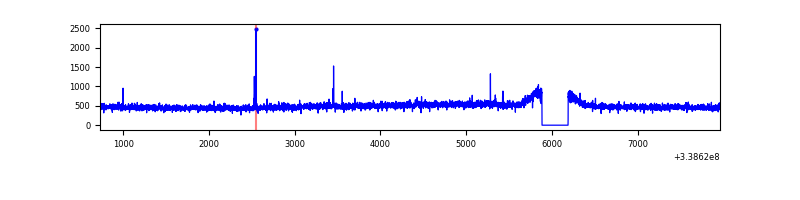 |
| C | 7230 | 6926 | 0 | 0 | 0.00% | 0.00% | 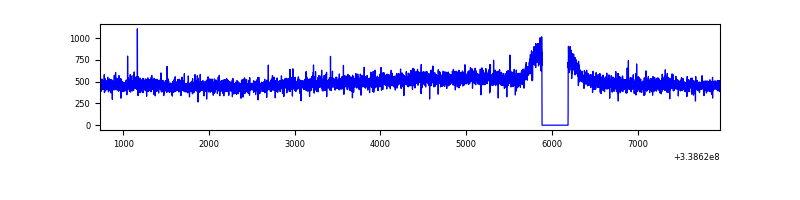 |
| D | 7230 | 6925 | 847 | 847 | 11.72% | 12.23% | 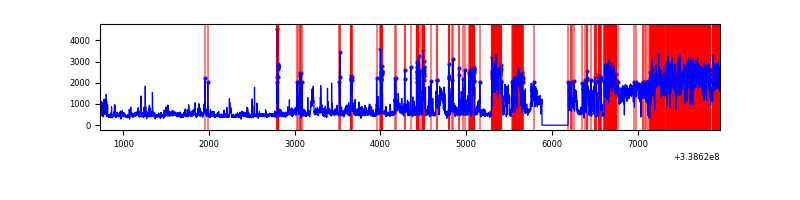 |
Top three noisy pixels from each quadrant. If the there are fewer than three noisy pixels in the level2.evt file, extra rows are filled as -1
| Pixel properties | Quadrant properties | ||||||
|---|---|---|---|---|---|---|---|
| Quadrant | DetID | PixID | Counts | Sigma | Mean | Median | Sigma |
| A | 14 | 235 | 6148124 | 39158.74 | 769 | 754 | 157.0 |
| A | 5 | 168 | 34729 | 216.42 | 769 | 754 | 157.0 |
| A | 8 | 192 | 12952 | 77.7 | 769 | 754 | 157.0 |
| B | 12 | 111 | 20422 | 117.29 | 867 | 846 | 166.9 |
| B | 11 | 111 | 18071 | 103.21 | 867 | 846 | 166.9 |
| B | 14 | 111 | 16213 | 92.07 | 867 | 846 | 166.9 |
| C | 14 | 238 | 135826 | 679.33 | 836 | 843 | 198.7 |
| C | 13 | 61 | 5661 | 24.25 | 836 | 843 | 198.7 |
| C | 15 | 208 | 5630 | 24.09 | 836 | 843 | 198.7 |
| D | 1 | 52 | 3791836 | 19454.48 | 814 | 793 | 194.9 |
| D | 2 | 250 | 113493 | 578.34 | 814 | 793 | 194.9 |
| D | 2 | 234 | 27358 | 136.32 | 814 | 793 | 194.9 |
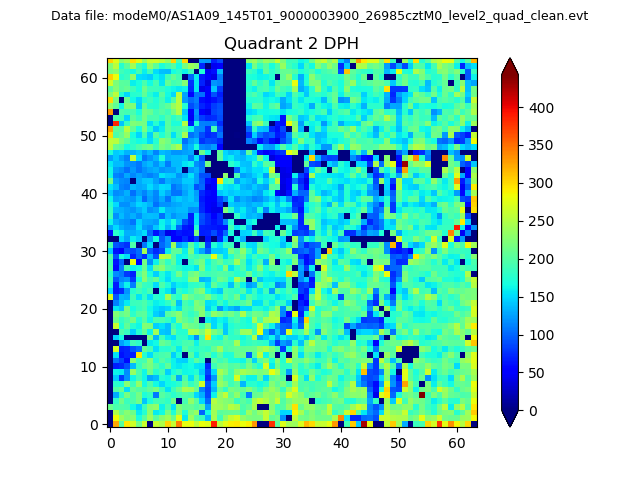
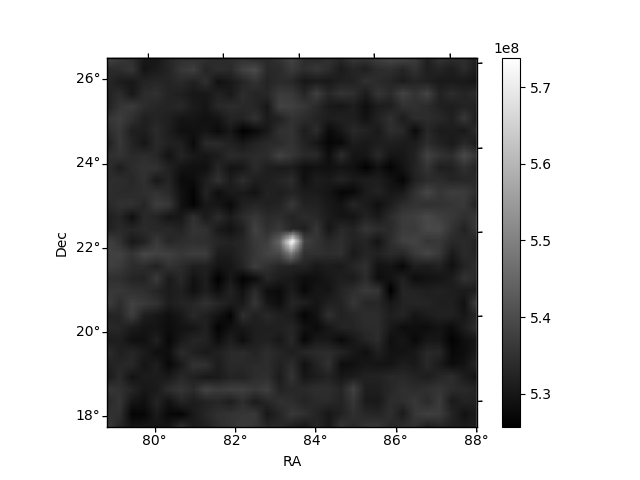
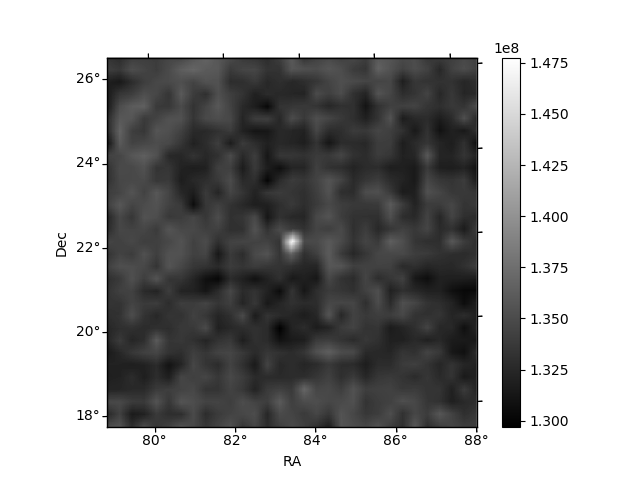
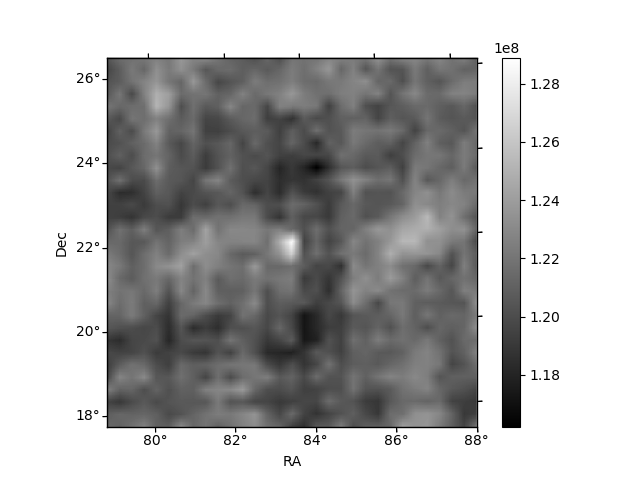
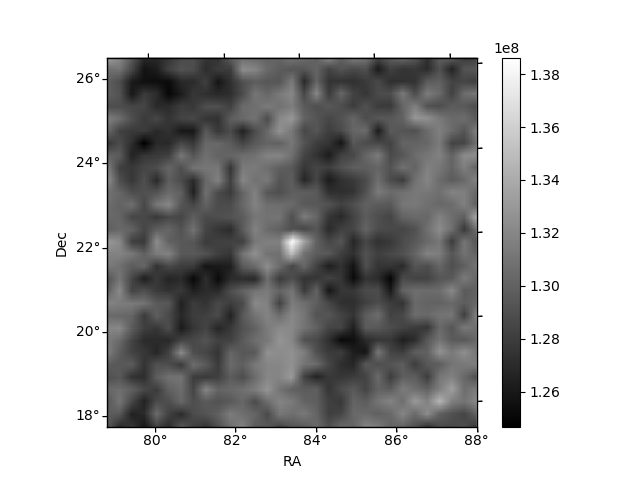
Histogram calculated using DETX and DETY for each event in the final _common_clean file
| Quadrant A | 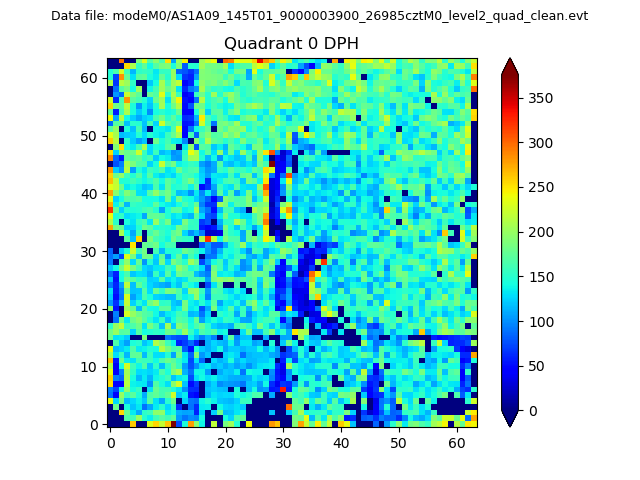 |
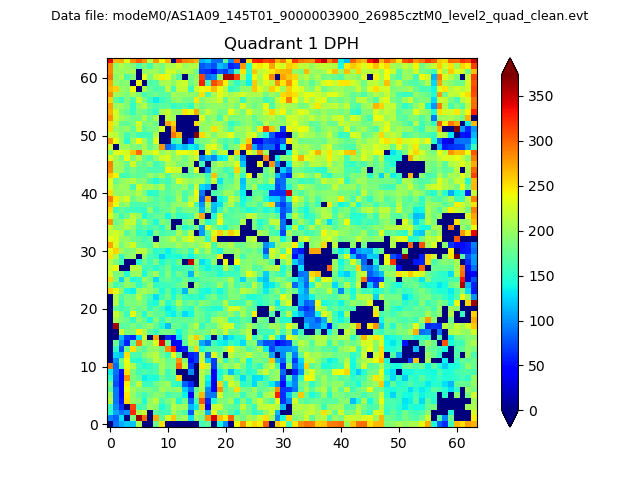 |
Quadrant B |
|---|---|---|---|
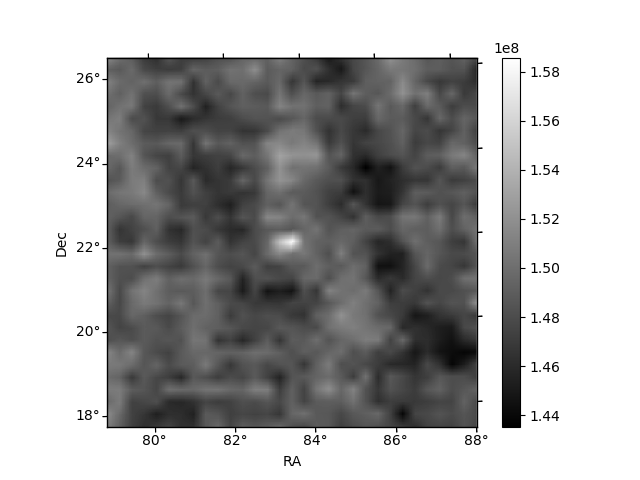
| Quadrant D | 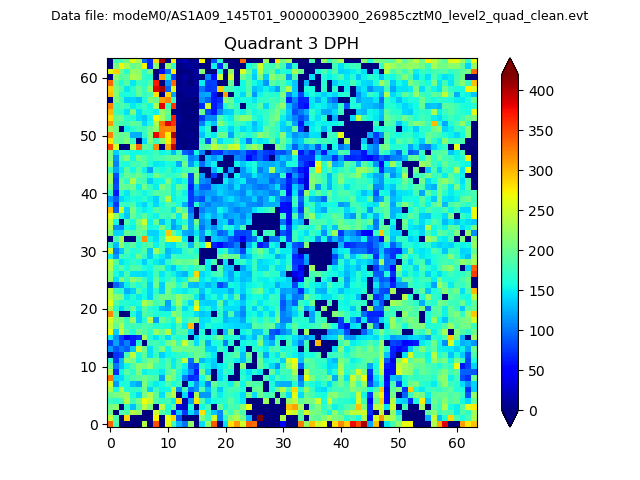 |
 |
Quadrant C |
| Plot type | Count rate plots | Images |
|---|---|---|
| Comparison with Poisson distribution Blue bars denote a histogram of data divided into 1 sec bins. Red curve is a Poisson curve with rate = median count rate of data. |
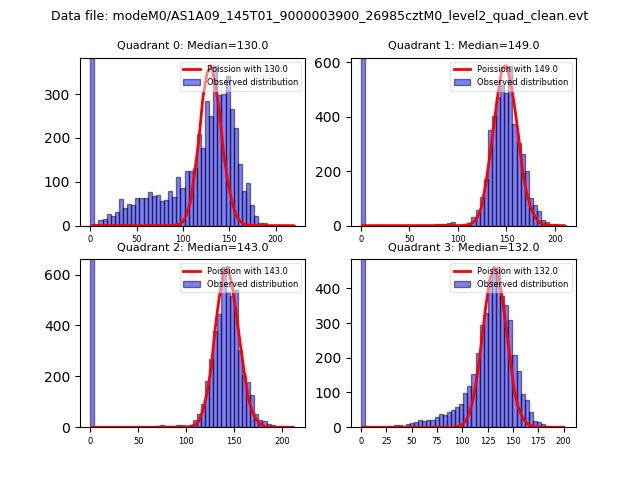 |
 |
| Quadrant-wise count rates Data is divided into 100 sec bins |
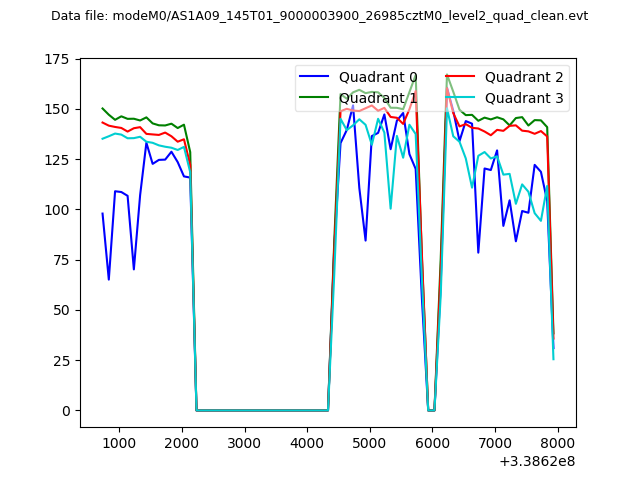 |
|
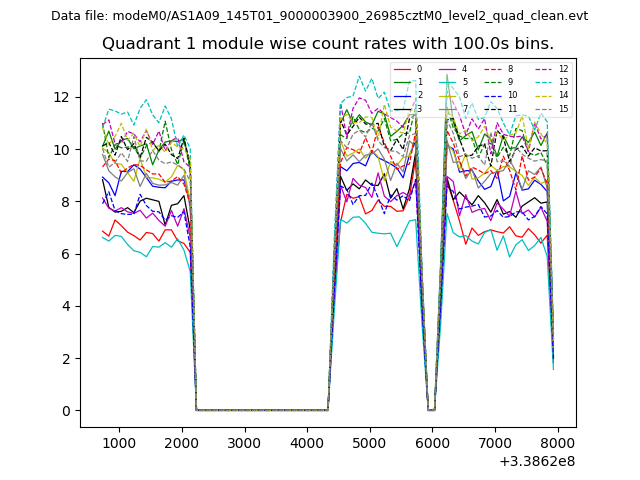
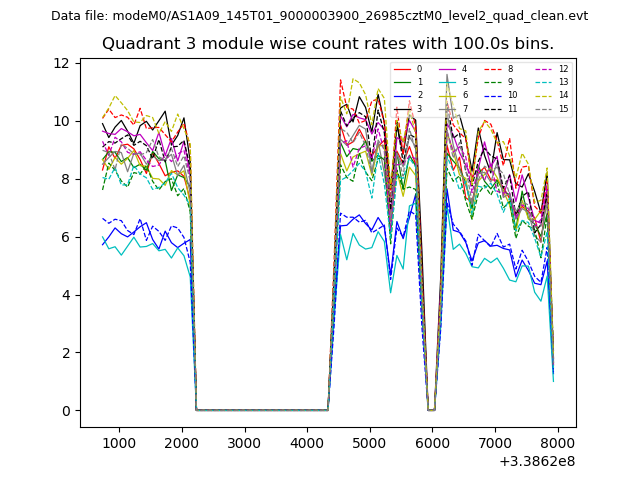
| Module-wise count rates for Quadrant A Data is divided into 100 sec bins |
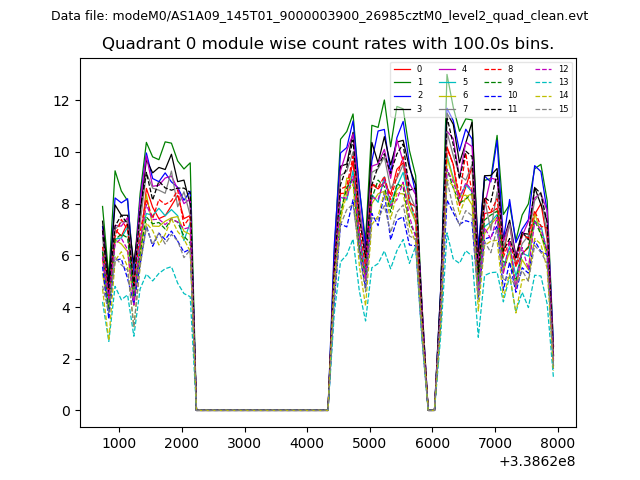 |
 |
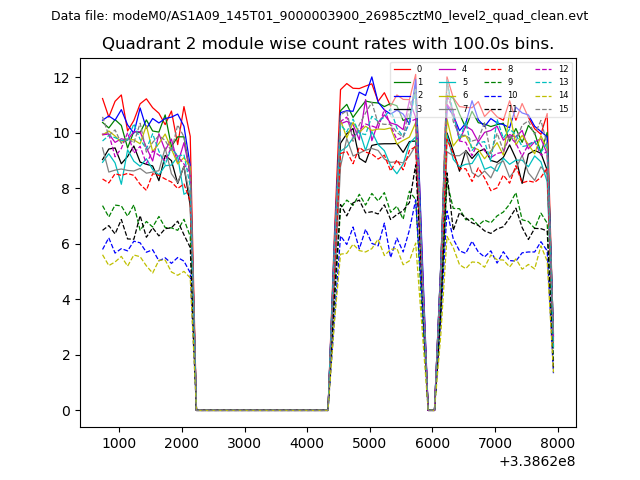
| Module-wise count rates for Quadrant B Data is divided into 100 sec bins |
 |
 |
| Module-wise count rates for Quadrant C Data is divided into 100 sec bins |
 |
 |
| Module-wise count rates for Quadrant D Data is divided into 100 sec bins |
 |
 |
| Parameter | Plot |
|---|---|
| CZT HV Monitor | 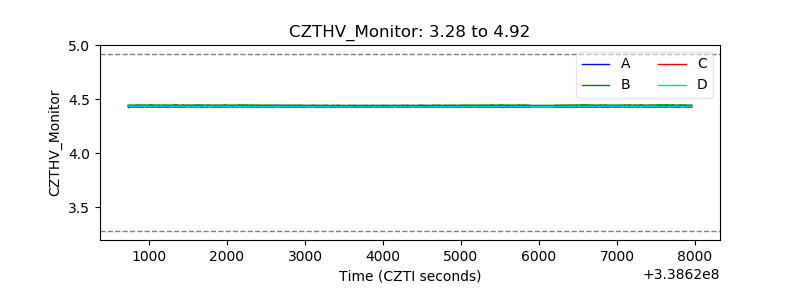 |
| D_VDD | 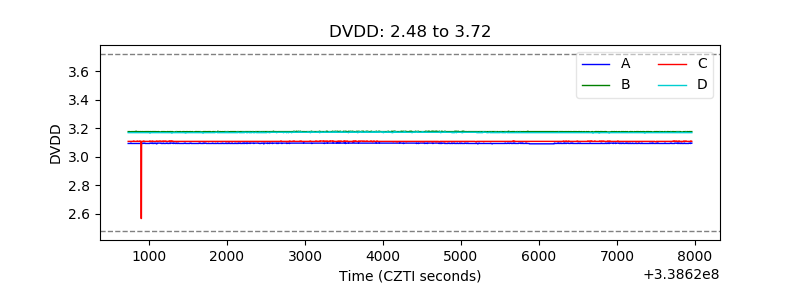 |
| Temperature 1 | 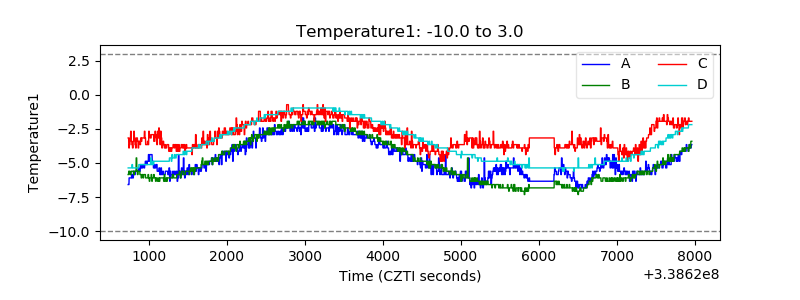 |
| Veto HV Monitor | 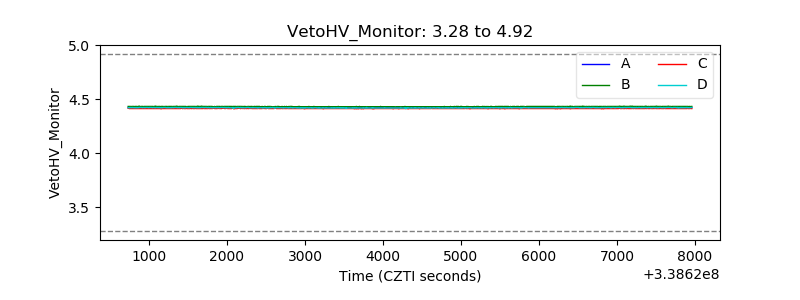 |
| Veto LLD | 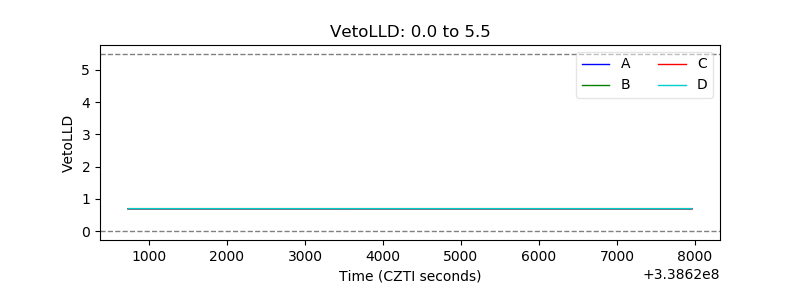 |
| Alpha Counter | 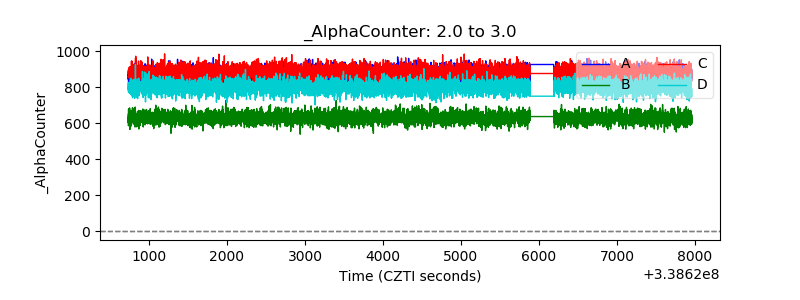 |
| _CPM_Rate | 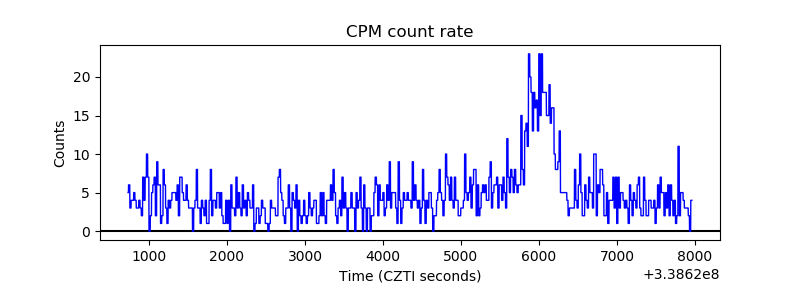 |
| CZT Counter | 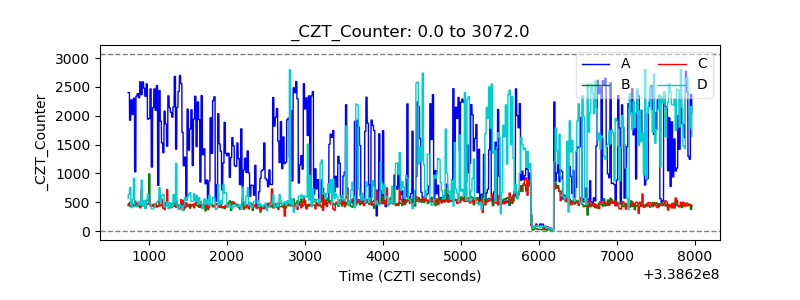 |
| +2.5 Volts monitor |  |
| +5 Volts monitor |  |
| _ROLL_ROT | 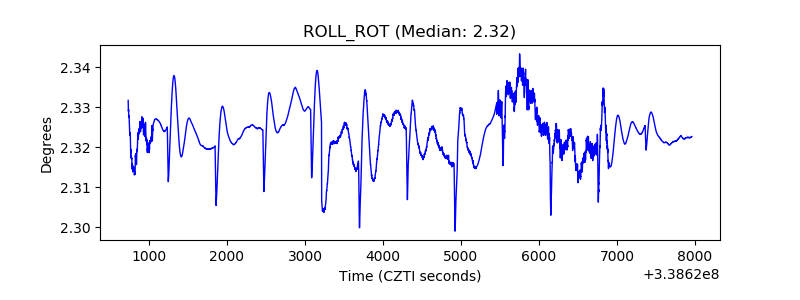 |
| _Roll_DEC | 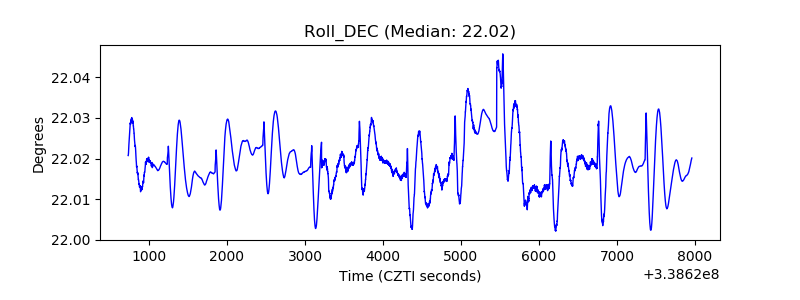 |
| _Roll_RA | 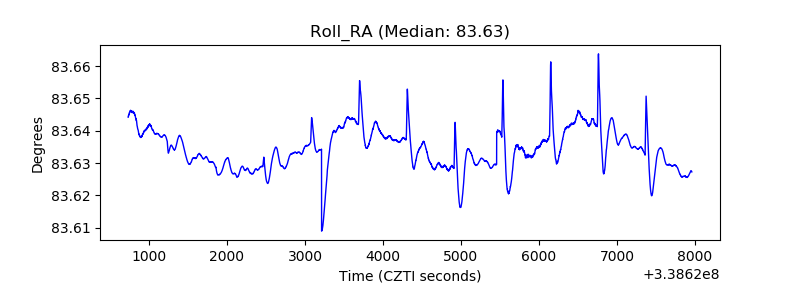 |
| Veto Counter | 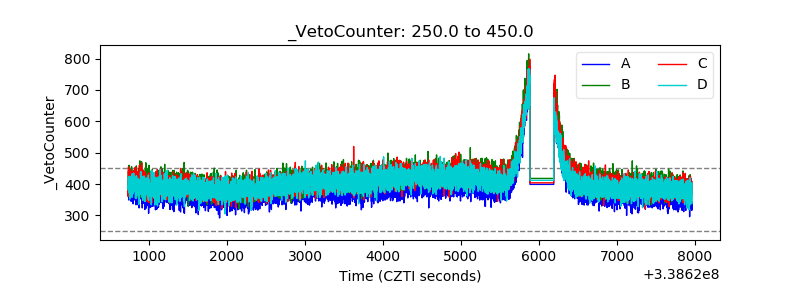 |