| Param | Original file | Final file |
|---|---|---|
| Filename | modeM0/AS1A09_145T01_9000003900_26986cztM0_level2.evt | modeM0/AS1A09_145T01_9000003900_26986cztM0_level2_quad_clean.evt |
| Size (bytes) | 833,160,960 | 94,942,080 |
| Size | 794.6 MB | 90.5 MB |
| Events in quadrant A | 9,947,074 | 507,768 |
| Events in quadrant B | 3,456,050 | 668,555 |
| Events in quadrant C | 3,507,788 | 639,985 |
| Events in quadrant D | 7,846,034 | 567,354 |
| Mode M0 | |||
|---|---|---|---|
| Quadrant | BADHDUFLAG | Total packets | Discarded packets |
| A | 0 | 34347 | 0 |
| B | 0 | 14526 | 0 |
| C | 0 | 14658 | 0 |
| D | 0 | 27912 | 0 |
| Mode M9 | |||
|---|---|---|---|
| Quadrant | BADHDUFLAG | Total packets | Discarded packets |
| A | 0 | 1 | 0 |
| B | 0 | 1 | 0 |
| C | 0 | 1 | 0 |
| D | 0 | 1 | 0 |
| Quadrant | Total seconds | Saturated seconds | Saturation percentage |
|---|---|---|---|
| A | 7030 | 2717 | 38.648649% |
| B | 7031 | 172 | 2.446309% |
| C | 7030 | 179 | 2.546230% |
| D | 7030 | 1588 | 22.588905% |
Noise dominated data is calculated using 1-second bins in cleaned event files. If a bin has >2000 counts, and if more than 50% of those come from <1% of pixels, then it is considered to be noise-dominated and hence unusable.
| Quadrant | # 1 sec bins | Bins with >0 counts | Bins with >2000 counts | High rate bins dominated by noise | Noise dominated (total time) | Noise dominated (detector-on time) | Marked lightcurve |
|---|---|---|---|---|---|---|---|
| A | 7155 | 7030 | 2038 | 2038 | 28.48% | 28.99% | 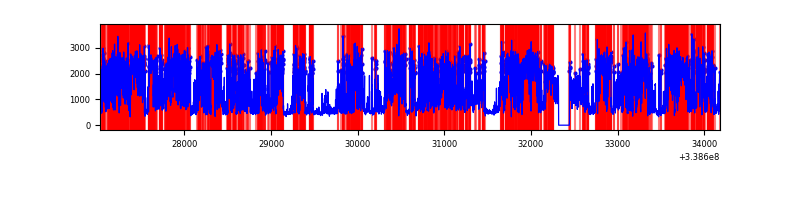 |
| B | 7156 | 7032 | 1 | 1 | 0.01% | 0.01% | 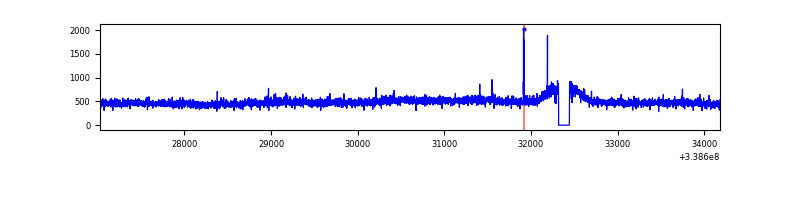 |
| C | 7155 | 7031 | 3 | 3 | 0.04% | 0.04% | 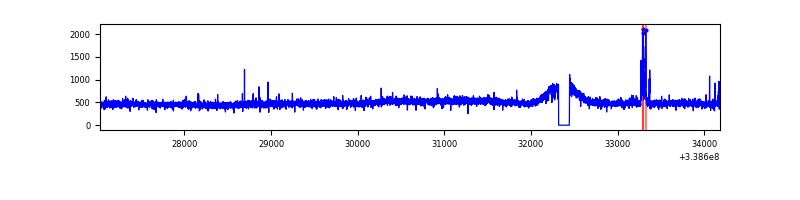 |
| D | 7155 | 7030 | 1554 | 1554 | 21.72% | 22.11% | 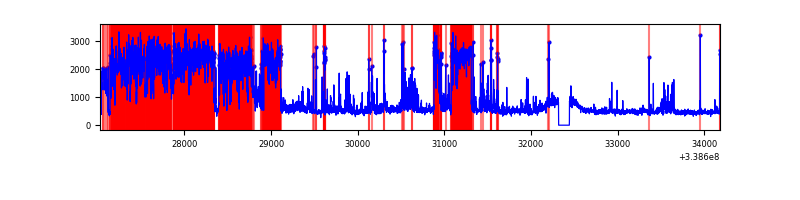 |
Top three noisy pixels from each quadrant. If the there are fewer than three noisy pixels in the level2.evt file, extra rows are filled as -1
| Pixel properties | Quadrant properties | ||||||
|---|---|---|---|---|---|---|---|
| Quadrant | DetID | PixID | Counts | Sigma | Mean | Median | Sigma |
| A | 14 | 235 | 7032540 | 46608.98 | 741 | 729 | 150.9 |
| A | 6 | 16 | 18177 | 115.65 | 741 | 729 | 150.9 |
| A | 5 | 168 | 16700 | 105.86 | 741 | 729 | 150.9 |
| B | 12 | 111 | 20479 | 116.23 | 879 | 859 | 168.8 |
| B | 11 | 111 | 18733 | 105.89 | 879 | 859 | 168.8 |
| B | 14 | 111 | 16715 | 93.94 | 879 | 859 | 168.8 |
| C | 14 | 238 | 134487 | 666.97 | 849 | 856 | 200.4 |
| C | 15 | 208 | 52562 | 258.07 | 849 | 856 | 200.4 |
| C | 13 | 61 | 5826 | 24.81 | 849 | 856 | 200.4 |
| D | 1 | 52 | 3845804 | 20002.59 | 801 | 780 | 192.2 |
| D | 12 | 233 | 701291 | 3644.2 | 801 | 780 | 192.2 |
| D | 2 | 250 | 156573 | 810.47 | 801 | 780 | 192.2 |
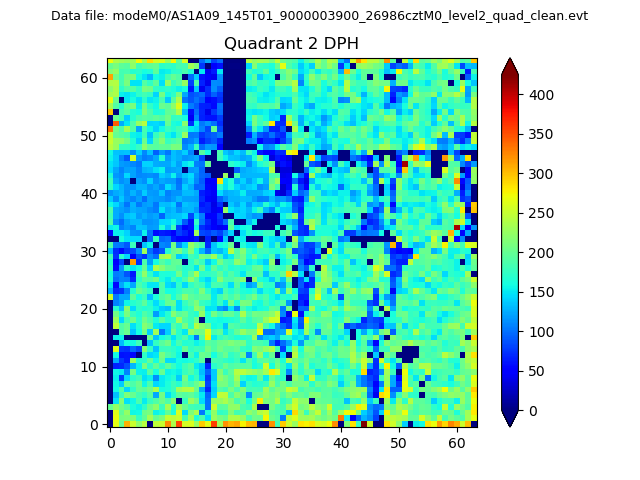
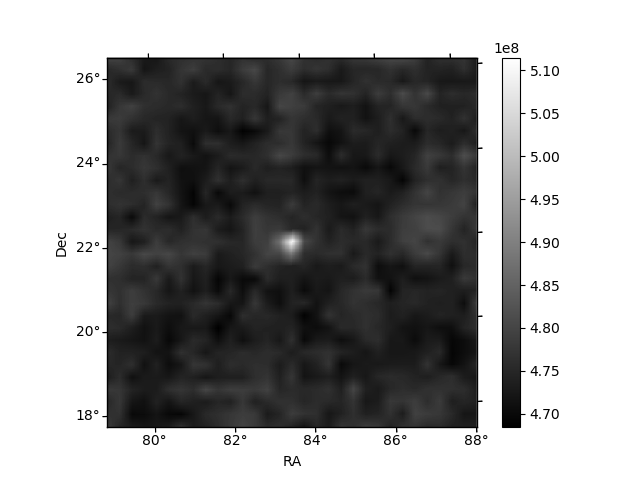
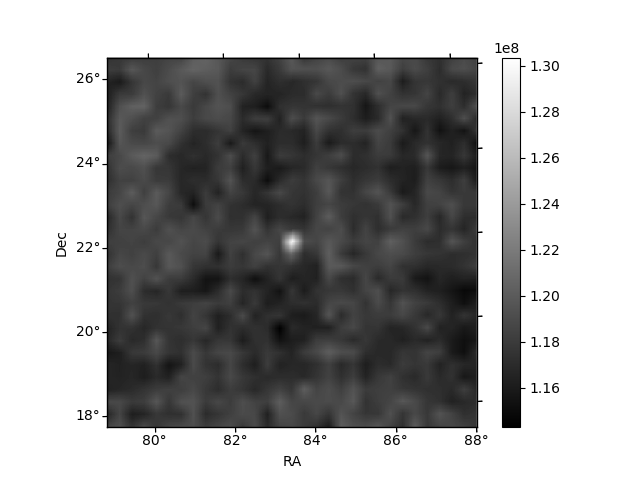
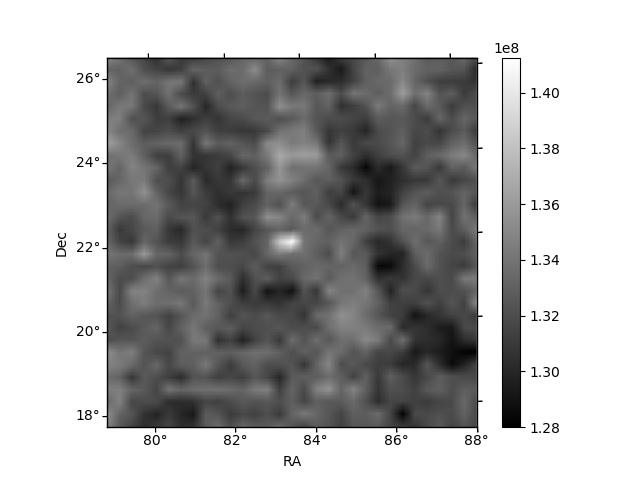
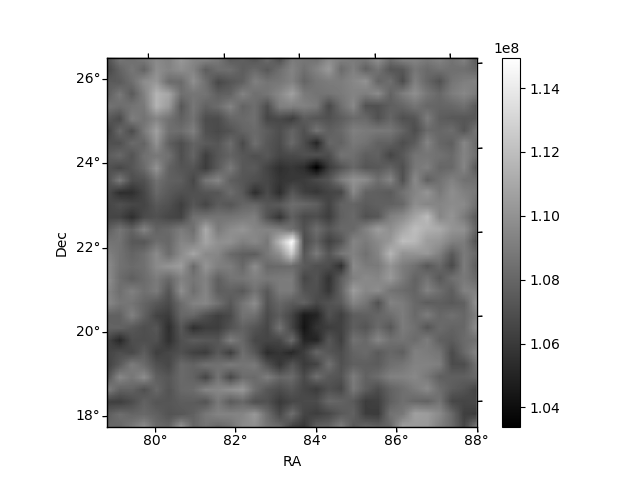
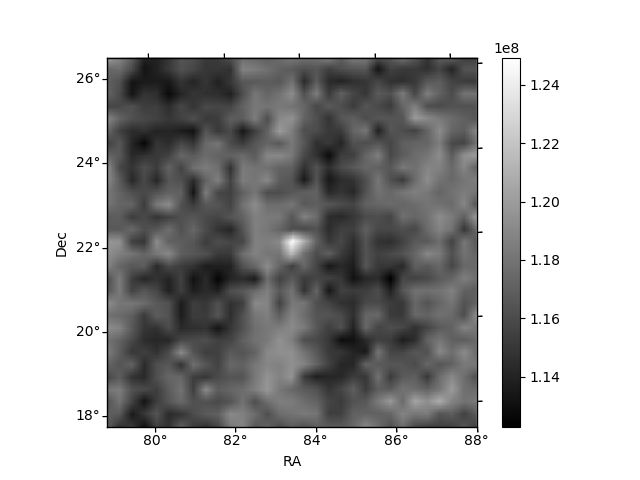
Histogram calculated using DETX and DETY for each event in the final _common_clean file
| Quadrant A | 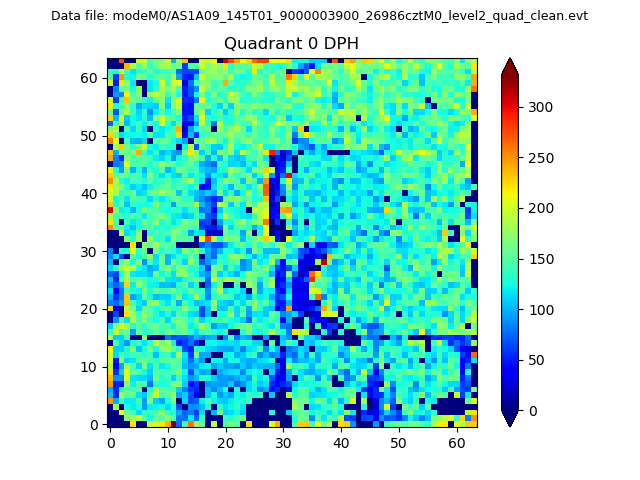 |
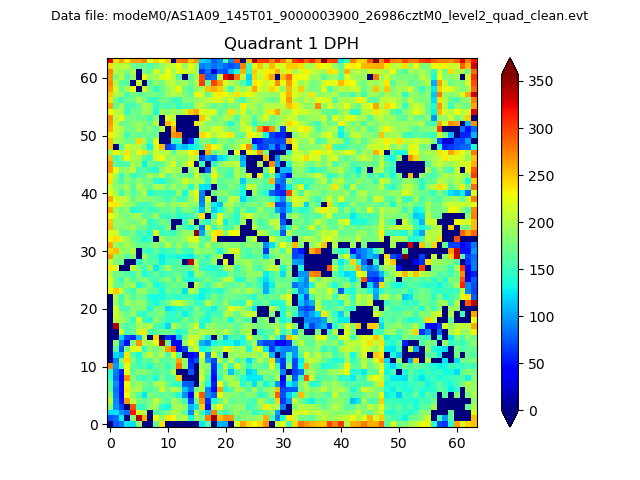 |
Quadrant B |
|---|---|---|---|
| Quadrant D | 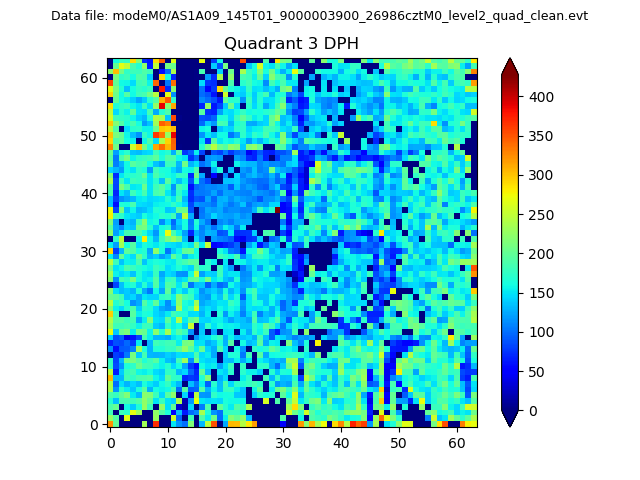 |
 |
Quadrant C |
| Plot type | Count rate plots | Images |
|---|---|---|
| Comparison with Poisson distribution Blue bars denote a histogram of data divided into 1 sec bins. Red curve is a Poisson curve with rate = median count rate of data. |
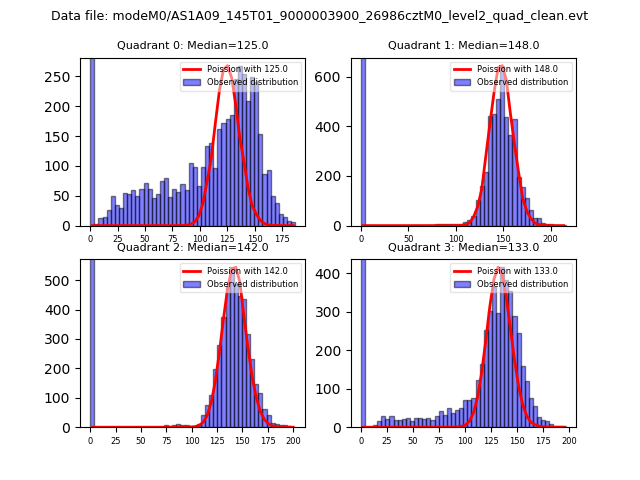 |
 |
| Quadrant-wise count rates Data is divided into 100 sec bins |
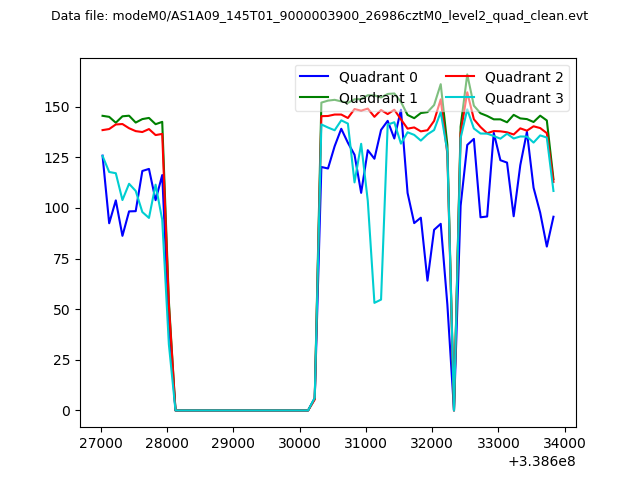 |
|
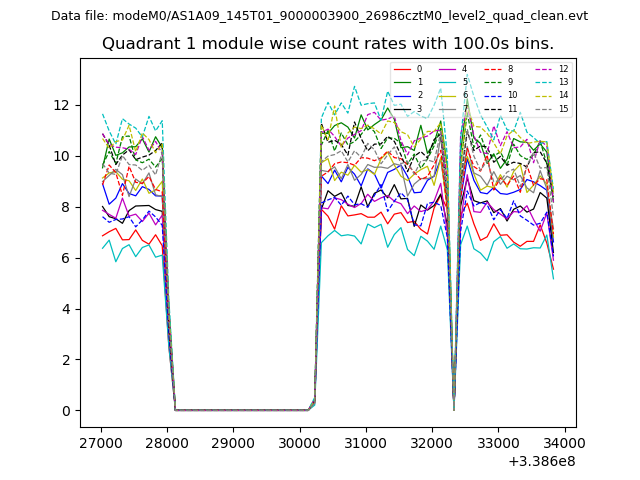
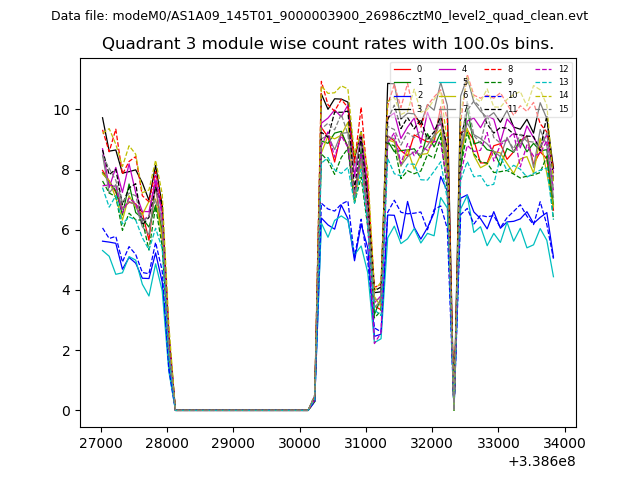
| Module-wise count rates for Quadrant A Data is divided into 100 sec bins |
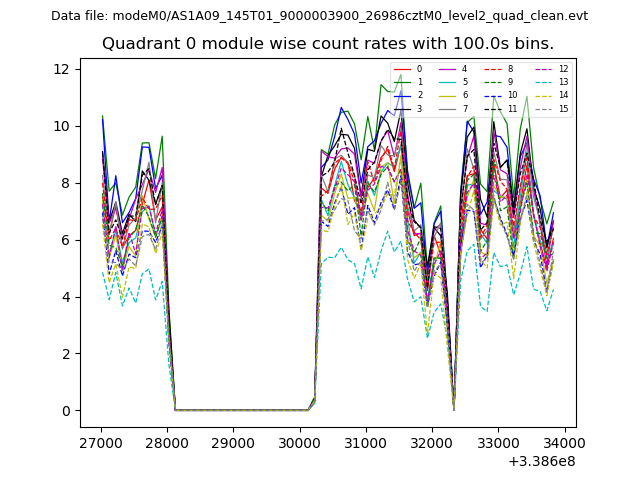 |
 |
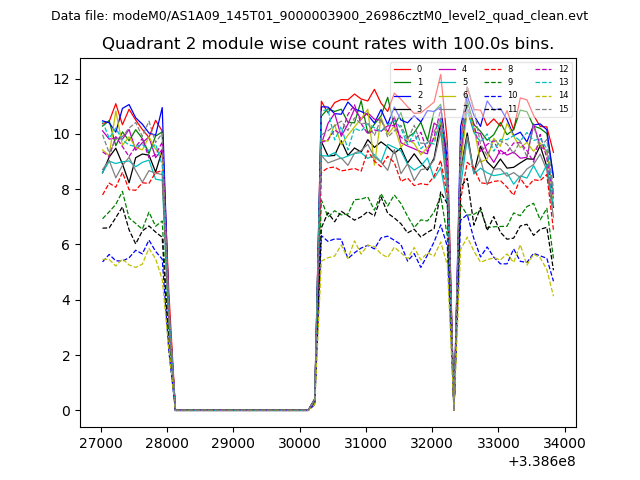
| Module-wise count rates for Quadrant B Data is divided into 100 sec bins |
 |
 |
| Module-wise count rates for Quadrant C Data is divided into 100 sec bins |
 |
 |
| Module-wise count rates for Quadrant D Data is divided into 100 sec bins |
 |
 |
| Parameter | Plot |
|---|---|
| CZT HV Monitor | 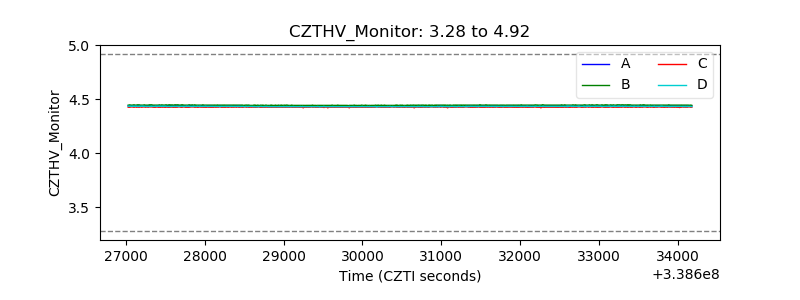 |
| D_VDD | 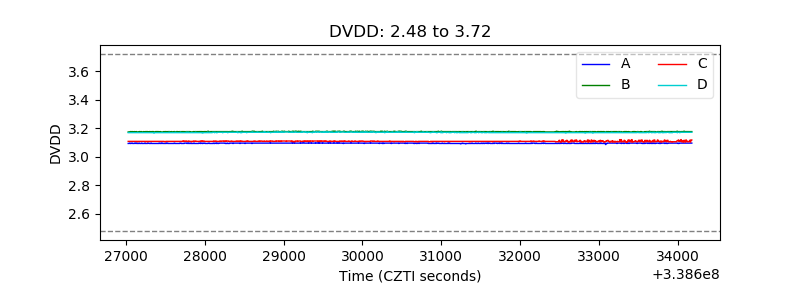 |
| Temperature 1 | 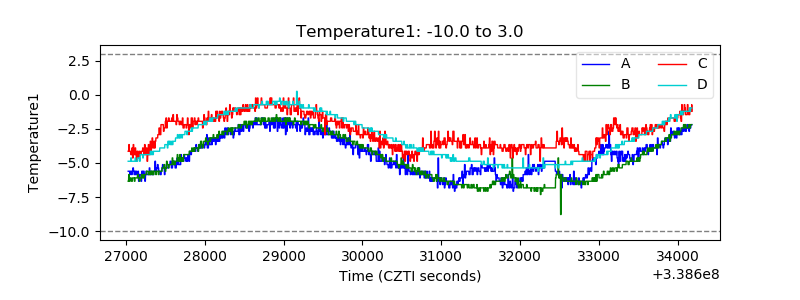 |
| Veto HV Monitor | 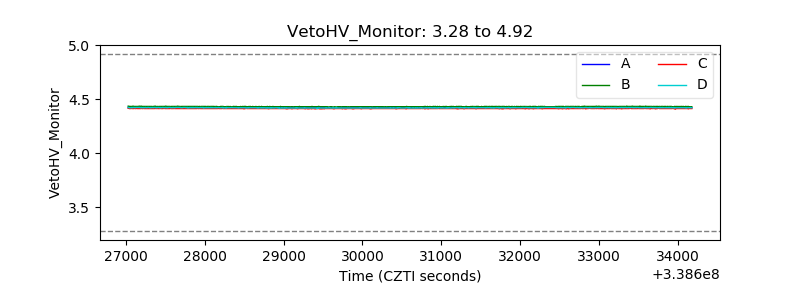 |
| Veto LLD | 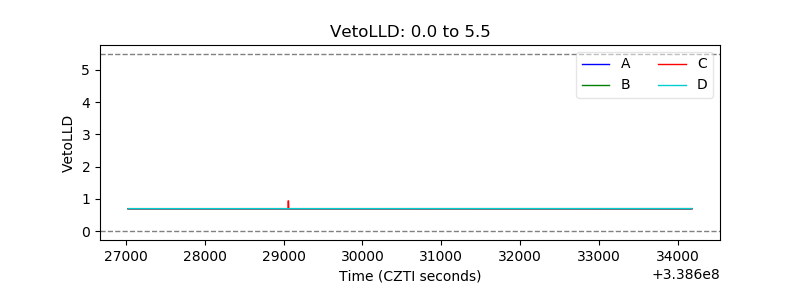 |
| Alpha Counter | 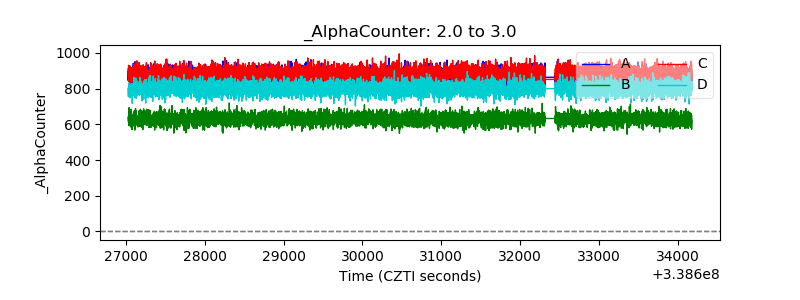 |
| _CPM_Rate | 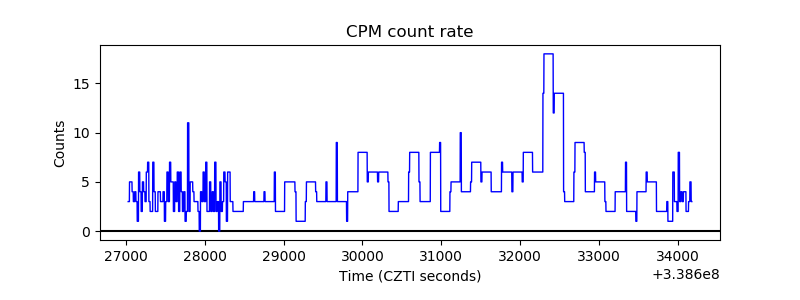 |
| CZT Counter | 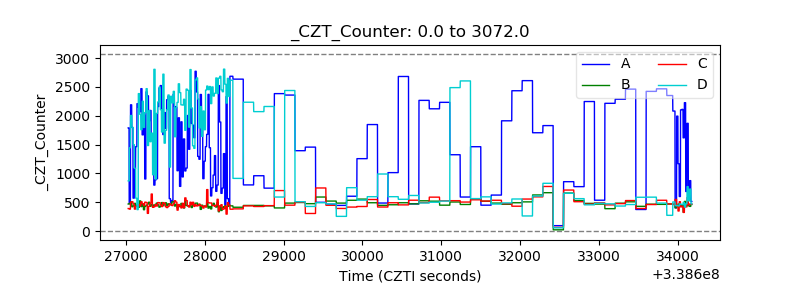 |
| +2.5 Volts monitor |  |
| +5 Volts monitor |  |
| _ROLL_ROT | 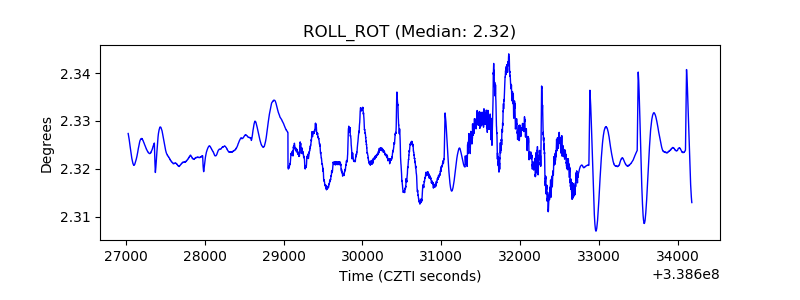 |
| _Roll_DEC | 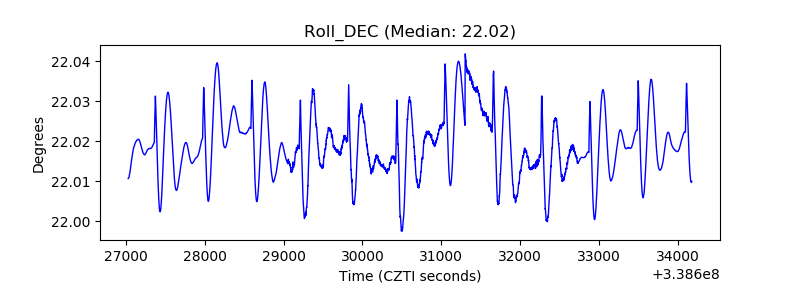 |
| _Roll_RA | 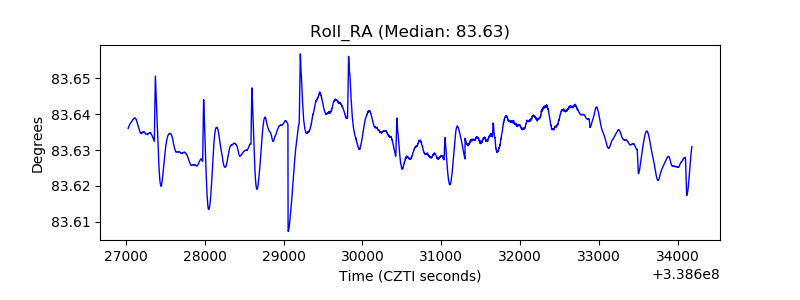 |
| Veto Counter | 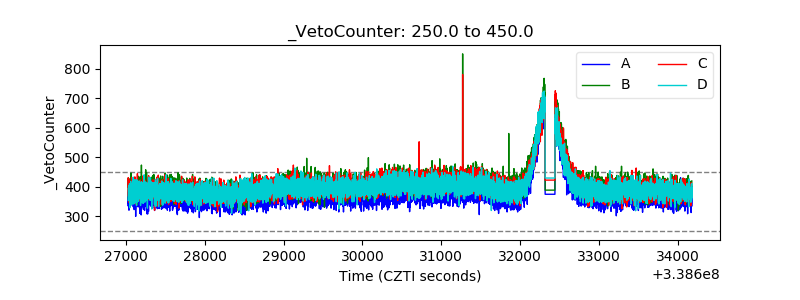 |