| Param | Original file | Final file |
|---|---|---|
| Filename | modeM0/AS1A09_145T01_9000003900_26987cztM0_level2.evt | modeM0/AS1A09_145T01_9000003900_26987cztM0_level2_quad_clean.evt |
| Size (bytes) | 685,391,040 | 90,596,160 |
| Size | 653.6 MB | 86.4 MB |
| Events in quadrant A | 8,684,991 | 515,509 |
| Events in quadrant B | 3,430,366 | 606,655 |
| Events in quadrant C | 3,515,982 | 579,315 |
| Events in quadrant D | 4,651,415 | 553,548 |
| Mode M0 | |||
|---|---|---|---|
| Quadrant | BADHDUFLAG | Total packets | Discarded packets |
| A | 0 | 30536 | 0 |
| B | 0 | 14350 | 0 |
| C | 0 | 14586 | 0 |
| D | 0 | 18334 | 0 |
| Mode M9 | |||
|---|---|---|---|
| Quadrant | BADHDUFLAG | Total packets | Discarded packets |
| A | 0 | 4 | 0 |
| B | 0 | 4 | 0 |
| C | 0 | 4 | 0 |
| D | 0 | 4 | 0 |
| Quadrant | Total seconds | Saturated seconds | Saturation percentage |
|---|---|---|---|
| A | 7006 | 2254 | 32.172424% |
| B | 7007 | 81 | 1.155987% |
| C | 7006 | 98 | 1.398801% |
| D | 7006 | 269 | 3.839566% |
Noise dominated data is calculated using 1-second bins in cleaned event files. If a bin has >2000 counts, and if more than 50% of those come from <1% of pixels, then it is considered to be noise-dominated and hence unusable.
| Quadrant | # 1 sec bins | Bins with >0 counts | Bins with >2000 counts | High rate bins dominated by noise | Noise dominated (total time) | Noise dominated (detector-on time) | Marked lightcurve |
|---|---|---|---|---|---|---|---|
| A | 7371 | 7006 | 1531 | 1531 | 20.77% | 21.85% | 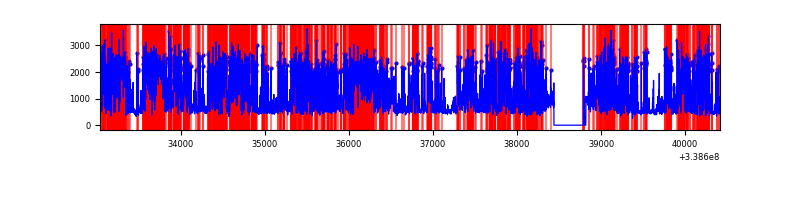 |
| B | 7372 | 7007 | 0 | 0 | 0.00% | 0.00% | 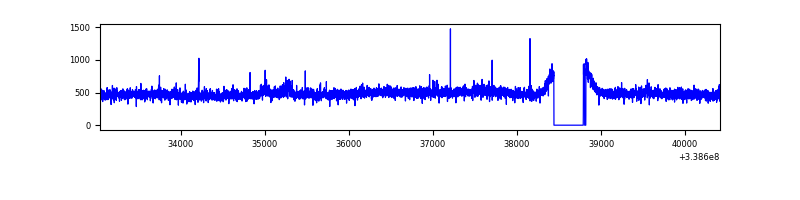 |
| C | 7371 | 7006 | 6 | 6 | 0.08% | 0.09% | 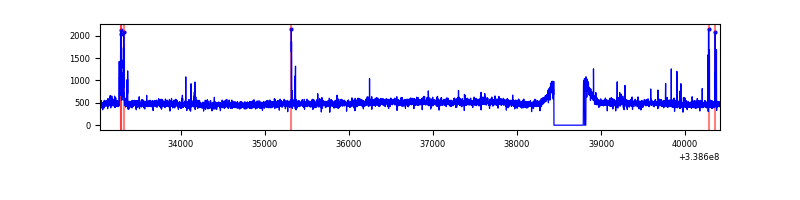 |
| D | 7371 | 7006 | 189 | 189 | 2.56% | 2.70% | 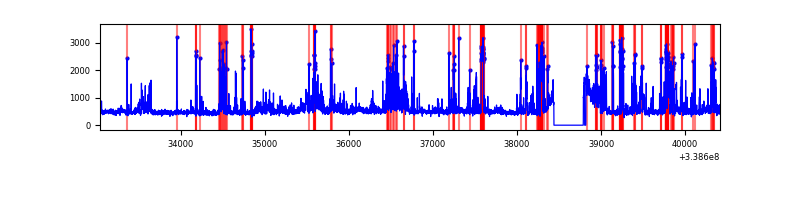 |
Top three noisy pixels from each quadrant. If the there are fewer than three noisy pixels in the level2.evt file, extra rows are filled as -1
| Pixel properties | Quadrant properties | ||||||
|---|---|---|---|---|---|---|---|
| Quadrant | DetID | PixID | Counts | Sigma | Mean | Median | Sigma |
| A | 14 | 235 | 5622606 | 36126.59 | 761 | 746 | 155.6 |
| A | 6 | 16 | 81894 | 521.46 | 761 | 746 | 155.6 |
| A | 5 | 168 | 27099 | 169.35 | 761 | 746 | 155.6 |
| B | 0 | 219 | 25586 | 147.8 | 869 | 848 | 167.4 |
| B | 12 | 111 | 20488 | 117.34 | 869 | 848 | 167.4 |
| B | 11 | 111 | 18486 | 105.38 | 869 | 848 | 167.4 |
| C | 14 | 238 | 133568 | 667.02 | 838 | 848 | 199.0 |
| C | 15 | 208 | 59353 | 294.03 | 838 | 848 | 199.0 |
| C | 2 | 16 | 28778 | 140.37 | 838 | 848 | 199.0 |
| D | 1 | 52 | 1103149 | 5499.19 | 835 | 814 | 200.5 |
| D | 2 | 250 | 211205 | 1049.57 | 835 | 814 | 200.5 |
| D | 12 | 233 | 119849 | 593.82 | 835 | 814 | 200.5 |
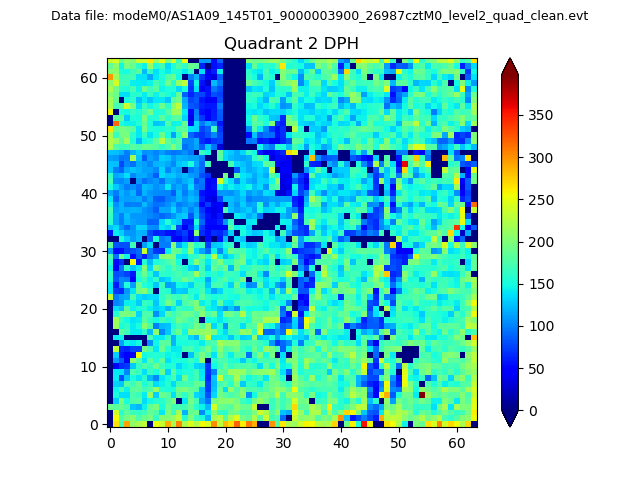
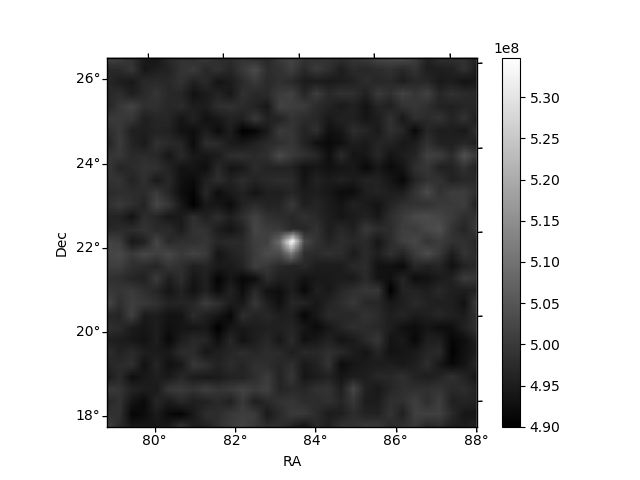
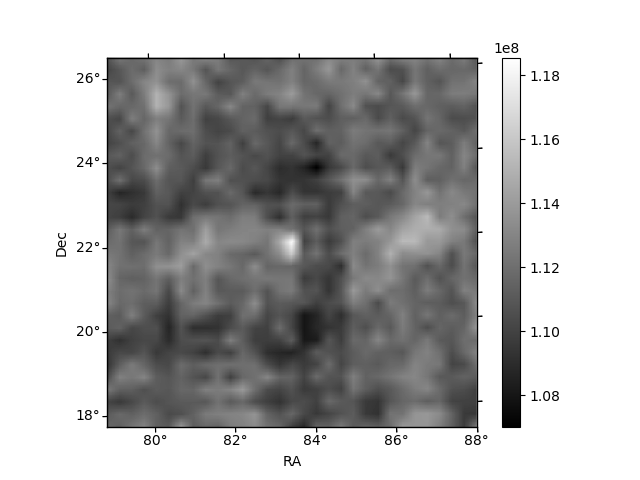
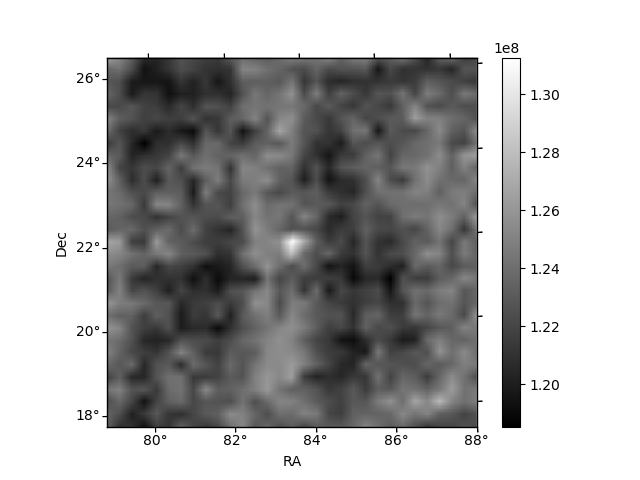
Histogram calculated using DETX and DETY for each event in the final _common_clean file
| Quadrant A | 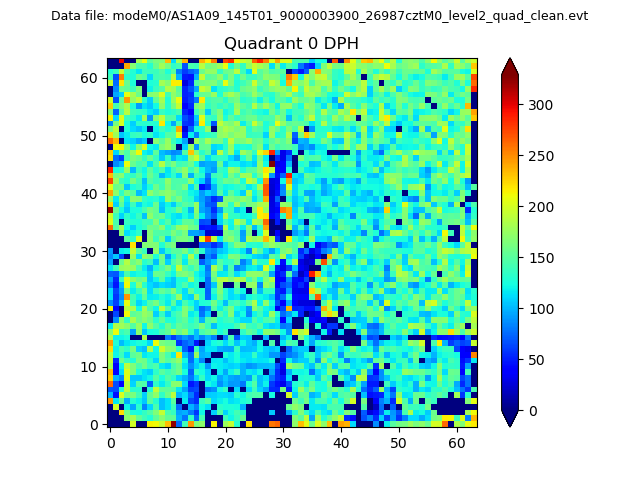 |
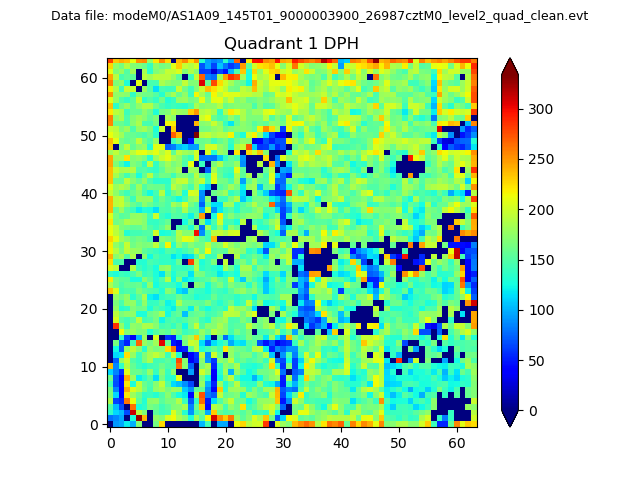 |
Quadrant B |
|---|---|---|---|
| Quadrant D | 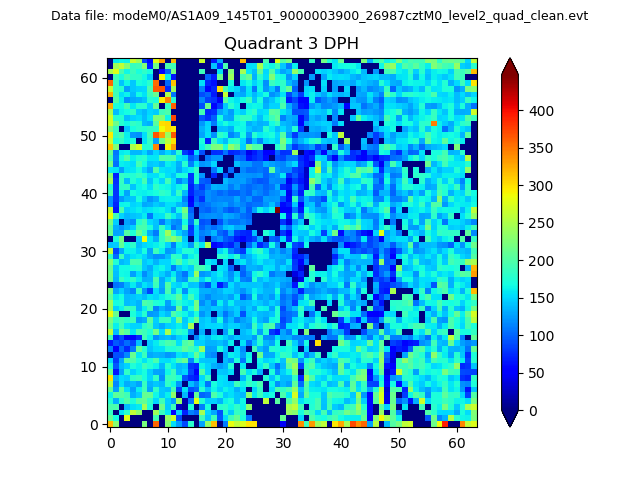 |
 |
Quadrant C |
| Plot type | Count rate plots | Images |
|---|---|---|
| Comparison with Poisson distribution Blue bars denote a histogram of data divided into 1 sec bins. Red curve is a Poisson curve with rate = median count rate of data. |
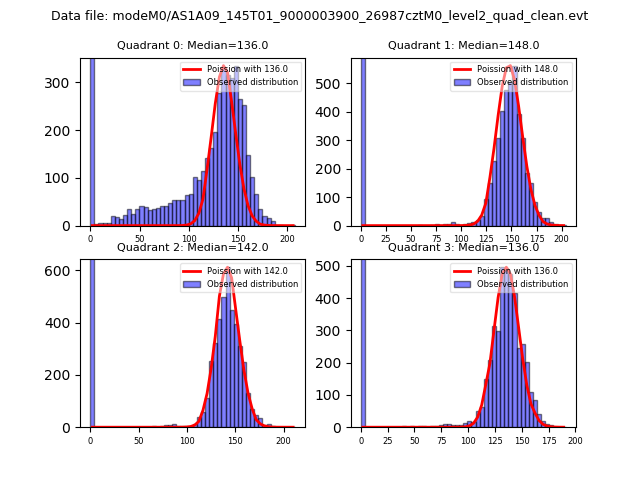 |
 |
| Quadrant-wise count rates Data is divided into 100 sec bins |
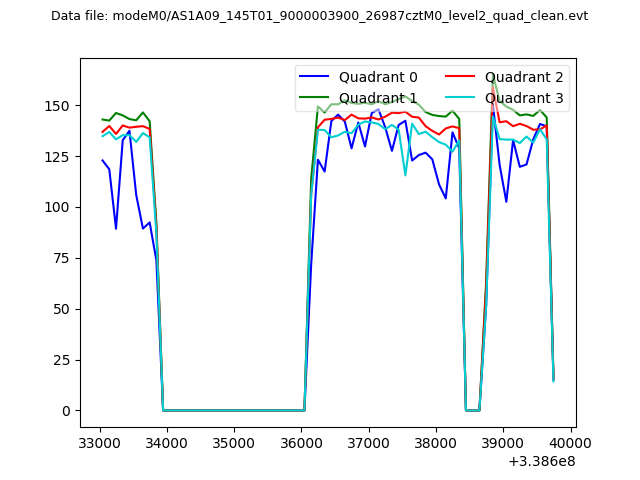 |
|
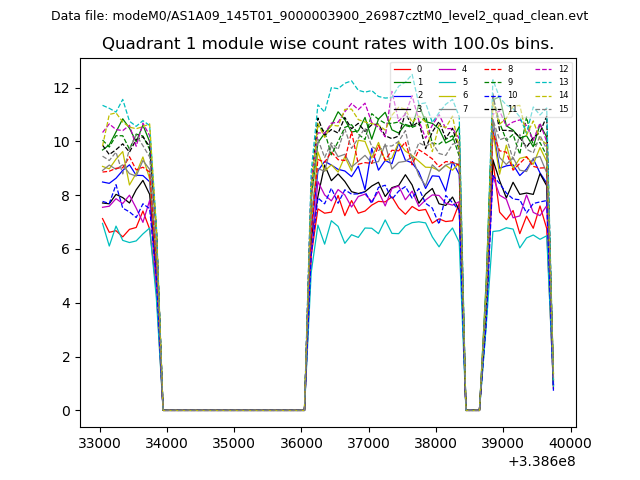
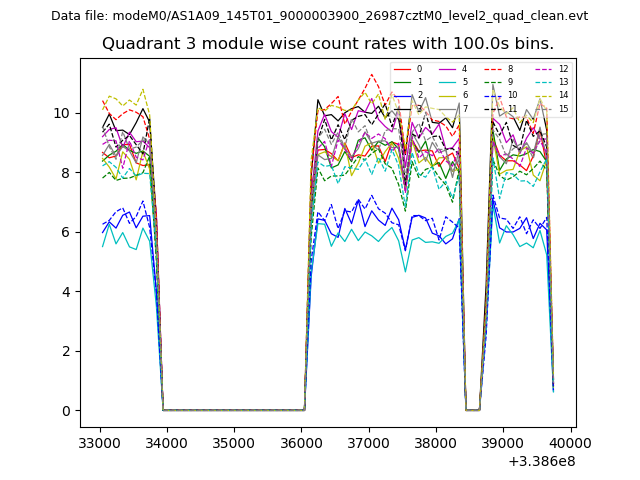
| Module-wise count rates for Quadrant A Data is divided into 100 sec bins |
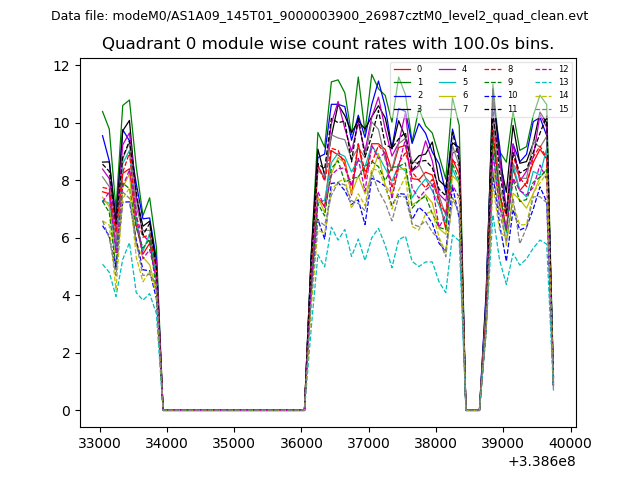 |
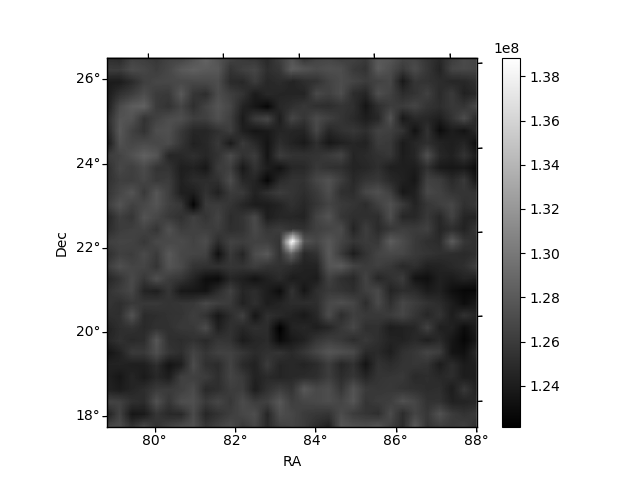 |
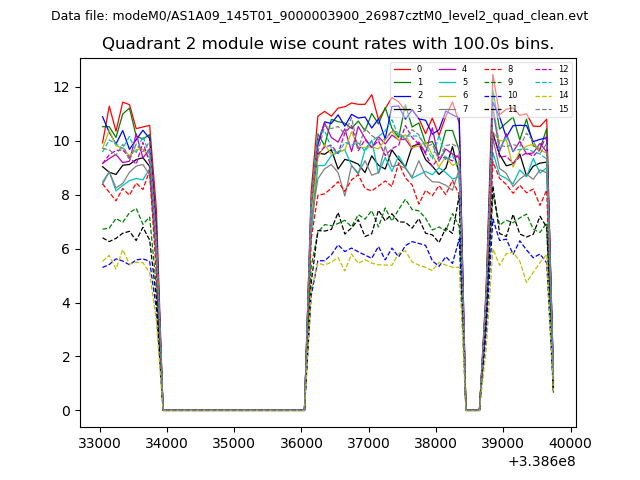
| Module-wise count rates for Quadrant B Data is divided into 100 sec bins |
 |
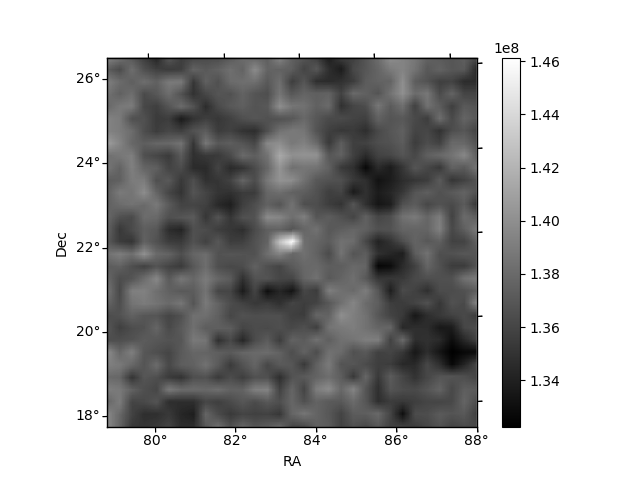 |
| Module-wise count rates for Quadrant C Data is divided into 100 sec bins |
 |
 |
| Module-wise count rates for Quadrant D Data is divided into 100 sec bins |
 |
 |
| Parameter | Plot |
|---|---|
| CZT HV Monitor | 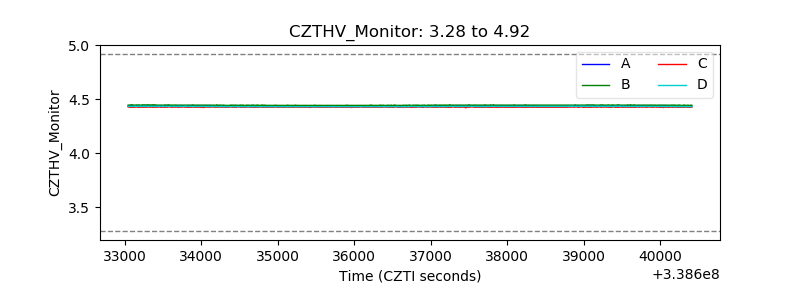 |
| D_VDD | 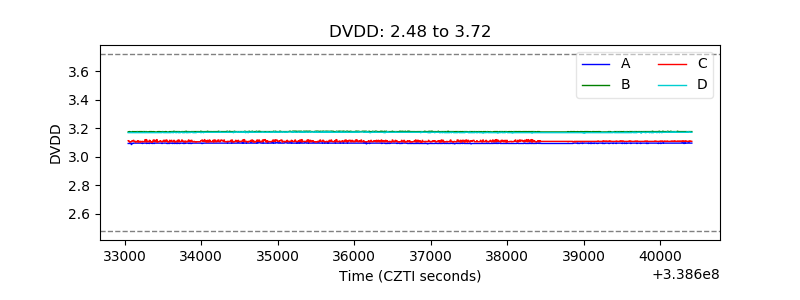 |
| Temperature 1 | 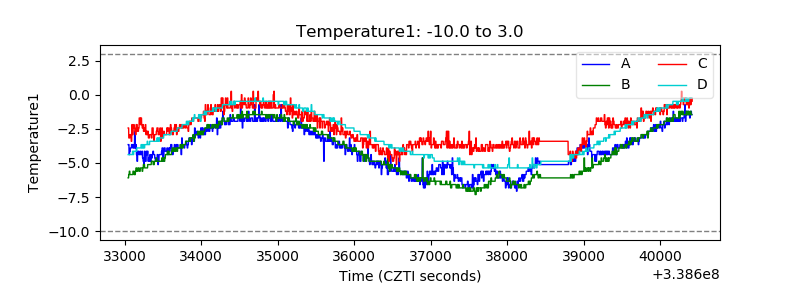 |
| Veto HV Monitor | 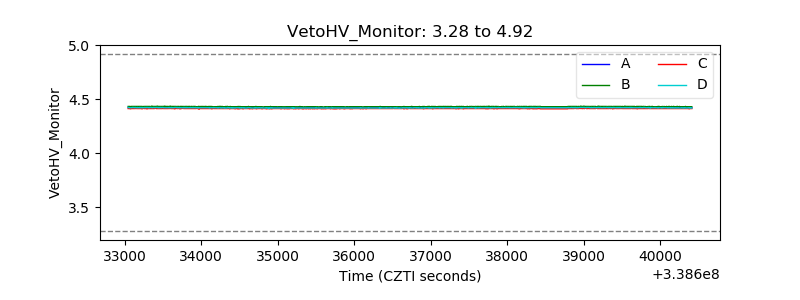 |
| Veto LLD | 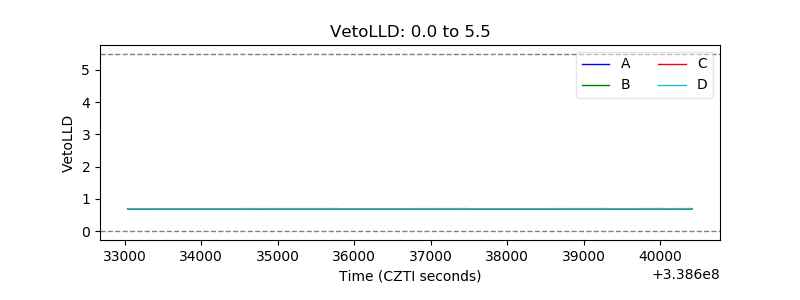 |
| Alpha Counter |  |
| _CPM_Rate | 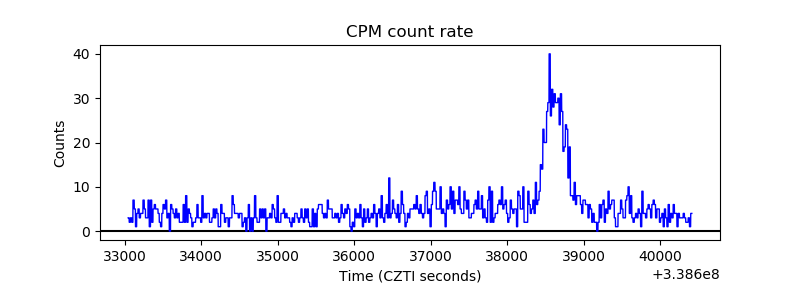 |
| CZT Counter | 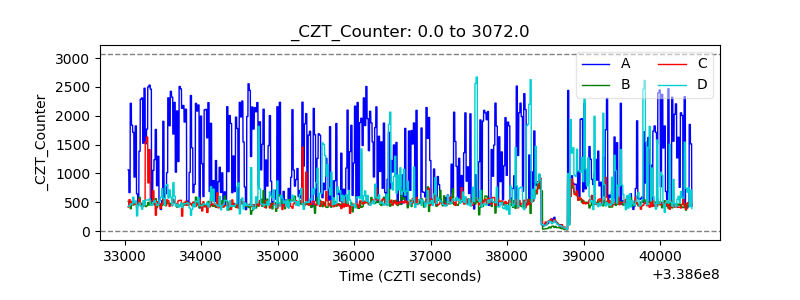 |
| +2.5 Volts monitor |  |
| +5 Volts monitor |  |
| _ROLL_ROT | 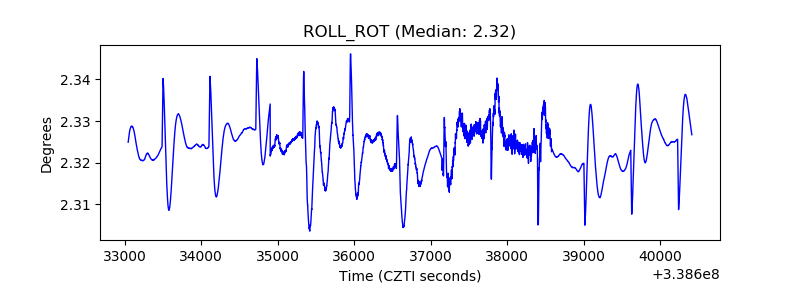 |
| _Roll_DEC | 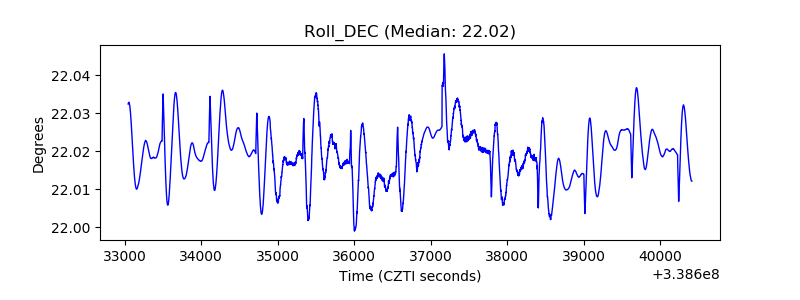 |
| _Roll_RA | 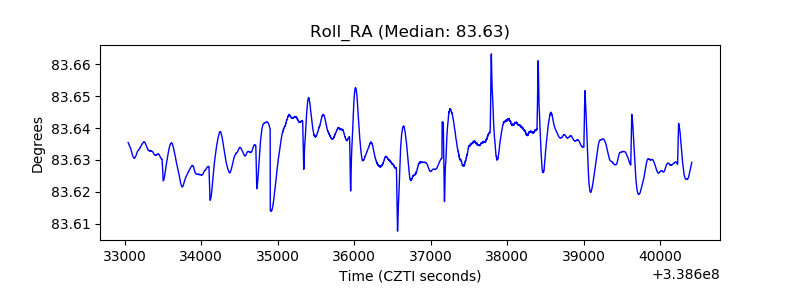 |
| Veto Counter | 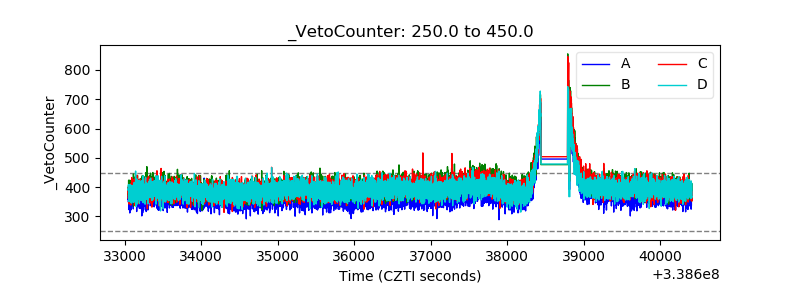 |