| Param | Original file | Final file |
|---|---|---|
| Filename | modeM0/AS1A09_145T01_9000003900_26989cztM0_level2.evt | modeM0/AS1A09_145T01_9000003900_26989cztM0_level2_quad_clean.evt |
| Size (bytes) | 1,336,400,640 | 139,222,080 |
| Size | 1.2 GB | 132.8 MB |
| Events in quadrant A | 15,574,650 | 685,405 |
| Events in quadrant B | 6,080,920 | 933,527 |
| Events in quadrant C | 6,230,073 | 890,525 |
| Events in quadrant D | 11,755,047 | 851,591 |
| Mode M0 | |||
|---|---|---|---|
| Quadrant | BADHDUFLAG | Total packets | Discarded packets |
| A | 0 | 54586 | 0 |
| B | 0 | 25289 | 0 |
| C | 0 | 25701 | 0 |
| D | 0 | 43291 | 0 |
| Mode M9 | |||
|---|---|---|---|
| Quadrant | BADHDUFLAG | Total packets | Discarded packets |
| A | 0 | 12 | 0 |
| B | 0 | 12 | 0 |
| C | 0 | 12 | 0 |
| D | 0 | 12 | 0 |
| Quadrant | Total seconds | Saturated seconds | Saturation percentage |
|---|---|---|---|
| A | 12346 | 4147 | 33.589827% |
| B | 12346 | 130 | 1.052973% |
| C | 12346 | 202 | 1.636157% |
| D | 12346 | 1458 | 11.809493% |
Noise dominated data is calculated using 1-second bins in cleaned event files. If a bin has >2000 counts, and if more than 50% of those come from <1% of pixels, then it is considered to be noise-dominated and hence unusable.
| Quadrant | # 1 sec bins | Bins with >0 counts | Bins with >2000 counts | High rate bins dominated by noise | Noise dominated (total time) | Noise dominated (detector-on time) | Marked lightcurve |
|---|---|---|---|---|---|---|---|
| A | 13591 | 12346 | 3022 | 3022 | 22.24% | 24.48% | 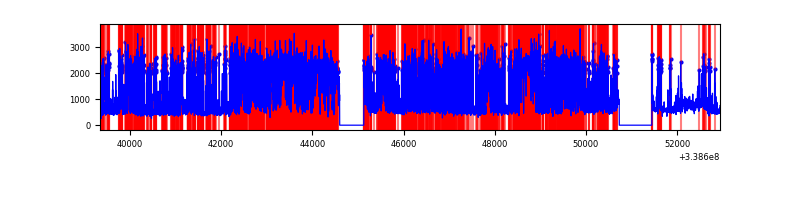 |
| B | 13591 | 12346 | 0 | 0 | 0.00% | 0.00% | 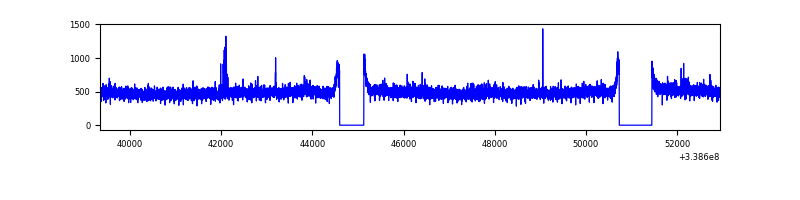 |
| C | 13591 | 12346 | 16 | 16 | 0.12% | 0.13% | 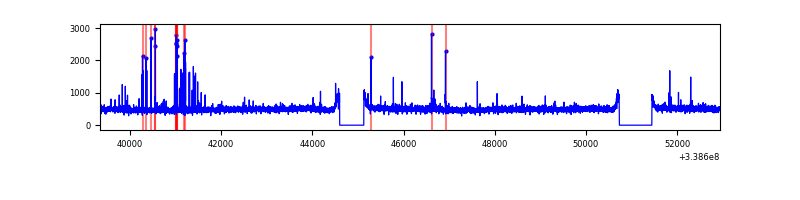 |
| D | 13591 | 12346 | 1186 | 1186 | 8.73% | 9.61% | 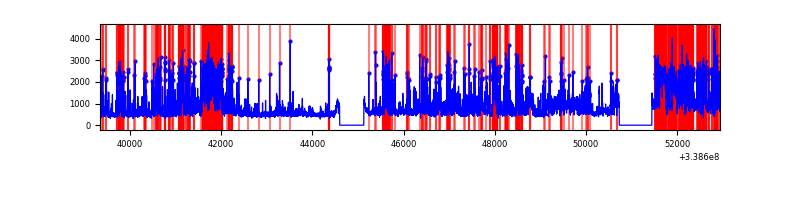 |
Top three noisy pixels from each quadrant. If the there are fewer than three noisy pixels in the level2.evt file, extra rows are filled as -1
| Pixel properties | Quadrant properties | ||||||
|---|---|---|---|---|---|---|---|
| Quadrant | DetID | PixID | Counts | Sigma | Mean | Median | Sigma |
| A | 14 | 235 | 8749186 | 33279.18 | 1310 | 1284 | 262.9 |
| A | 6 | 16 | 1672229 | 6356.69 | 1310 | 1284 | 262.9 |
| A | 5 | 168 | 62540 | 233.03 | 1310 | 1284 | 262.9 |
| B | 12 | 111 | 35933 | 116.12 | 1542 | 1507 | 296.5 |
| B | 11 | 111 | 32443 | 104.35 | 1542 | 1507 | 296.5 |
| B | 14 | 111 | 28324 | 90.45 | 1542 | 1507 | 296.5 |
| C | 14 | 238 | 237562 | 670.11 | 1490 | 1504 | 352.3 |
| C | 2 | 16 | 128484 | 360.47 | 1490 | 1504 | 352.3 |
| C | 15 | 208 | 36726 | 99.99 | 1490 | 1504 | 352.3 |
| D | 1 | 52 | 3790559 | 10896.72 | 1446 | 1410 | 347.7 |
| D | 5 | 222 | 992219 | 2849.34 | 1446 | 1410 | 347.7 |
| D | 11 | 176 | 629656 | 1806.69 | 1446 | 1410 | 347.7 |
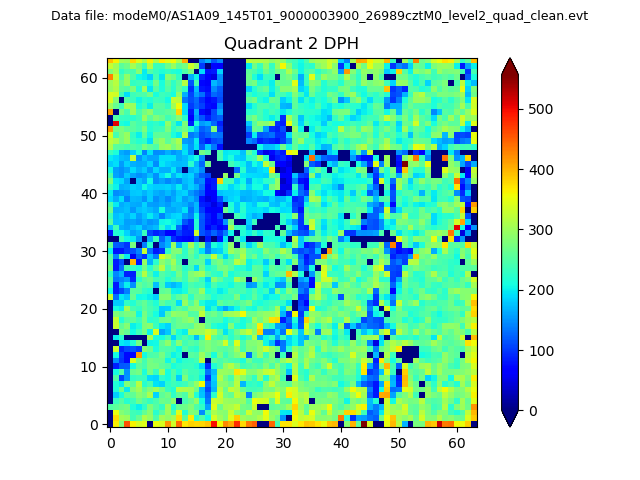
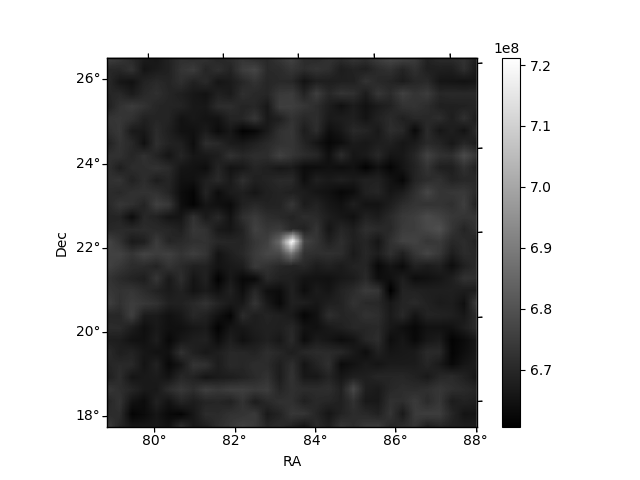
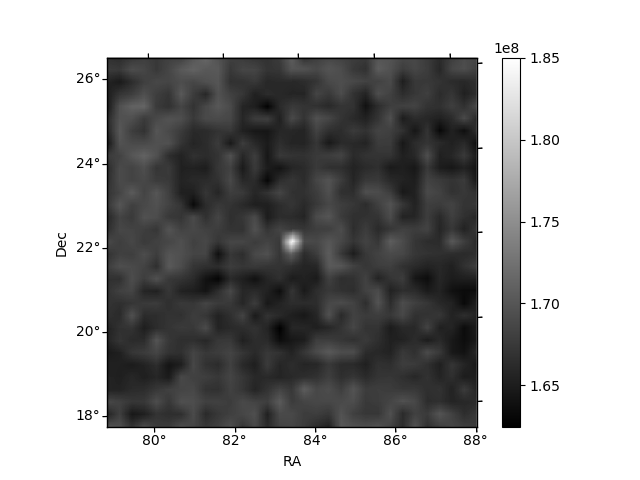
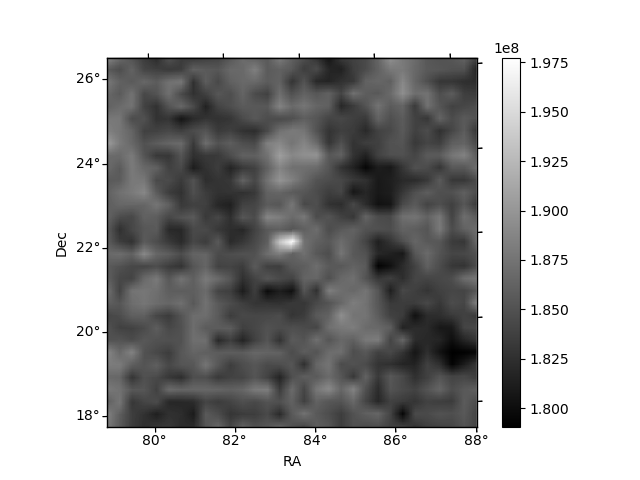
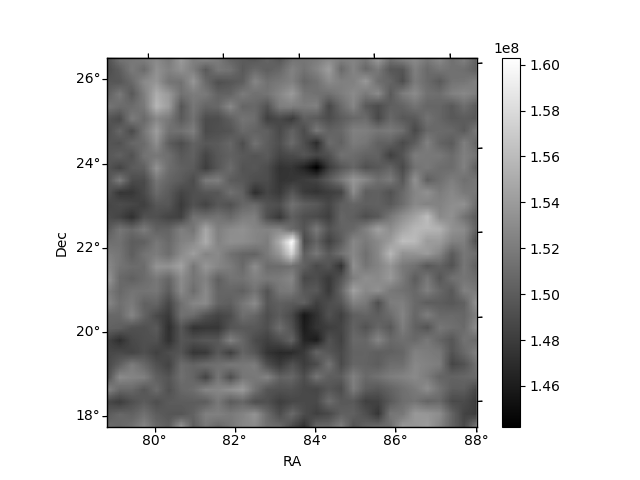
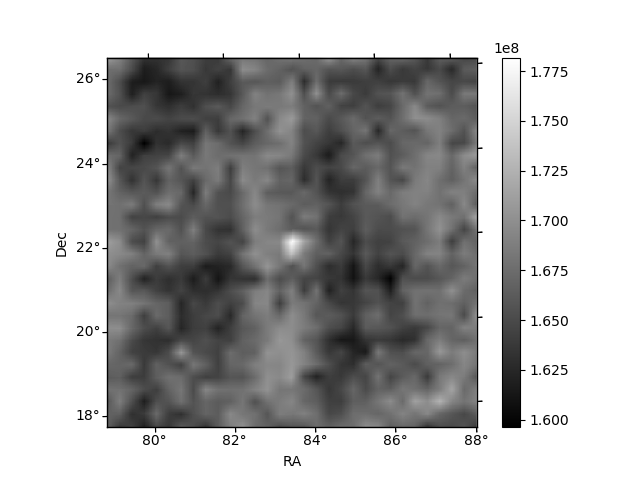
Histogram calculated using DETX and DETY for each event in the final _common_clean file
| Quadrant A | 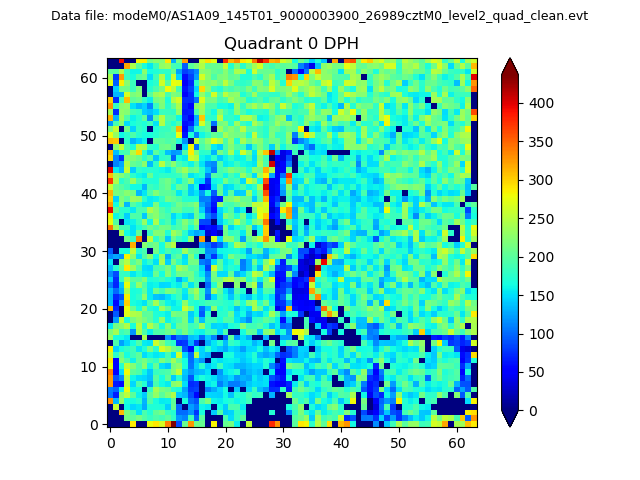 |
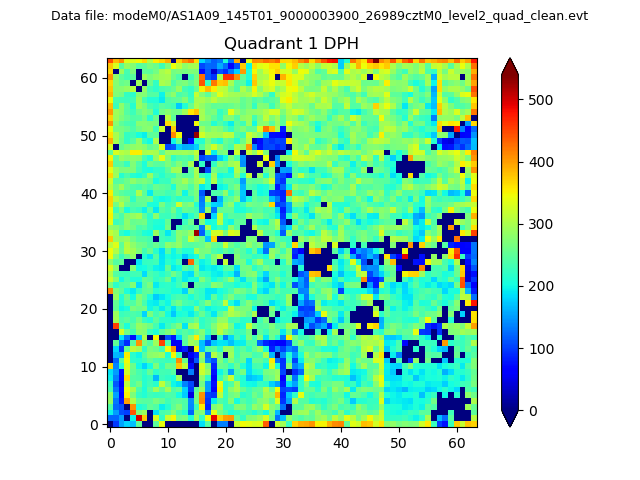 |
Quadrant B |
|---|---|---|---|
| Quadrant D | 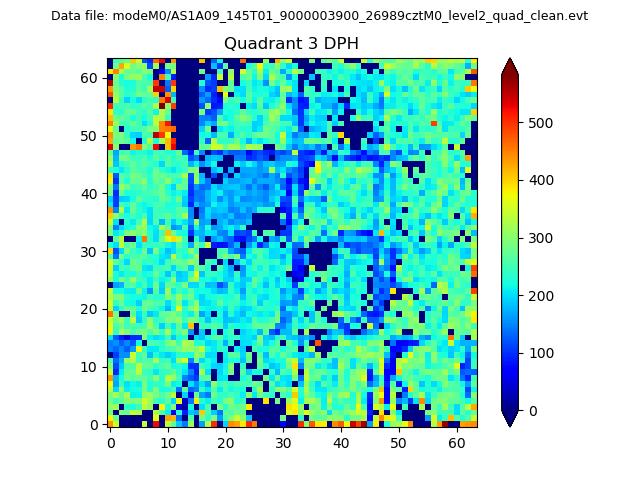 |
 |
Quadrant C |
| Plot type | Count rate plots | Images |
|---|---|---|
| Comparison with Poisson distribution Blue bars denote a histogram of data divided into 1 sec bins. Red curve is a Poisson curve with rate = median count rate of data. |
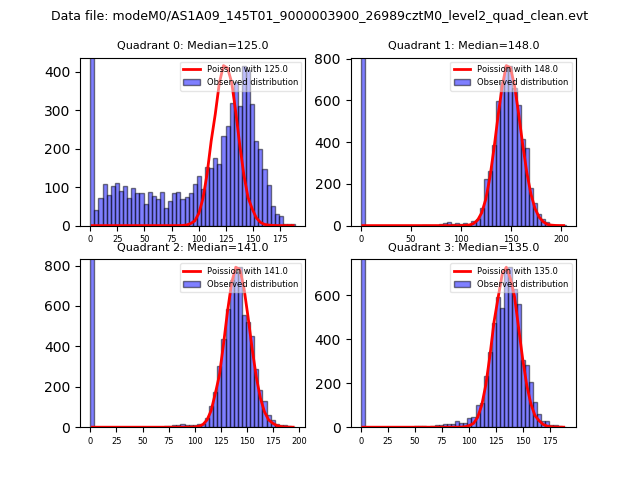 |
 |
| Quadrant-wise count rates Data is divided into 100 sec bins |
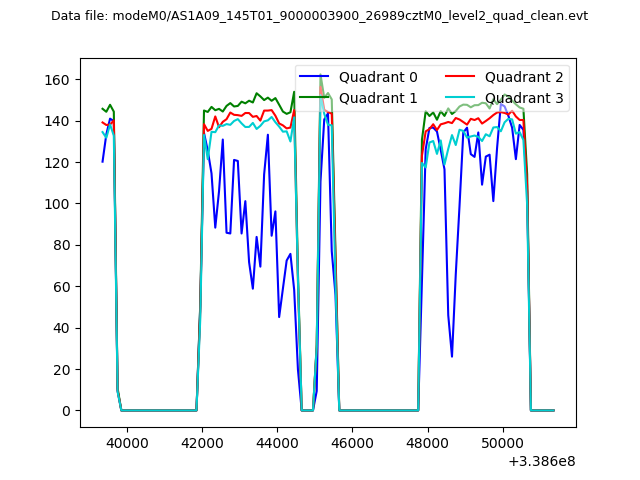 |
|
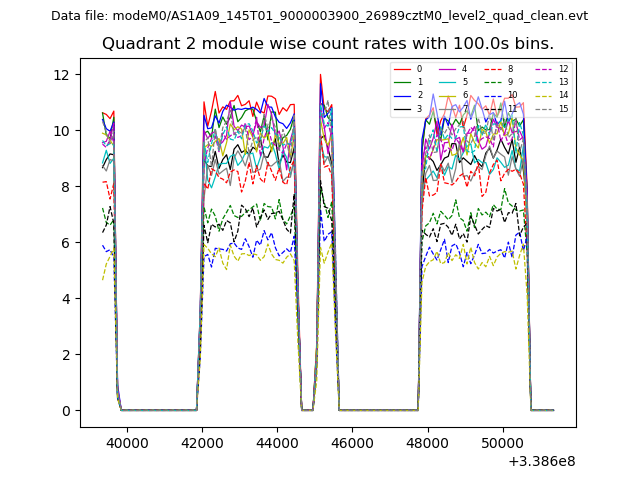
| Module-wise count rates for Quadrant A Data is divided into 100 sec bins |
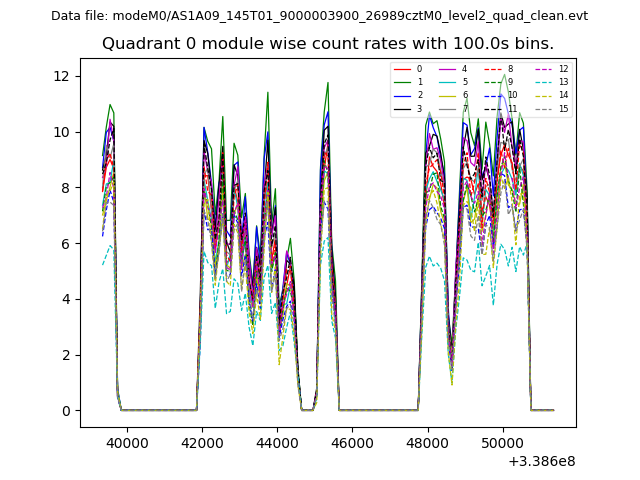 |
 |
| Module-wise count rates for Quadrant B Data is divided into 100 sec bins |
 |
 |
| Module-wise count rates for Quadrant C Data is divided into 100 sec bins |
 |
 |
| Module-wise count rates for Quadrant D Data is divided into 100 sec bins |
 |
 |
| Parameter | Plot |
|---|---|
| CZT HV Monitor | 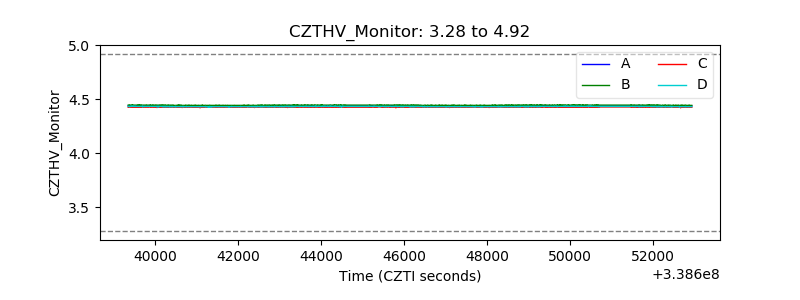 |
| D_VDD | 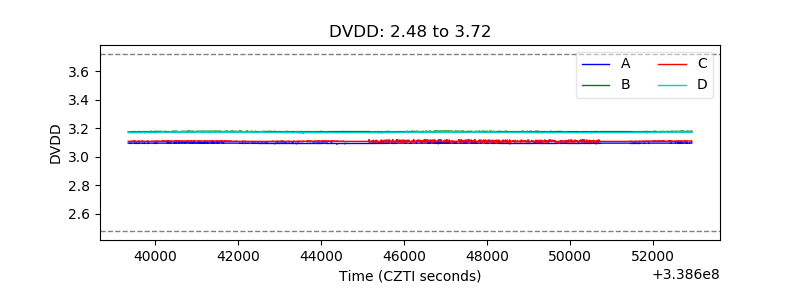 |
| Temperature 1 | 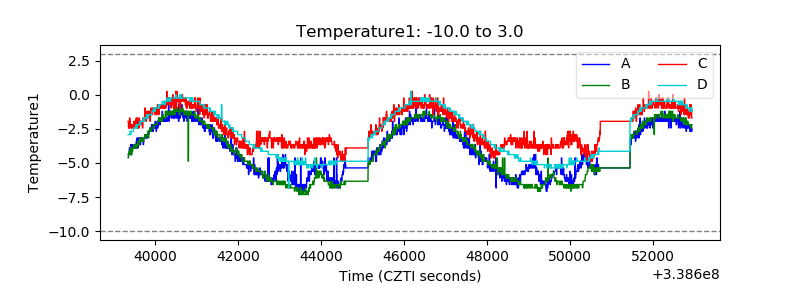 |
| Veto HV Monitor | 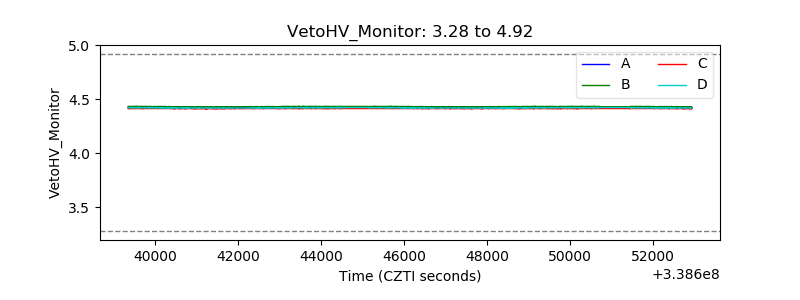 |
| Veto LLD | 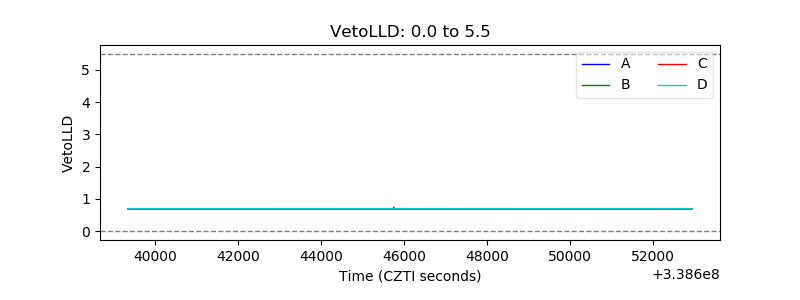 |
| Alpha Counter | 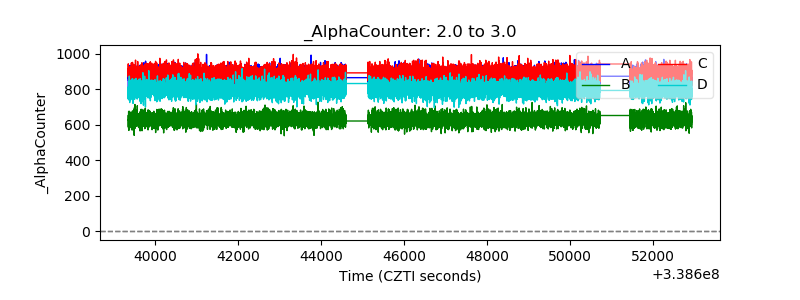 |
| _CPM_Rate | 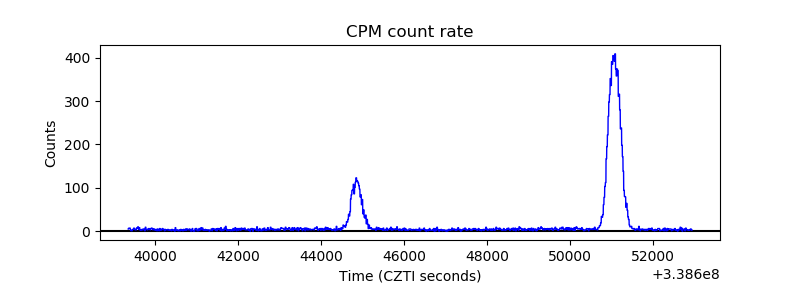 |
| CZT Counter | 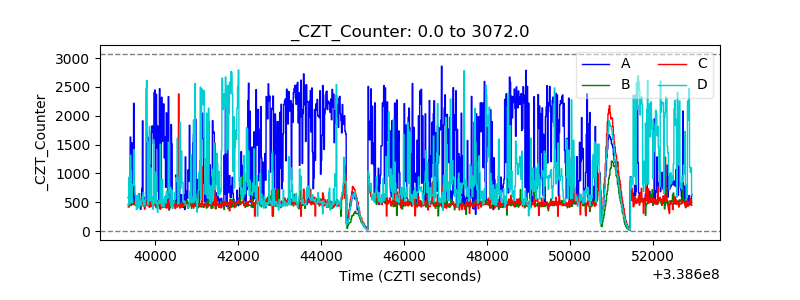 |
| +2.5 Volts monitor |  |
| +5 Volts monitor |  |
| _ROLL_ROT | 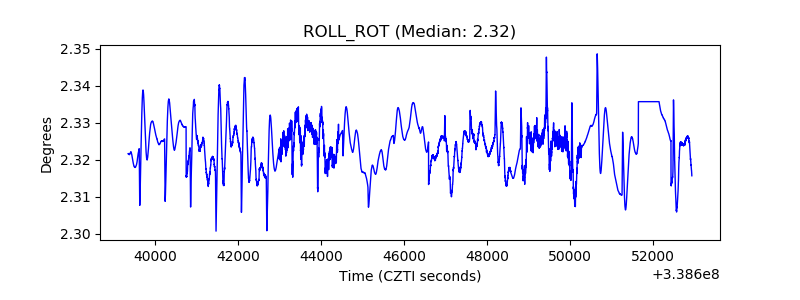 |
| _Roll_DEC |  |
| _Roll_RA | 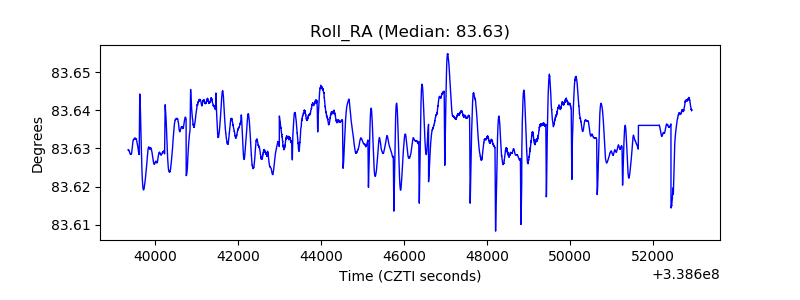 |
| Veto Counter | 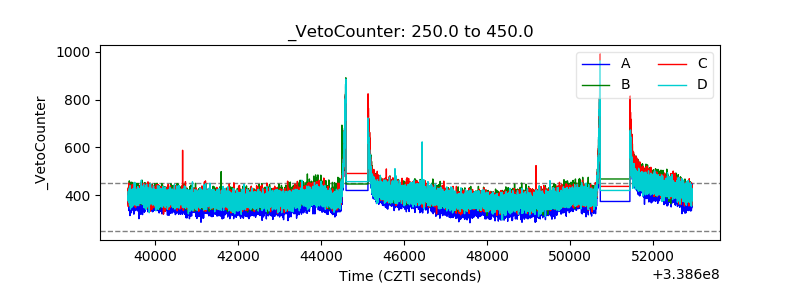 |