| Param | Original file | Final file |
|---|---|---|
| Filename | modeM0/AS1A09_145T01_9000003900_26990cztM0_level2.evt | modeM0/AS1A09_145T01_9000003900_26990cztM0_level2_quad_clean.evt |
| Size (bytes) | 708,013,440 | 74,203,200 |
| Size | 675.2 MB | 70.8 MB |
| Events in quadrant A | 6,071,441 | 432,323 |
| Events in quadrant B | 3,450,671 | 465,174 |
| Events in quadrant C | 3,489,409 | 446,947 |
| Events in quadrant D | 7,970,395 | 427,290 |
| Mode M0 | |||
|---|---|---|---|
| Quadrant | BADHDUFLAG | Total packets | Discarded packets |
| A | 0 | 22639 | 0 |
| B | 0 | 14239 | 0 |
| C | 0 | 14356 | 0 |
| D | 0 | 28395 | 0 |
| Mode M9 | |||
|---|---|---|---|
| Quadrant | BADHDUFLAG | Total packets | Discarded packets |
| A | 0 | 11 | 0 |
| B | 0 | 12 | 0 |
| C | 0 | 12 | 0 |
| D | 0 | 12 | 0 |
| Quadrant | Total seconds | Saturated seconds | Saturation percentage |
|---|---|---|---|
| A | 6814 | 832 | 12.210156% |
| B | 6814 | 69 | 1.012621% |
| C | 6813 | 102 | 1.497138% |
| D | 6813 | 1292 | 18.963746% |
Noise dominated data is calculated using 1-second bins in cleaned event files. If a bin has >2000 counts, and if more than 50% of those come from <1% of pixels, then it is considered to be noise-dominated and hence unusable.
| Quadrant | # 1 sec bins | Bins with >0 counts | Bins with >2000 counts | High rate bins dominated by noise | Noise dominated (total time) | Noise dominated (detector-on time) | Marked lightcurve |
|---|---|---|---|---|---|---|---|
| A | 7694 | 6814 | 560 | 560 | 7.28% | 8.22% | 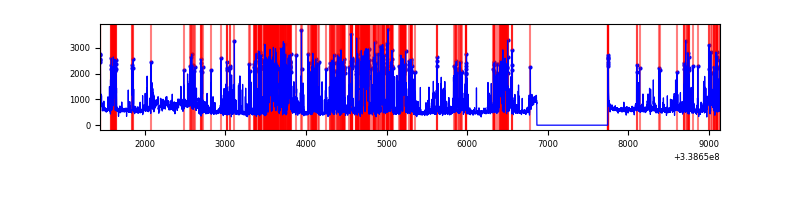 |
| B | 7694 | 6814 | 1 | 1 | 0.01% | 0.01% |  |
| C | 7693 | 6813 | 1 | 1 | 0.01% | 0.01% | 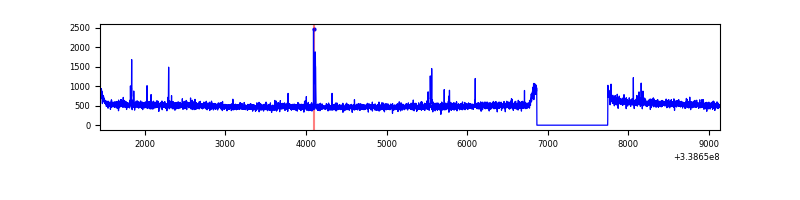 |
| D | 7693 | 6813 | 1011 | 1011 | 13.14% | 14.84% | 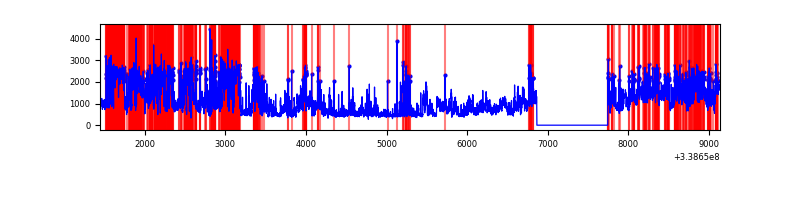 |
Top three noisy pixels from each quadrant. If the there are fewer than three noisy pixels in the level2.evt file, extra rows are filled as -1
| Pixel properties | Quadrant properties | ||||||
|---|---|---|---|---|---|---|---|
| Quadrant | DetID | PixID | Counts | Sigma | Mean | Median | Sigma |
| A | 14 | 235 | 2459102 | 14396.64 | 847 | 831 | 170.8 |
| A | 6 | 16 | 293996 | 1716.89 | 847 | 831 | 170.8 |
| A | 8 | 192 | 34859 | 199.28 | 847 | 831 | 170.8 |
| B | 12 | 111 | 20266 | 114.7 | 877 | 857 | 169.2 |
| B | 11 | 111 | 18055 | 101.63 | 877 | 857 | 169.2 |
| B | 14 | 111 | 15583 | 87.02 | 877 | 857 | 169.2 |
| C | 14 | 238 | 135242 | 668.83 | 849 | 858 | 200.9 |
| C | 15 | 208 | 42542 | 207.46 | 849 | 858 | 200.9 |
| C | 2 | 16 | 5873 | 24.96 | 849 | 858 | 200.9 |
| D | 1 | 52 | 3944207 | 20272.65 | 806 | 784 | 194.5 |
| D | 5 | 222 | 680122 | 3492.39 | 806 | 784 | 194.5 |
| D | 2 | 250 | 141654 | 724.2 | 806 | 784 | 194.5 |
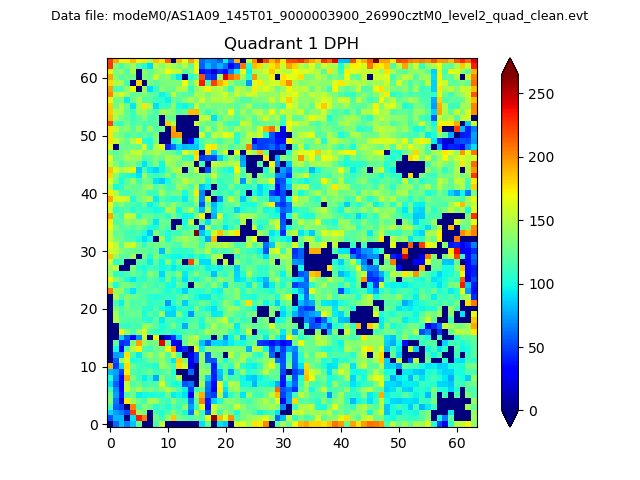
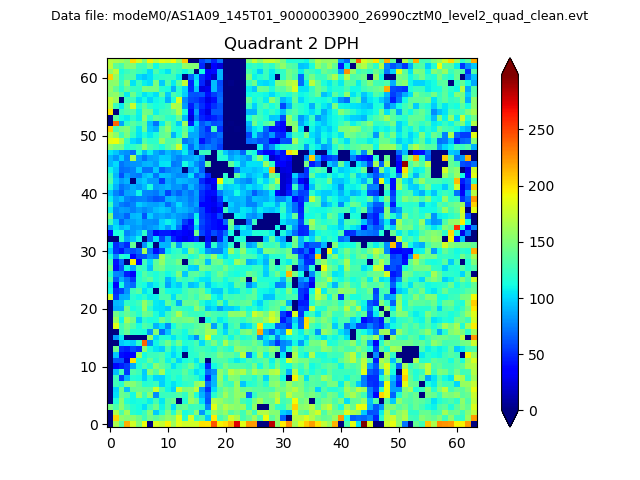
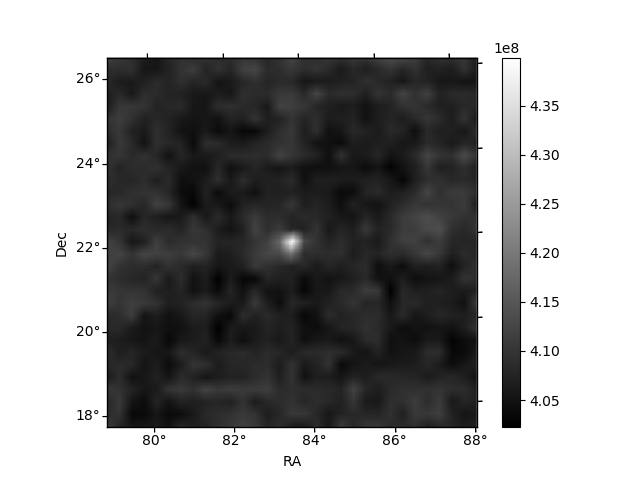
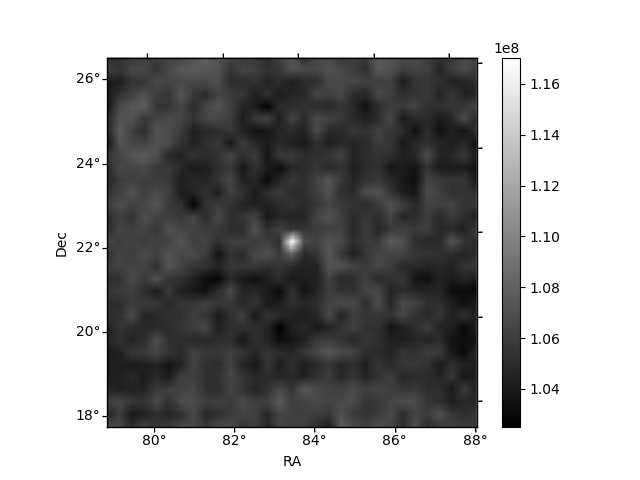
Histogram calculated using DETX and DETY for each event in the final _common_clean file
| Quadrant A | 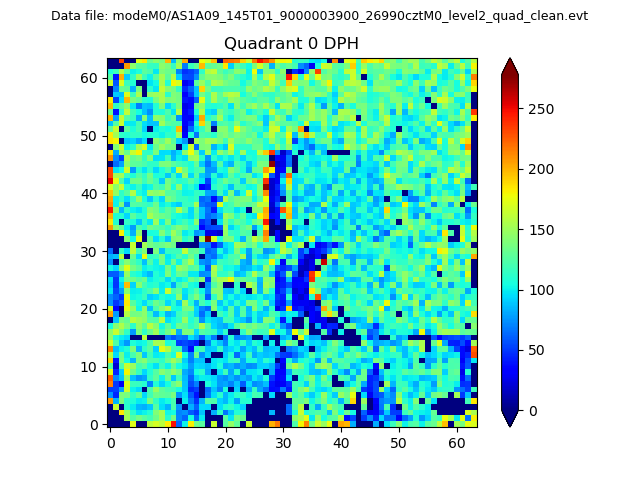 |
 |
Quadrant B |
|---|---|---|---|
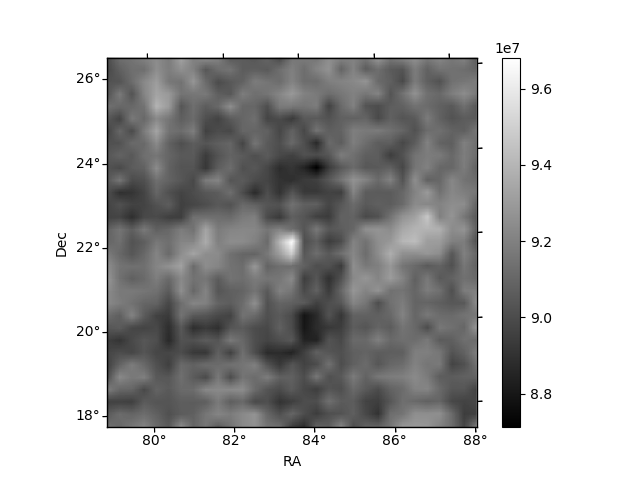
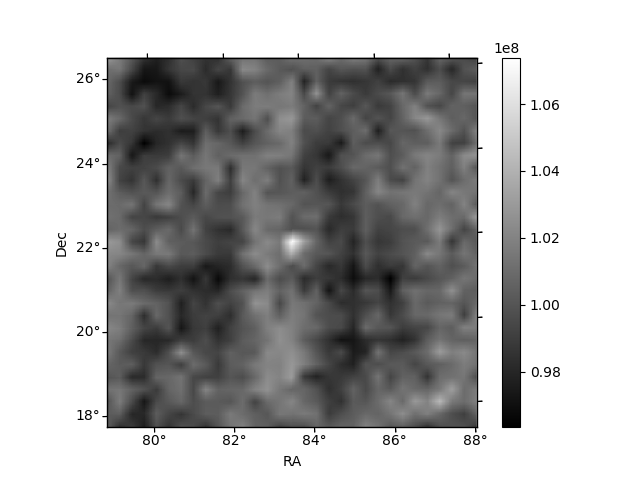
| Quadrant D | 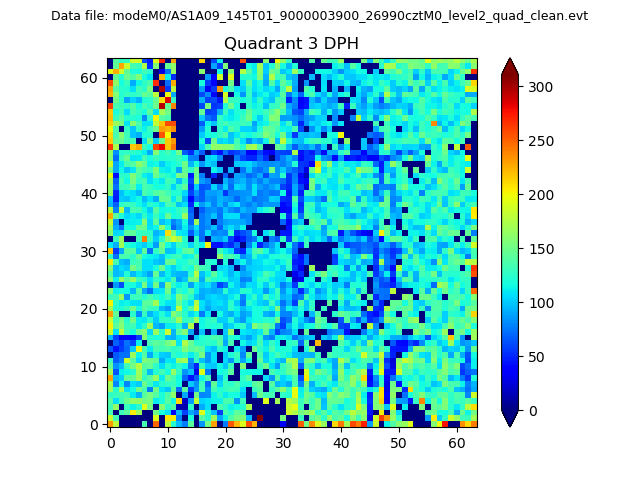 |
 |
Quadrant C |
| Plot type | Count rate plots | Images |
|---|---|---|
| Comparison with Poisson distribution Blue bars denote a histogram of data divided into 1 sec bins. Red curve is a Poisson curve with rate = median count rate of data. |
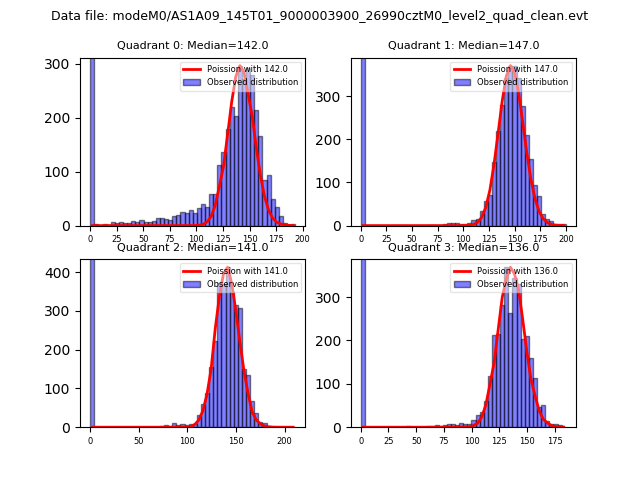 |
 |
| Quadrant-wise count rates Data is divided into 100 sec bins |
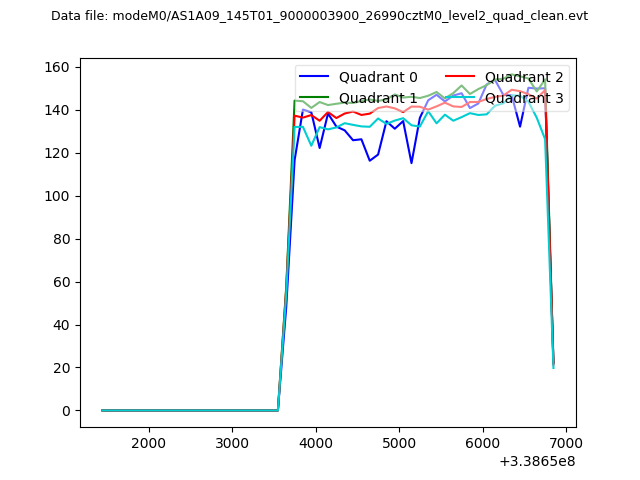 |
|
| Module-wise count rates for Quadrant A Data is divided into 100 sec bins |
 |
 |
| Module-wise count rates for Quadrant B Data is divided into 100 sec bins |
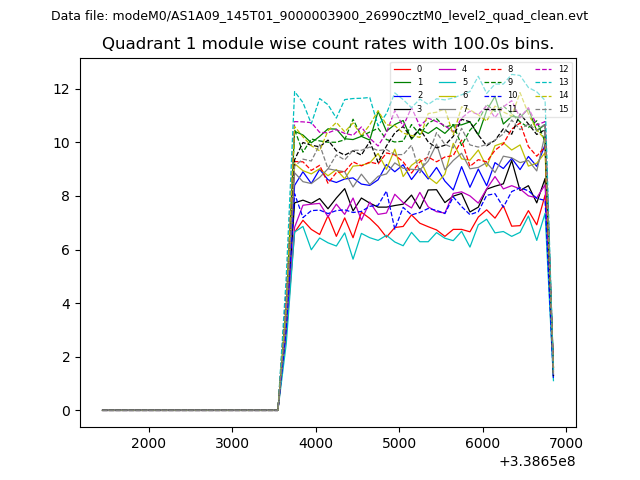 |
 |
| Module-wise count rates for Quadrant C Data is divided into 100 sec bins |
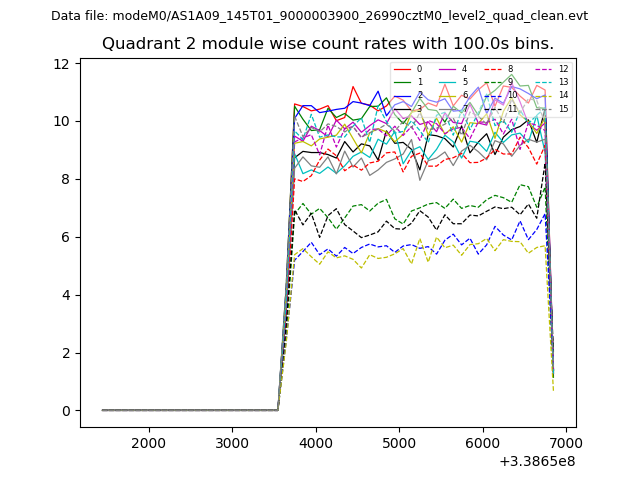 |
 |
| Module-wise count rates for Quadrant D Data is divided into 100 sec bins |
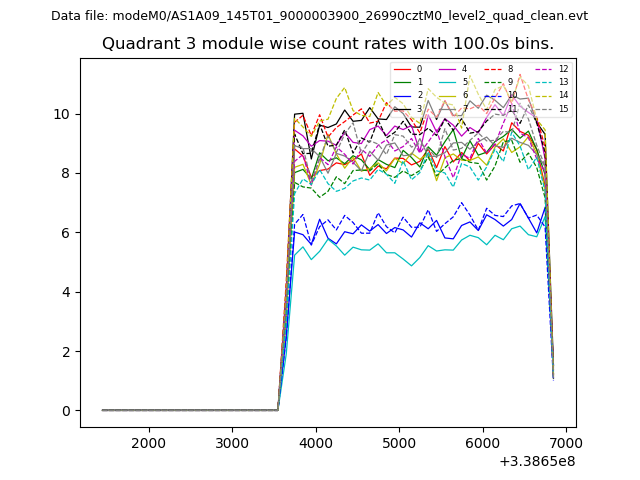 |
 |
| Parameter | Plot |
|---|---|
| CZT HV Monitor | 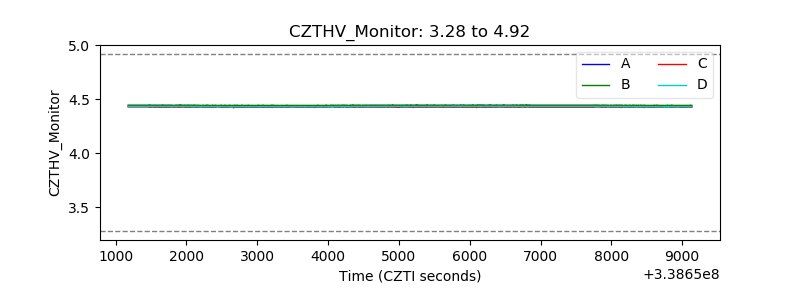 |
| D_VDD | 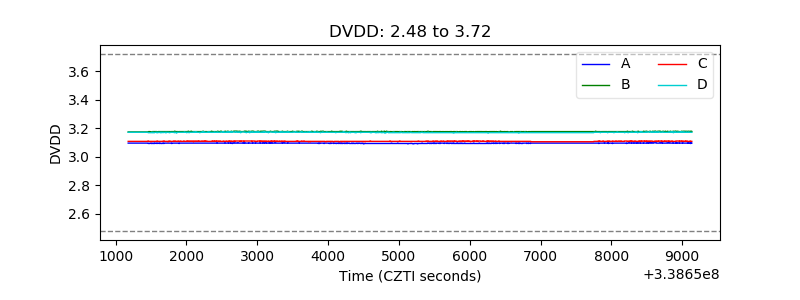 |
| Temperature 1 | 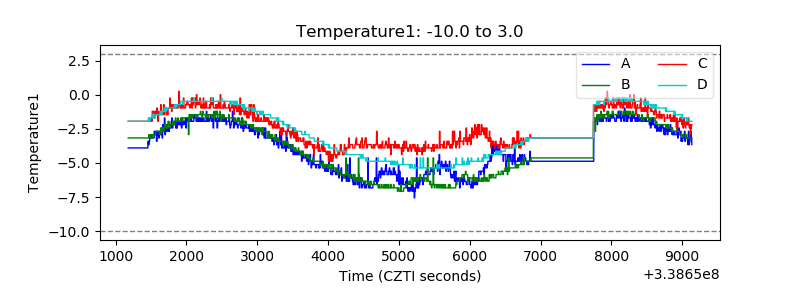 |
| Veto HV Monitor | 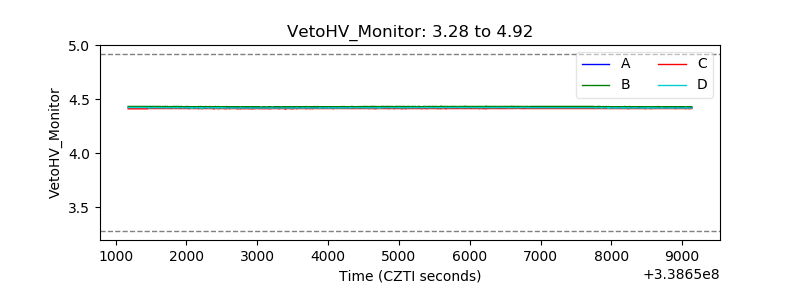 |
| Veto LLD | 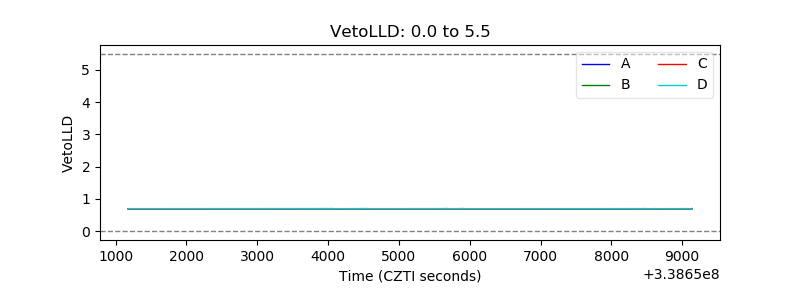 |
| Alpha Counter | 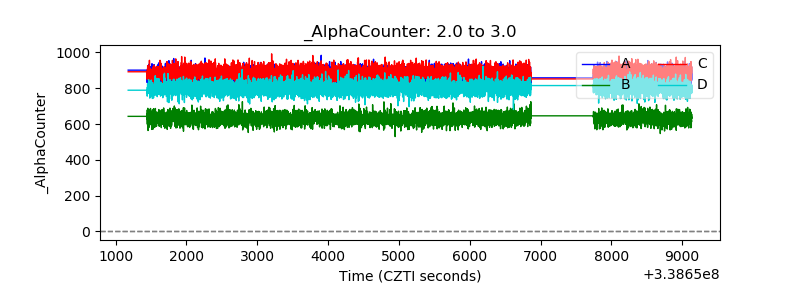 |
| _CPM_Rate | 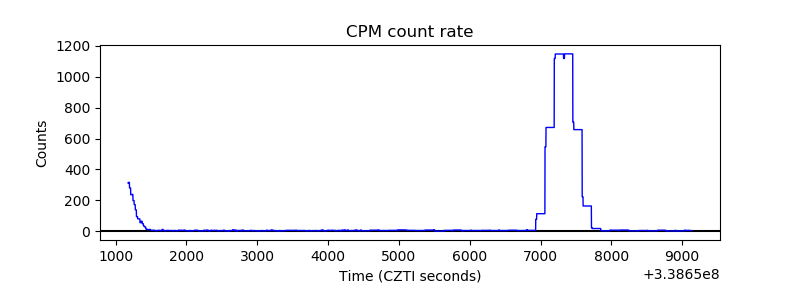 |
| CZT Counter | 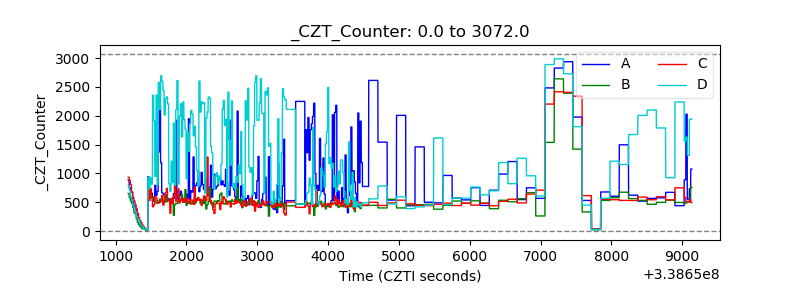 |
| +2.5 Volts monitor |  |
| +5 Volts monitor |  |
| _ROLL_ROT | 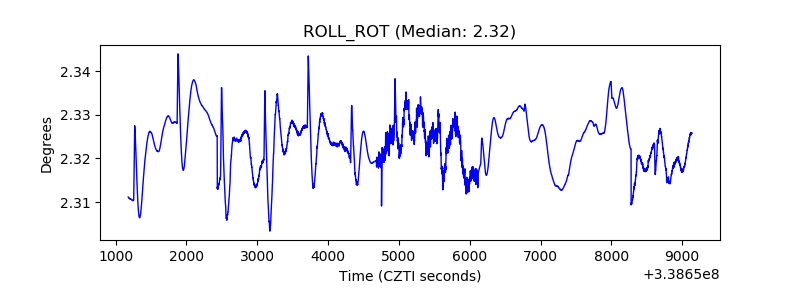 |
| _Roll_DEC | 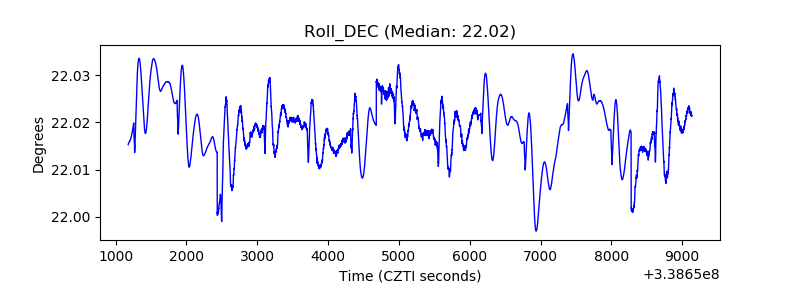 |
| _Roll_RA | 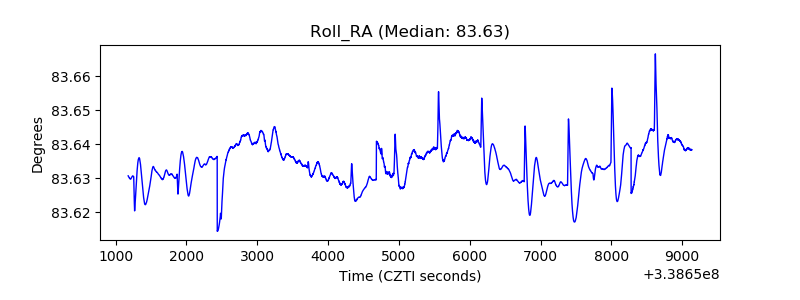 |
| Veto Counter | 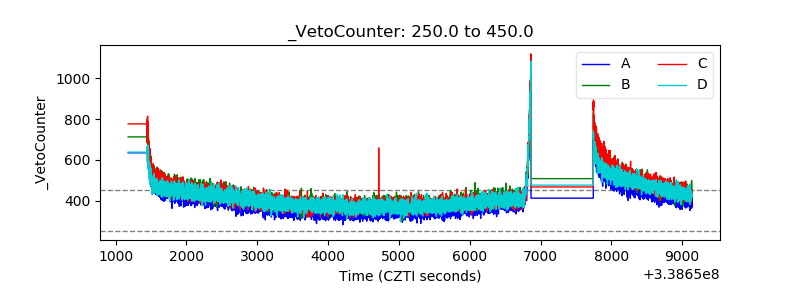 |