| Param | Original file | Final file |
|---|---|---|
| Filename | modeM0/AS1A09_145T01_9000003900_26991cztM0_level2.evt | modeM0/AS1A09_145T01_9000003900_26991cztM0_level2_quad_clean.evt |
| Size (bytes) | 635,529,600 | 80,784,000 |
| Size | 606.1 MB | 77.0 MB |
| Events in quadrant A | 4,822,519 | 507,992 |
| Events in quadrant B | 3,158,531 | 521,204 |
| Events in quadrant C | 3,254,993 | 503,252 |
| Events in quadrant D | 7,594,404 | 483,289 |
| Mode M0 | |||
|---|---|---|---|
| Quadrant | BADHDUFLAG | Total packets | Discarded packets |
| A | 0 | 18476 | 0 |
| B | 0 | 13087 | 0 |
| C | 0 | 13406 | 0 |
| D | 0 | 26842 | 0 |
| Mode M9 | |||
|---|---|---|---|
| Quadrant | BADHDUFLAG | Total packets | Discarded packets |
| A | 0 | 10 | 0 |
| B | 0 | 10 | 0 |
| C | 0 | 10 | 0 |
| D | 0 | 10 | 0 |
| Quadrant | Total seconds | Saturated seconds | Saturation percentage |
|---|---|---|---|
| A | 6163 | 439 | 7.123154% |
| B | 6163 | 42 | 0.681486% |
| C | 6163 | 107 | 1.736167% |
| D | 6163 | 898 | 14.570826% |
Noise dominated data is calculated using 1-second bins in cleaned event files. If a bin has >2000 counts, and if more than 50% of those come from <1% of pixels, then it is considered to be noise-dominated and hence unusable.
| Quadrant | # 1 sec bins | Bins with >0 counts | Bins with >2000 counts | High rate bins dominated by noise | Noise dominated (total time) | Noise dominated (detector-on time) | Marked lightcurve |
|---|---|---|---|---|---|---|---|
| A | 7218 | 6163 | 301 | 301 | 4.17% | 4.88% | 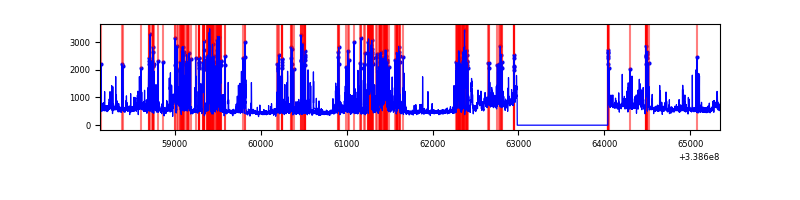 |
| B | 7218 | 6163 | 0 | 0 | 0.00% | 0.00% | 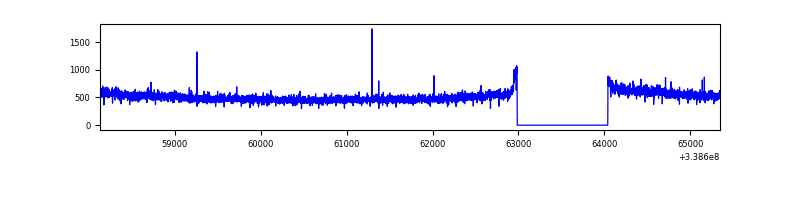 |
| C | 7218 | 6163 | 14 | 14 | 0.19% | 0.23% | 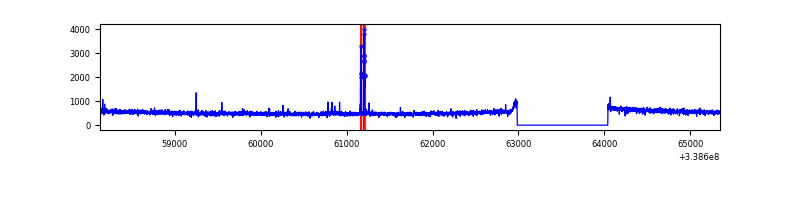 |
| D | 7218 | 6163 | 742 | 742 | 10.28% | 12.04% |  |
Top three noisy pixels from each quadrant. If the there are fewer than three noisy pixels in the level2.evt file, extra rows are filled as -1
| Pixel properties | Quadrant properties | ||||||
|---|---|---|---|---|---|---|---|
| Quadrant | DetID | PixID | Counts | Sigma | Mean | Median | Sigma |
| A | 14 | 235 | 1270877 | 7919.48 | 794 | 779 | 160.4 |
| A | 6 | 16 | 448088 | 2789.12 | 794 | 779 | 160.4 |
| A | 8 | 192 | 17591 | 104.83 | 794 | 779 | 160.4 |
| B | 12 | 111 | 17984 | 111.28 | 807 | 790 | 154.5 |
| B | 11 | 111 | 16011 | 98.51 | 807 | 790 | 154.5 |
| B | 14 | 111 | 14091 | 86.08 | 807 | 790 | 154.5 |
| C | 14 | 238 | 126301 | 679.89 | 785 | 794 | 184.6 |
| C | 15 | 208 | 54624 | 291.61 | 785 | 794 | 184.6 |
| C | 2 | 16 | 14376 | 73.58 | 785 | 794 | 184.6 |
| D | 1 | 52 | 3759068 | 18663.18 | 753 | 741 | 201.4 |
| D | 5 | 222 | 769246 | 3816.26 | 753 | 741 | 201.4 |
| D | 2 | 250 | 115868 | 571.7 | 753 | 741 | 201.4 |
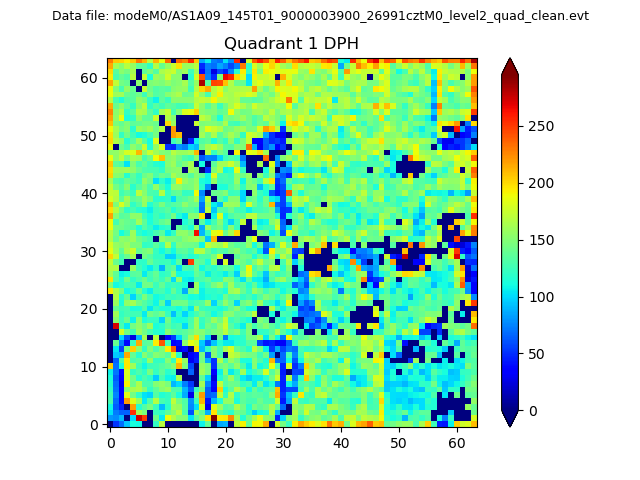
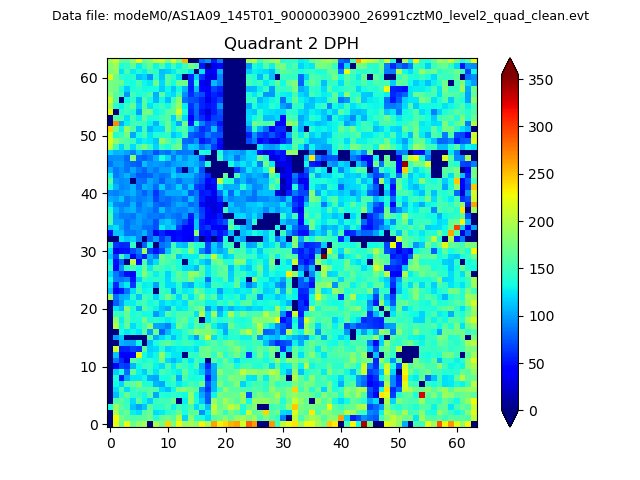
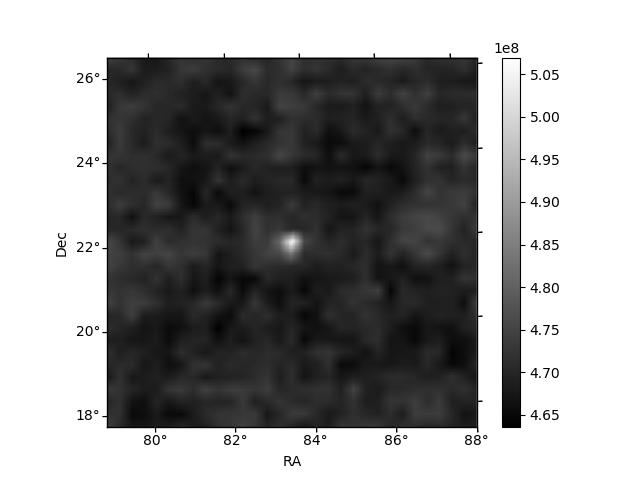
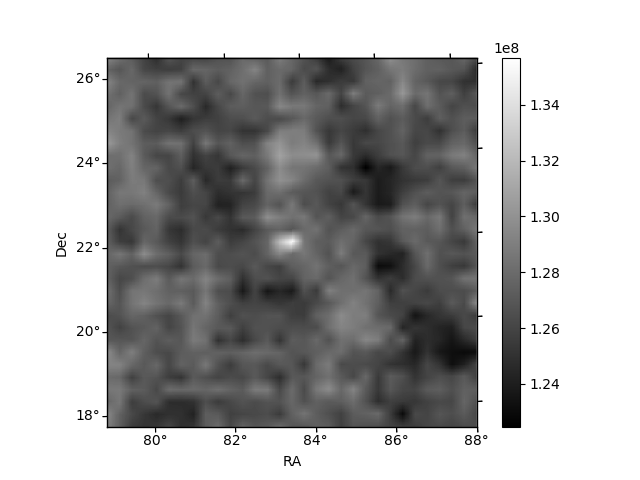
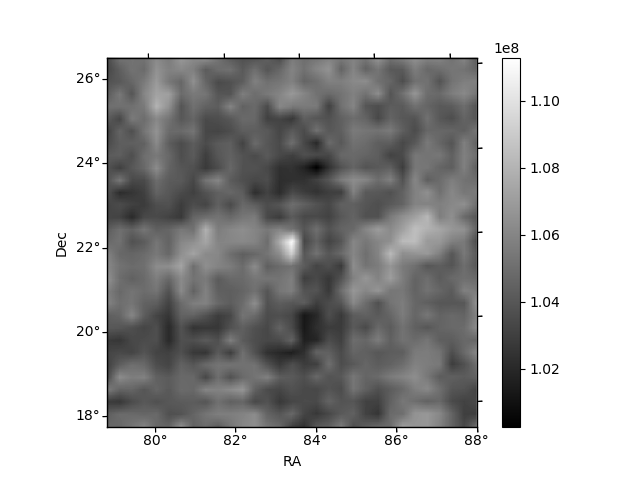
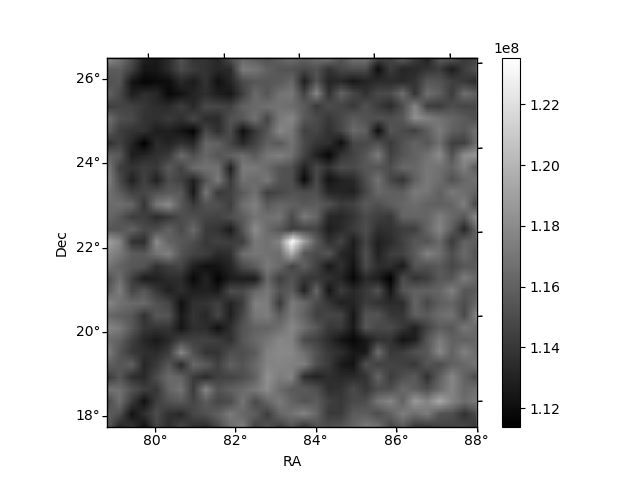
Histogram calculated using DETX and DETY for each event in the final _common_clean file
| Quadrant A | 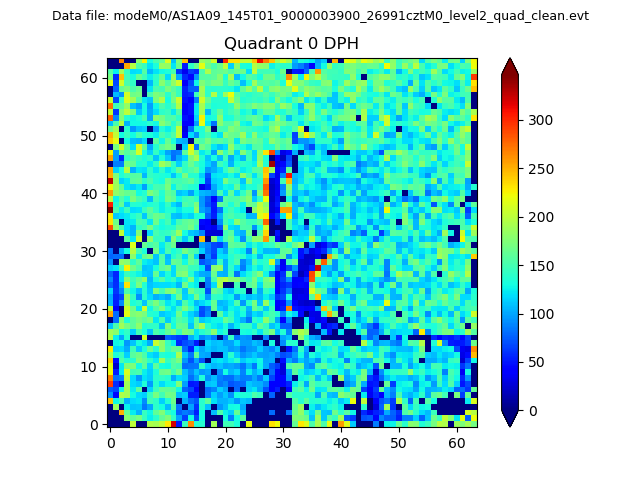 |
 |
Quadrant B |
|---|---|---|---|
| Quadrant D | 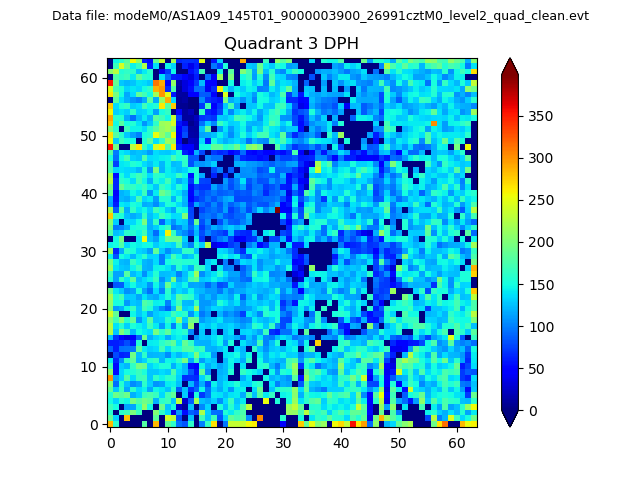 |
 |
Quadrant C |
| Plot type | Count rate plots | Images |
|---|---|---|
| Comparison with Poisson distribution Blue bars denote a histogram of data divided into 1 sec bins. Red curve is a Poisson curve with rate = median count rate of data. |
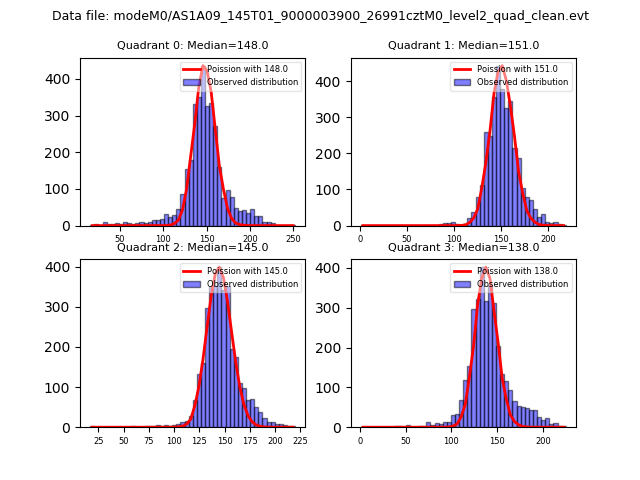 |
 |
| Quadrant-wise count rates Data is divided into 100 sec bins |
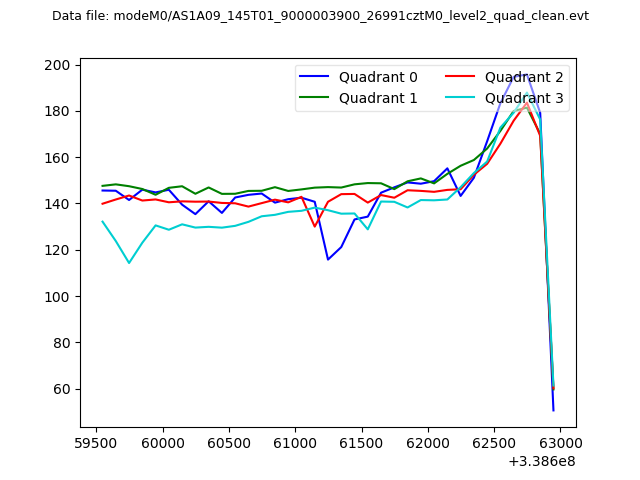 |
|
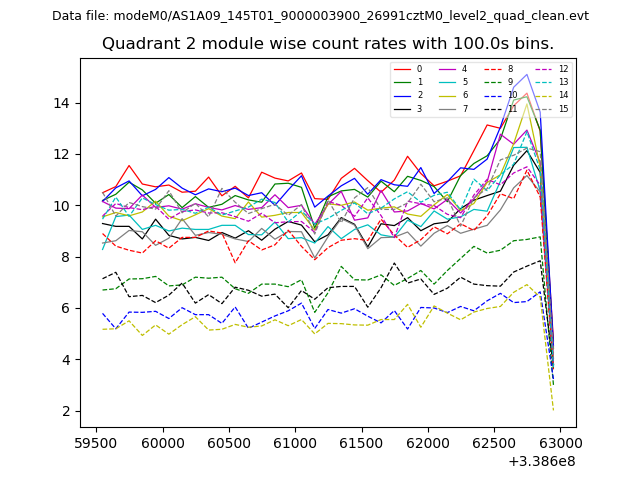
| Module-wise count rates for Quadrant A Data is divided into 100 sec bins |
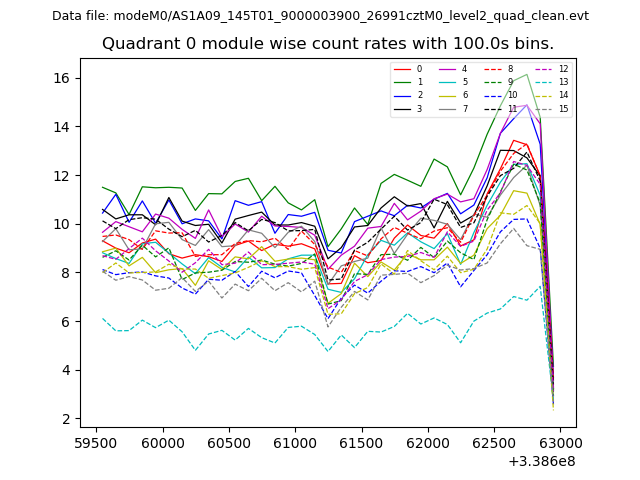 |
 |
| Module-wise count rates for Quadrant B Data is divided into 100 sec bins |
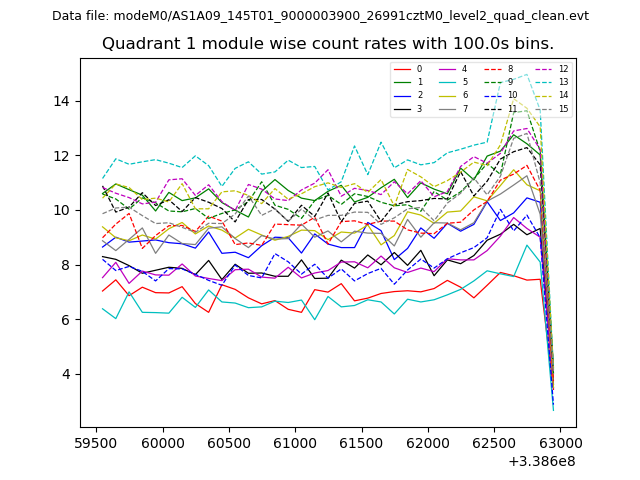 |
 |
| Module-wise count rates for Quadrant C Data is divided into 100 sec bins |
 |
 |
| Module-wise count rates for Quadrant D Data is divided into 100 sec bins |
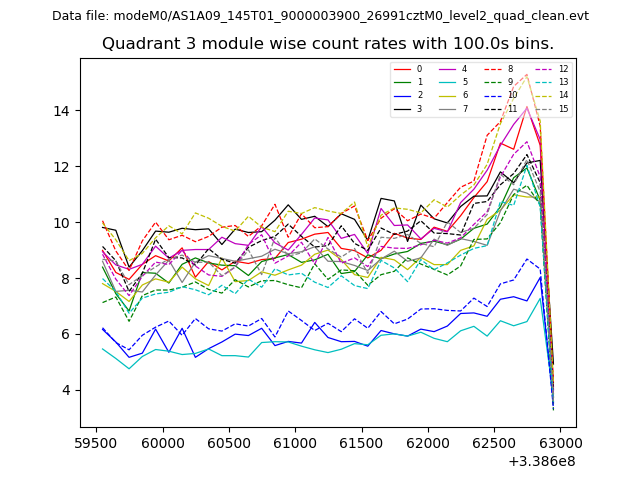 |
 |
| Parameter | Plot |
|---|---|
| CZT HV Monitor | 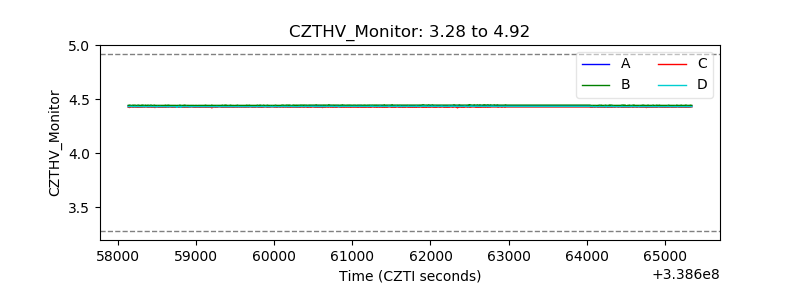 |
| D_VDD |  |
| Temperature 1 | 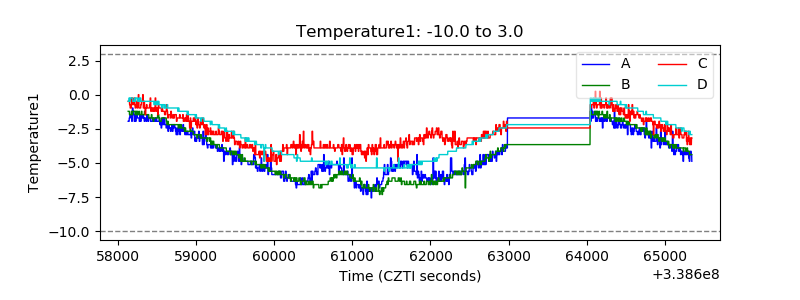 |
| Veto HV Monitor | 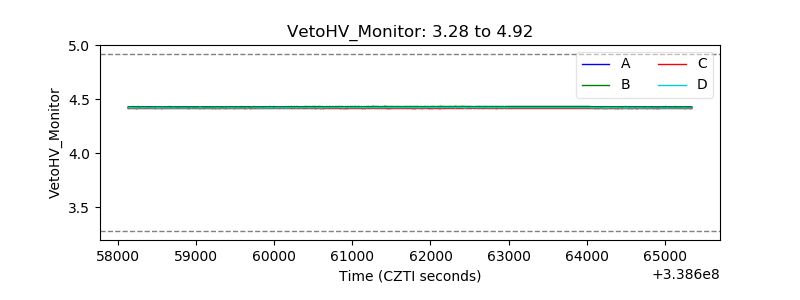 |
| Veto LLD | 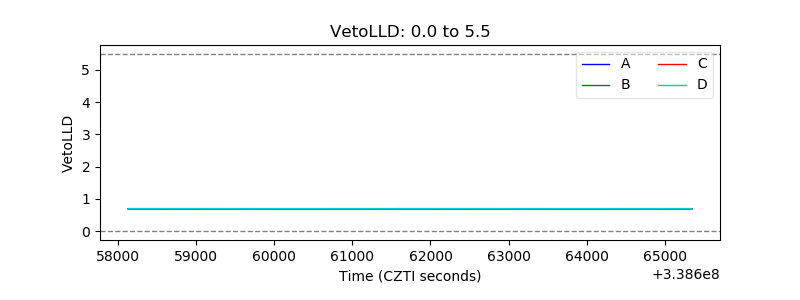 |
| Alpha Counter | 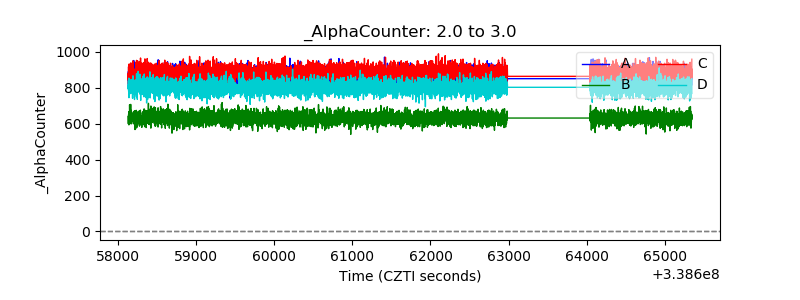 |
| _CPM_Rate | 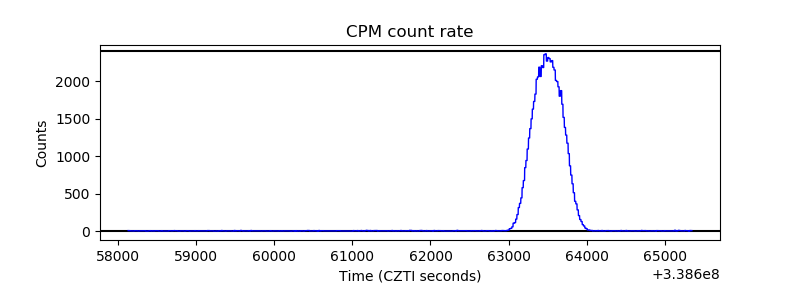 |
| CZT Counter | 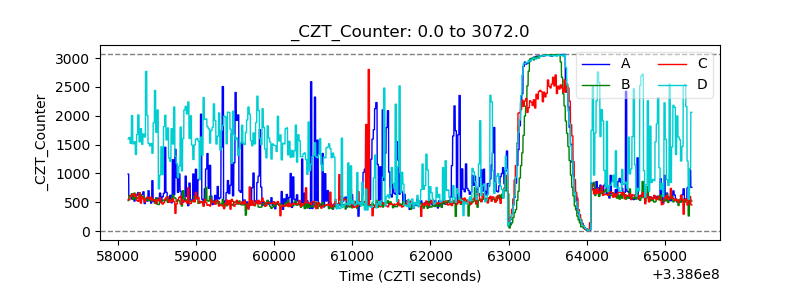 |
| +2.5 Volts monitor |  |
| +5 Volts monitor |  |
| _ROLL_ROT | 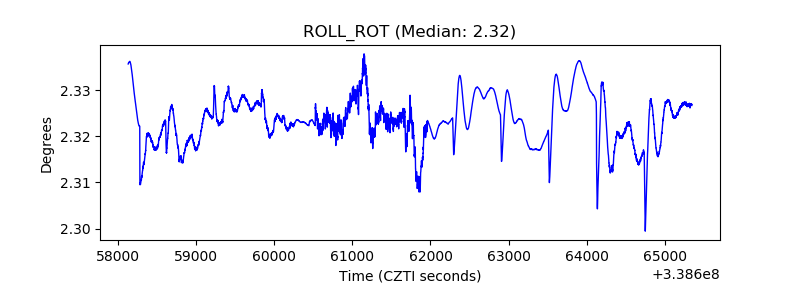 |
| _Roll_DEC | 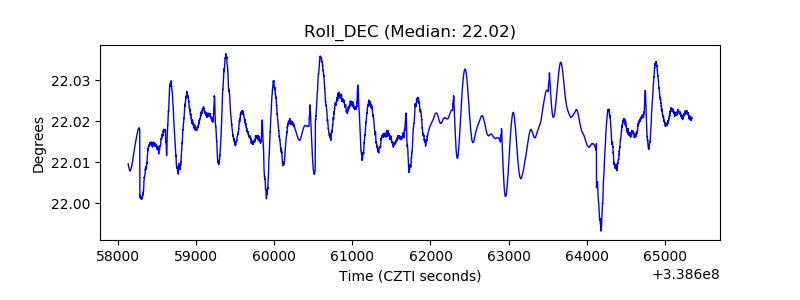 |
| _Roll_RA | 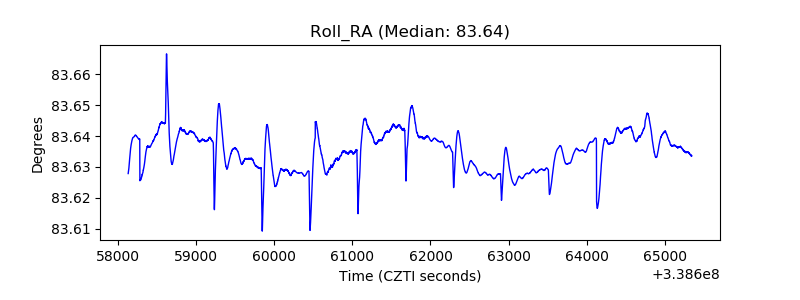 |
| Veto Counter | 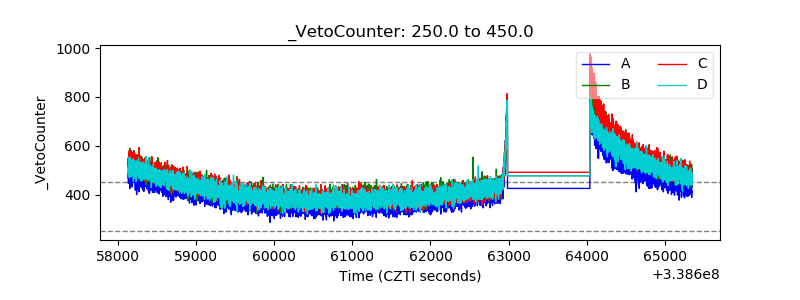 |