| Param | Original file | Final file |
|---|---|---|
| Filename | modeM0/AS1A09_145T01_9000003900_26993cztM0_level2.evt | modeM0/AS1A09_145T01_9000003900_26993cztM0_level2_quad_clean.evt |
| Size (bytes) | 659,266,560 | 92,246,400 |
| Size | 628.7 MB | 88.0 MB |
| Events in quadrant A | 6,054,885 | 567,092 |
| Events in quadrant B | 3,453,427 | 620,656 |
| Events in quadrant C | 3,507,042 | 598,738 |
| Events in quadrant D | 6,517,118 | 559,277 |
| Mode M0 | |||
|---|---|---|---|
| Quadrant | BADHDUFLAG | Total packets | Discarded packets |
| A | 0 | 22388 | 0 |
| B | 0 | 14318 | 0 |
| C | 0 | 14511 | 0 |
| D | 0 | 23812 | 0 |
| Mode M9 | |||
|---|---|---|---|
| Quadrant | BADHDUFLAG | Total packets | Discarded packets |
| A | 0 | 20 | 0 |
| B | 0 | 21 | 0 |
| C | 0 | 21 | 0 |
| D | 0 | 21 | 0 |
| Quadrant | Total seconds | Saturated seconds | Saturation percentage |
|---|---|---|---|
| A | 6416 | 783 | 12.203865% |
| B | 6416 | 65 | 1.013092% |
| C | 6416 | 118 | 1.839152% |
| D | 6416 | 805 | 12.546758% |
Noise dominated data is calculated using 1-second bins in cleaned event files. If a bin has >2000 counts, and if more than 50% of those come from <1% of pixels, then it is considered to be noise-dominated and hence unusable.
| Quadrant | # 1 sec bins | Bins with >0 counts | Bins with >2000 counts | High rate bins dominated by noise | Noise dominated (total time) | Noise dominated (detector-on time) | Marked lightcurve |
|---|---|---|---|---|---|---|---|
| A | 7576 | 6416 | 541 | 541 | 7.14% | 8.43% | 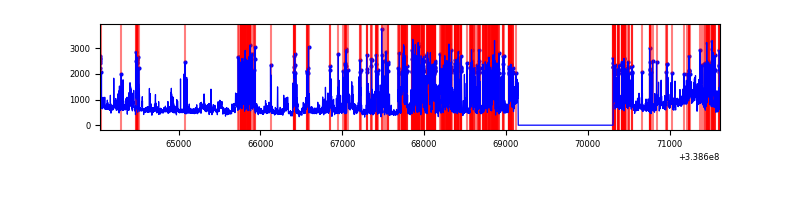 |
| B | 7576 | 6416 | 1 | 1 | 0.01% | 0.02% | 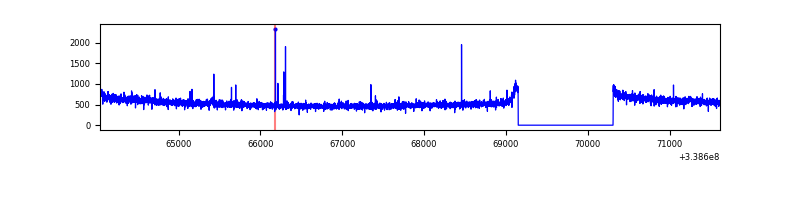 |
| C | 7576 | 6416 | 0 | 0 | 0.00% | 0.00% | 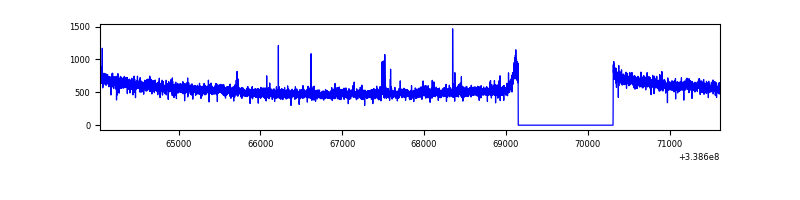 |
| D | 7576 | 6416 | 692 | 692 | 9.13% | 10.79% | 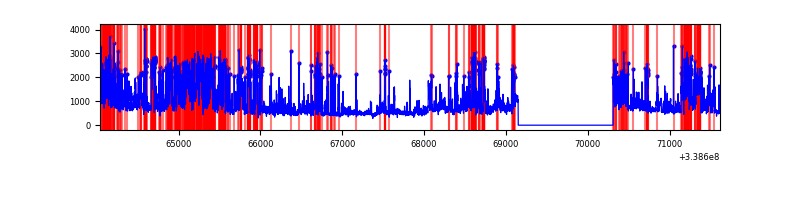 |
Top three noisy pixels from each quadrant. If the there are fewer than three noisy pixels in the level2.evt file, extra rows are filled as -1
| Pixel properties | Quadrant properties | ||||||
|---|---|---|---|---|---|---|---|
| Quadrant | DetID | PixID | Counts | Sigma | Mean | Median | Sigma |
| A | 14 | 235 | 2193040 | 13107.0 | 837 | 823 | 167.3 |
| A | 6 | 16 | 547763 | 3270.09 | 837 | 823 | 167.3 |
| A | 13 | 170 | 40301 | 236.03 | 837 | 823 | 167.3 |
| B | 12 | 111 | 19299 | 111.61 | 878 | 859 | 165.2 |
| B | 11 | 111 | 17094 | 98.26 | 878 | 859 | 165.2 |
| B | 14 | 111 | 15381 | 87.9 | 878 | 859 | 165.2 |
| C | 14 | 238 | 139435 | 691.43 | 859 | 868 | 200.4 |
| C | 15 | 208 | 19607 | 93.51 | 859 | 868 | 200.4 |
| C | 13 | 61 | 5735 | 24.29 | 859 | 868 | 200.4 |
| D | 1 | 52 | 2544811 | 12172.35 | 819 | 804 | 209.0 |
| D | 5 | 222 | 662285 | 3165.0 | 819 | 804 | 209.0 |
| D | 2 | 250 | 77679 | 367.83 | 819 | 804 | 209.0 |
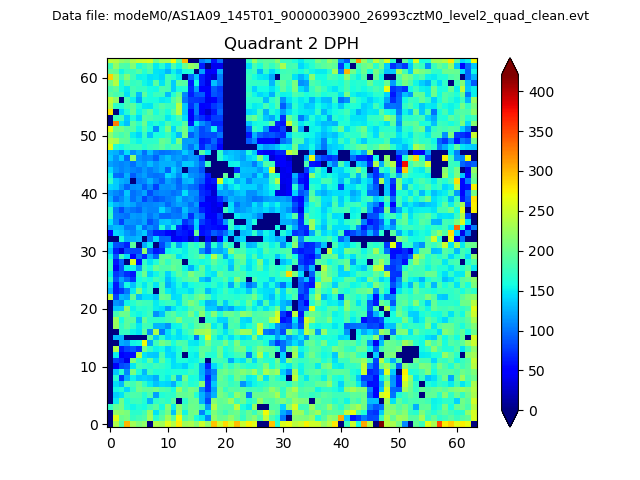
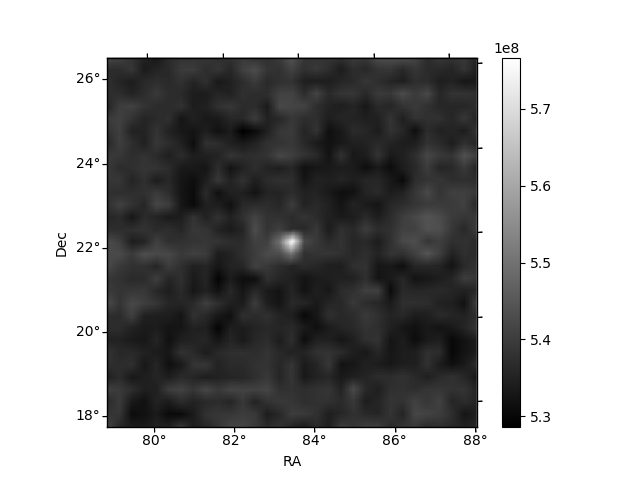
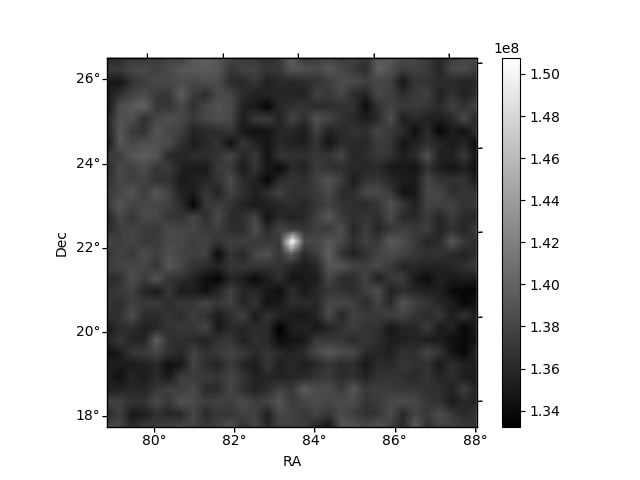
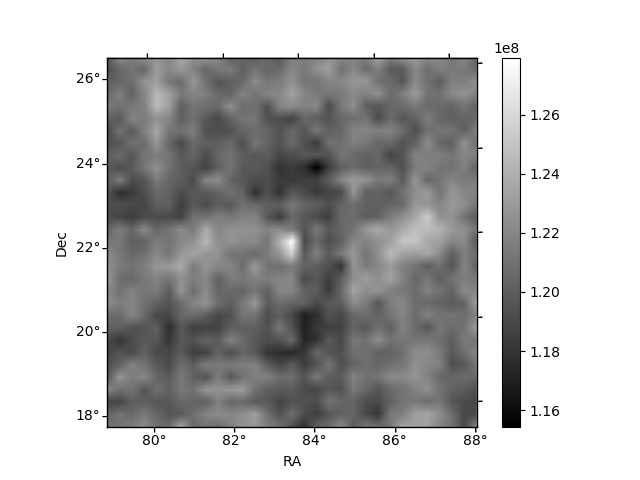
Histogram calculated using DETX and DETY for each event in the final _common_clean file
| Quadrant A | 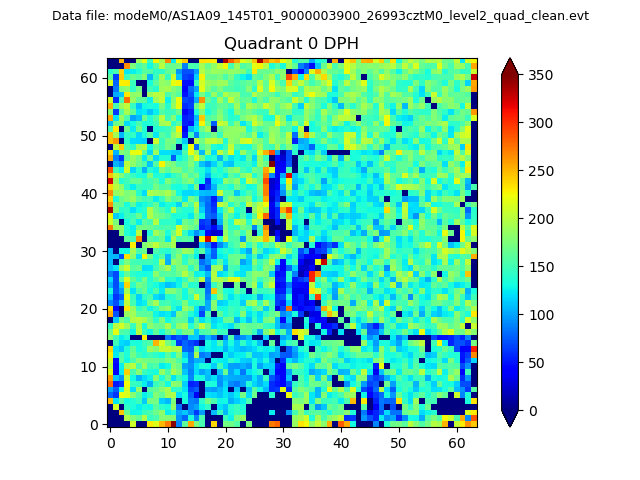 |
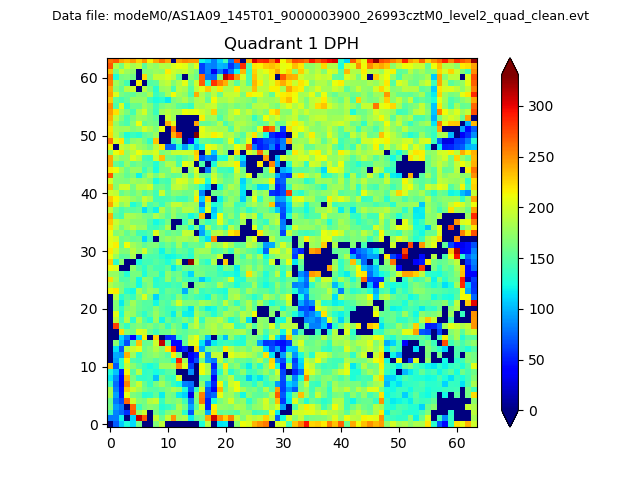 |
Quadrant B |
|---|---|---|---|
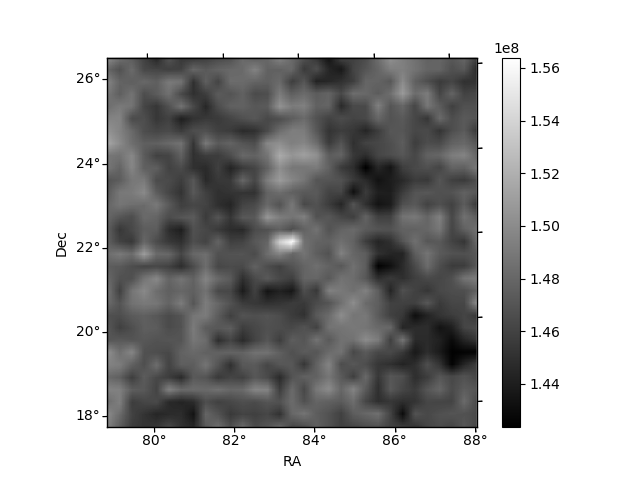
| Quadrant D | 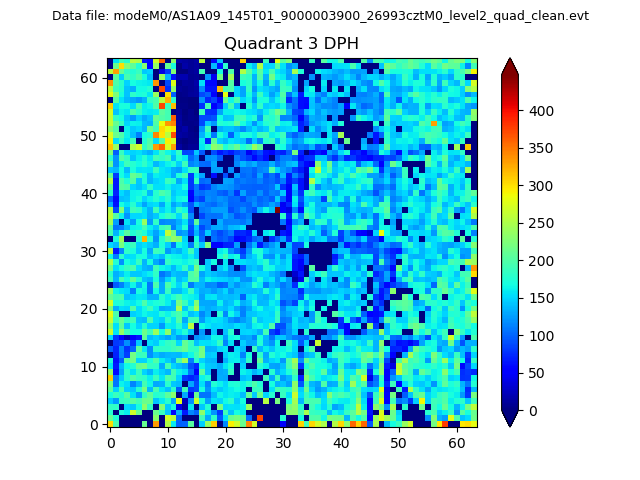 |
 |
Quadrant C |
| Plot type | Count rate plots | Images |
|---|---|---|
| Comparison with Poisson distribution Blue bars denote a histogram of data divided into 1 sec bins. Red curve is a Poisson curve with rate = median count rate of data. |
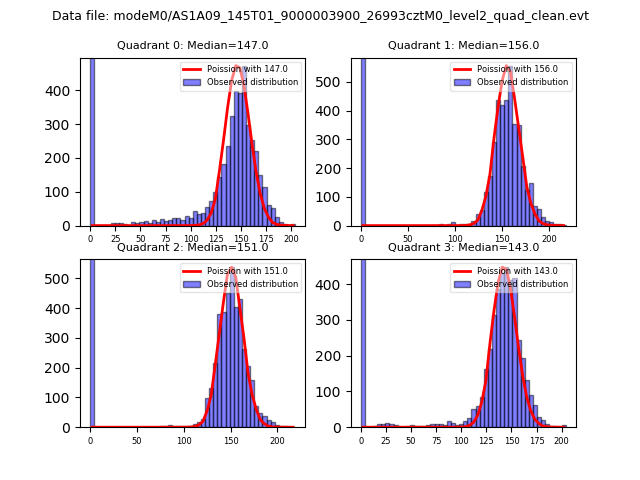 |
 |
| Quadrant-wise count rates Data is divided into 100 sec bins |
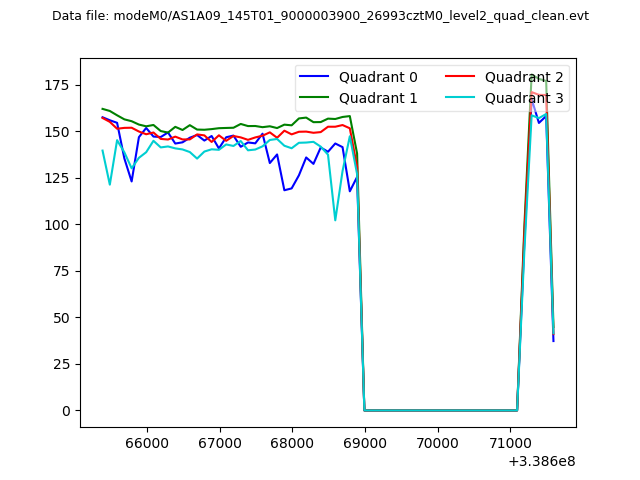 |
|
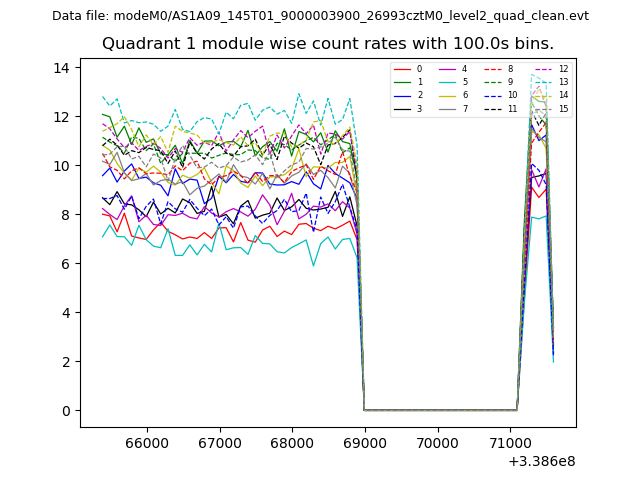
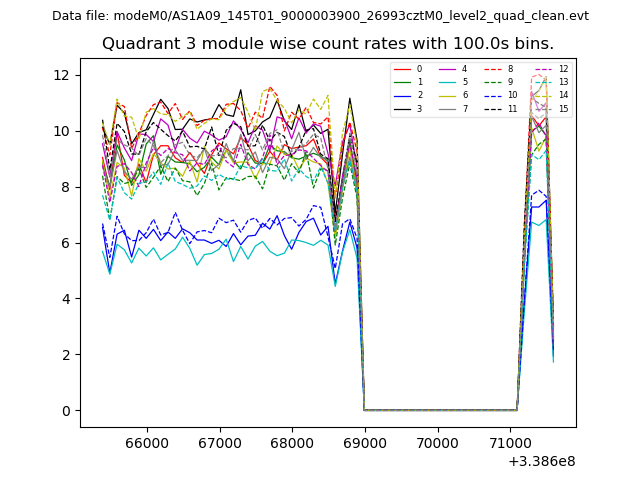
| Module-wise count rates for Quadrant A Data is divided into 100 sec bins |
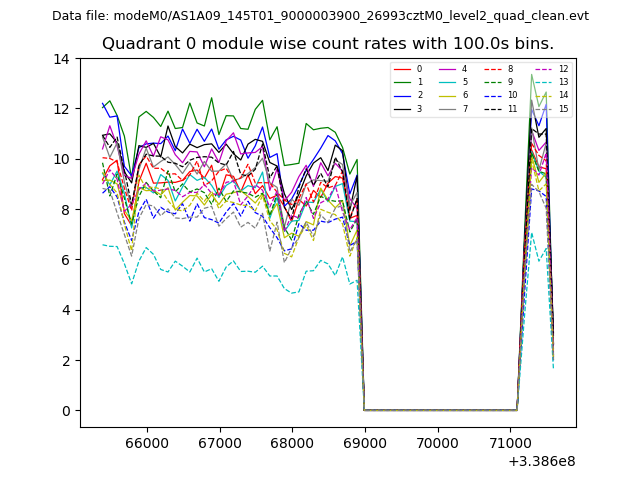 |
 |
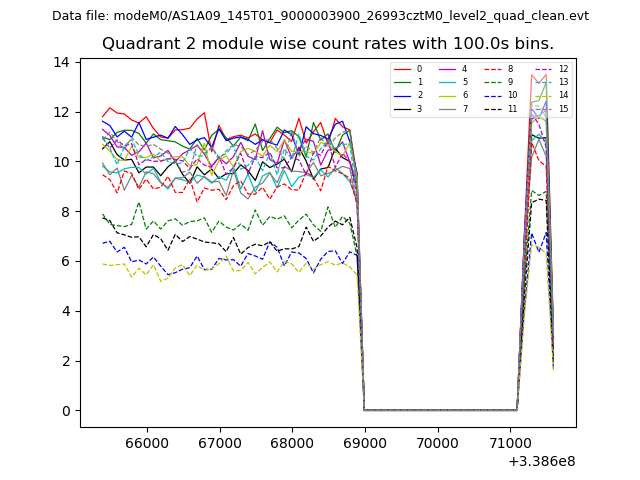
| Module-wise count rates for Quadrant B Data is divided into 100 sec bins |
 |
 |
| Module-wise count rates for Quadrant C Data is divided into 100 sec bins |
 |
 |
| Module-wise count rates for Quadrant D Data is divided into 100 sec bins |
 |
 |
| Parameter | Plot |
|---|---|
| CZT HV Monitor | 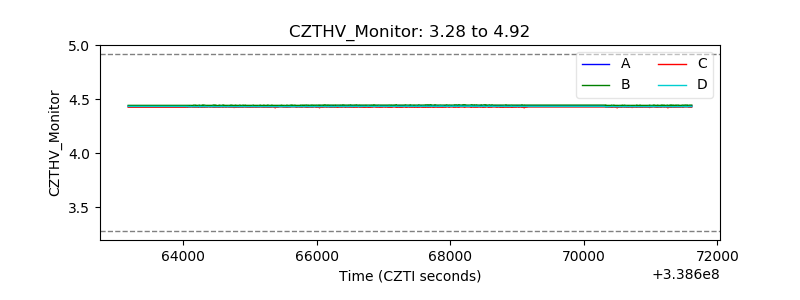 |
| D_VDD | 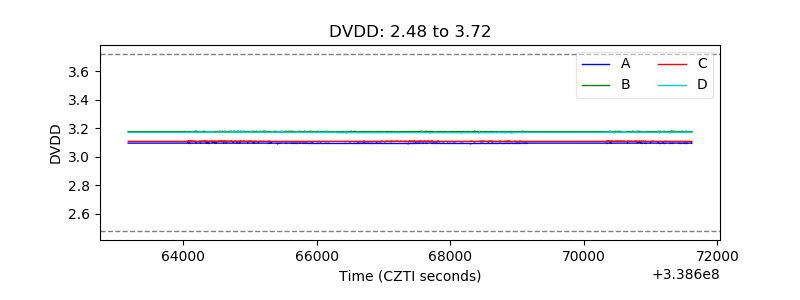 |
| Temperature 1 | 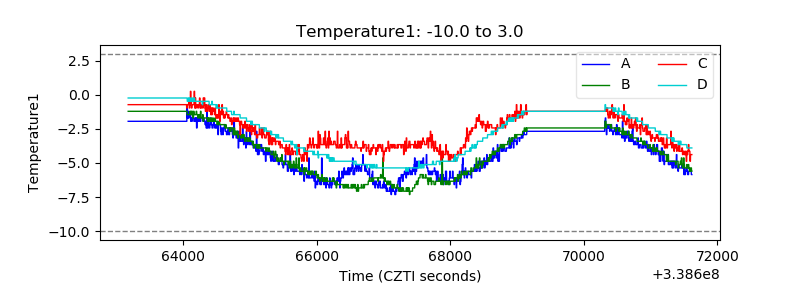 |
| Veto HV Monitor |  |
| Veto LLD | 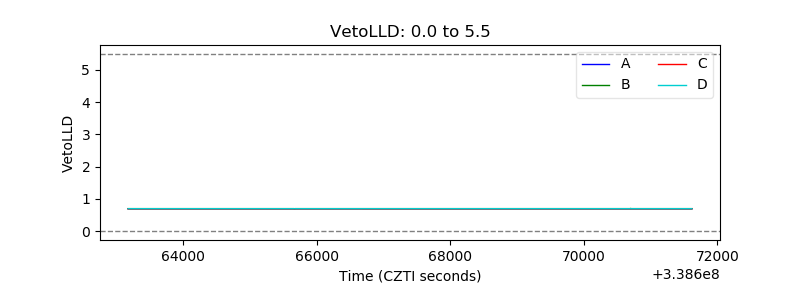 |
| Alpha Counter | 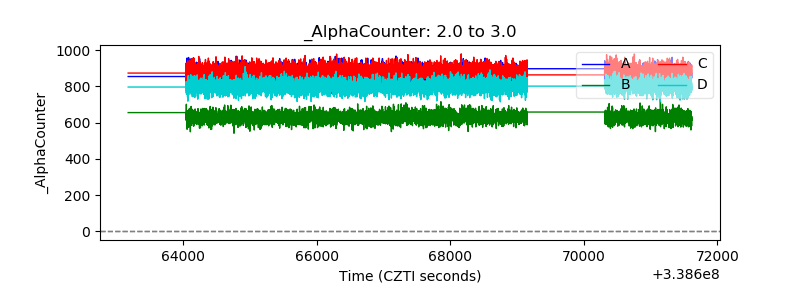 |
| _CPM_Rate | 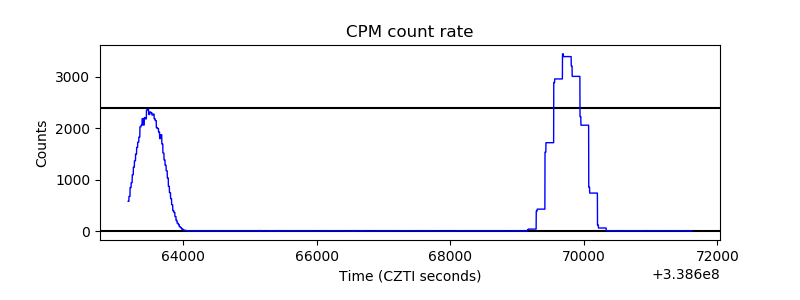 |
| CZT Counter | 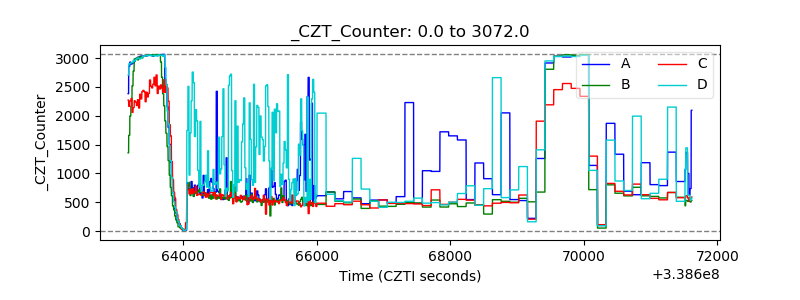 |
| +2.5 Volts monitor |  |
| +5 Volts monitor |  |
| _ROLL_ROT | 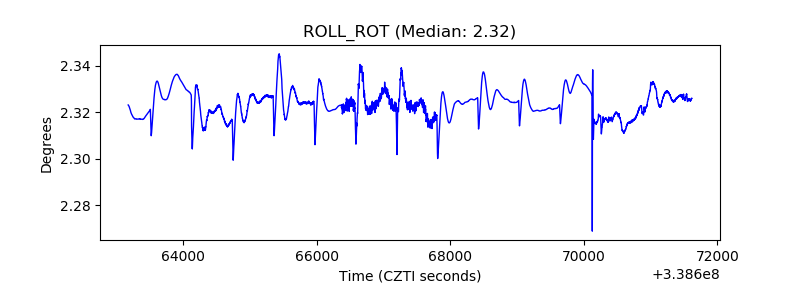 |
| _Roll_DEC | 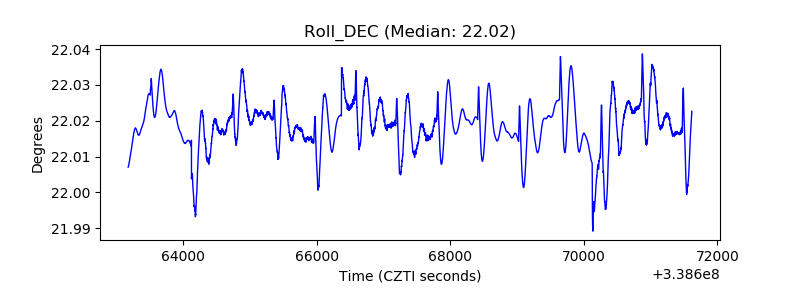 |
| _Roll_RA | 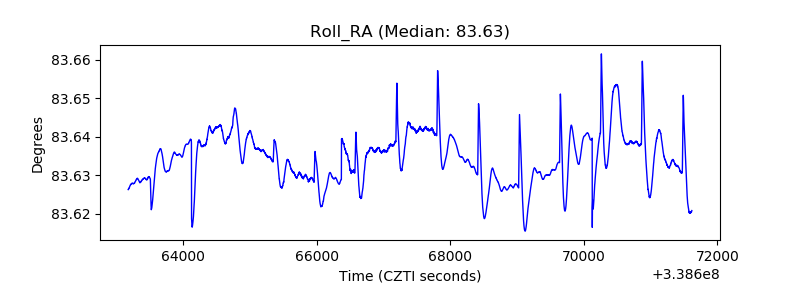 |
| Veto Counter | 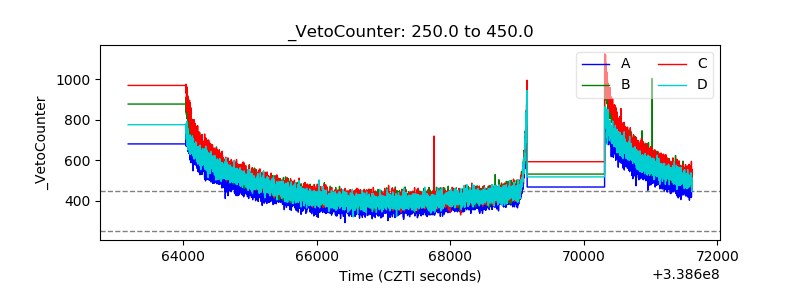 |