| Param | Original file | Final file |
|---|---|---|
| Filename | modeM0/AS1A09_145T01_9000003900_26994cztM0_level2.evt | modeM0/AS1A09_145T01_9000003900_26994cztM0_level2_quad_clean.evt |
| Size (bytes) | 630,086,400 | 104,904,000 |
| Size | 600.9 MB | 100.0 MB |
| Events in quadrant A | 6,174,595 | 660,582 |
| Events in quadrant B | 3,458,588 | 724,985 |
| Events in quadrant C | 3,529,093 | 695,636 |
| Events in quadrant D | 5,495,994 | 657,912 |
| Mode M0 | |||
|---|---|---|---|
| Quadrant | BADHDUFLAG | Total packets | Discarded packets |
| A | 0 | 22724 | 0 |
| B | 0 | 14310 | 0 |
| C | 0 | 14543 | 0 |
| D | 0 | 20533 | 0 |
| Mode M9 | |||
|---|---|---|---|
| Quadrant | BADHDUFLAG | Total packets | Discarded packets |
| A | 0 | 13 | 0 |
| B | 0 | 14 | 0 |
| C | 0 | 14 | 0 |
| D | 0 | 14 | 0 |
| Quadrant | Total seconds | Saturated seconds | Saturation percentage |
|---|---|---|---|
| A | 6269 | 807 | 12.872866% |
| B | 6269 | 56 | 0.893284% |
| C | 6269 | 122 | 1.946084% |
| D | 6268 | 517 | 8.248245% |
Noise dominated data is calculated using 1-second bins in cleaned event files. If a bin has >2000 counts, and if more than 50% of those come from <1% of pixels, then it is considered to be noise-dominated and hence unusable.
| Quadrant | # 1 sec bins | Bins with >0 counts | Bins with >2000 counts | High rate bins dominated by noise | Noise dominated (total time) | Noise dominated (detector-on time) | Marked lightcurve |
|---|---|---|---|---|---|---|---|
| A | 7529 | 6269 | 517 | 517 | 6.87% | 8.25% | 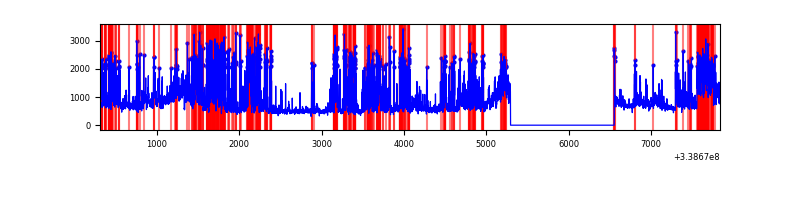 |
| B | 7529 | 6269 | 0 | 0 | 0.00% | 0.00% | 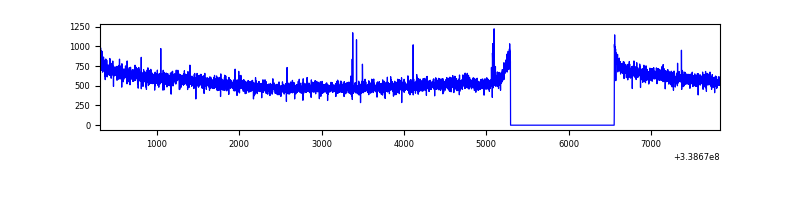 |
| C | 7529 | 6269 | 3 | 3 | 0.04% | 0.05% | 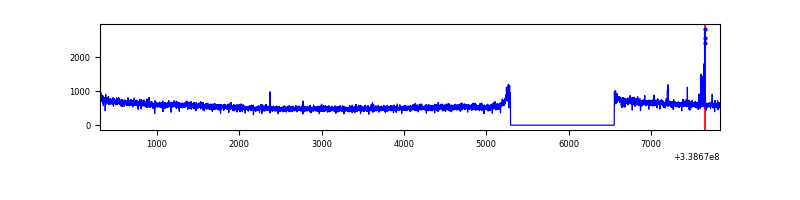 |
| D | 7528 | 6269 | 374 | 374 | 4.97% | 5.97% | 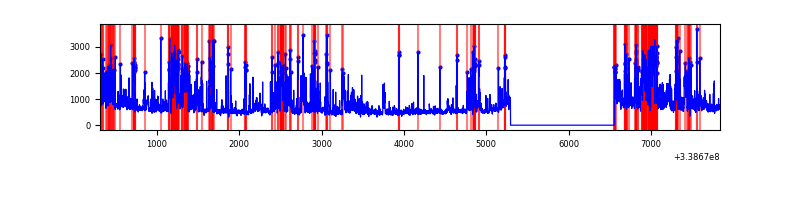 |
Top three noisy pixels from each quadrant. If the there are fewer than three noisy pixels in the level2.evt file, extra rows are filled as -1
| Pixel properties | Quadrant properties | ||||||
|---|---|---|---|---|---|---|---|
| Quadrant | DetID | PixID | Counts | Sigma | Mean | Median | Sigma |
| A | 14 | 235 | 1933633 | 11512.97 | 839 | 825 | 167.9 |
| A | 6 | 16 | 968456 | 5763.79 | 839 | 825 | 167.9 |
| A | 8 | 192 | 29820 | 172.71 | 839 | 825 | 167.9 |
| B | 12 | 111 | 18938 | 108.86 | 883 | 866 | 166.0 |
| B | 11 | 111 | 16773 | 95.82 | 883 | 866 | 166.0 |
| B | 14 | 111 | 15300 | 86.95 | 883 | 866 | 166.0 |
| C | 14 | 238 | 138885 | 685.29 | 860 | 872 | 201.4 |
| C | 15 | 208 | 30261 | 145.93 | 860 | 872 | 201.4 |
| C | 13 | 61 | 5794 | 24.44 | 860 | 872 | 201.4 |
| D | 1 | 52 | 1372508 | 6929.63 | 834 | 818 | 197.9 |
| D | 5 | 222 | 579298 | 2922.42 | 834 | 818 | 197.9 |
| D | 11 | 176 | 220028 | 1107.43 | 834 | 818 | 197.9 |
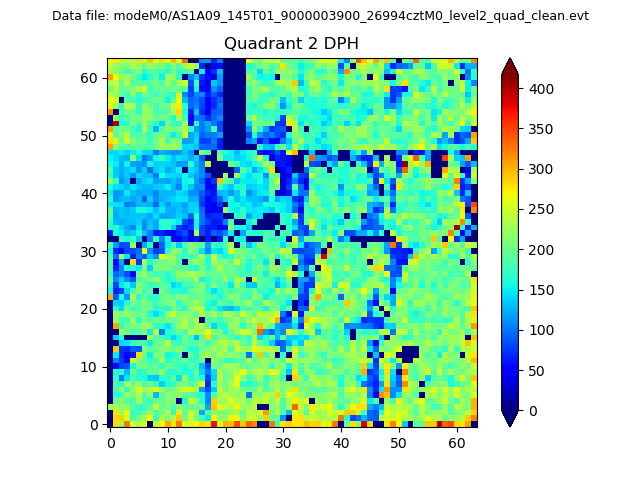
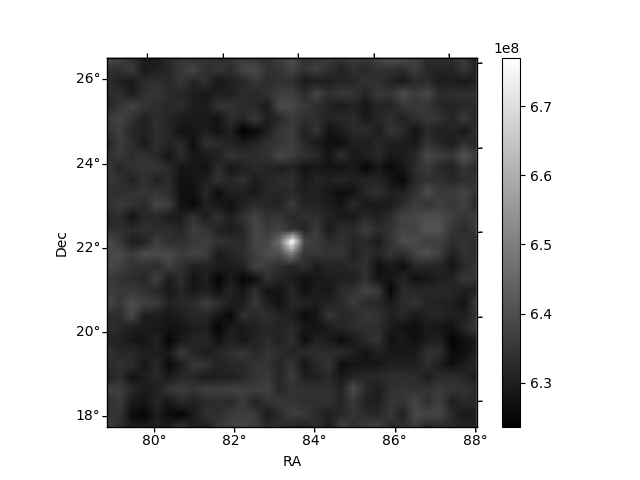
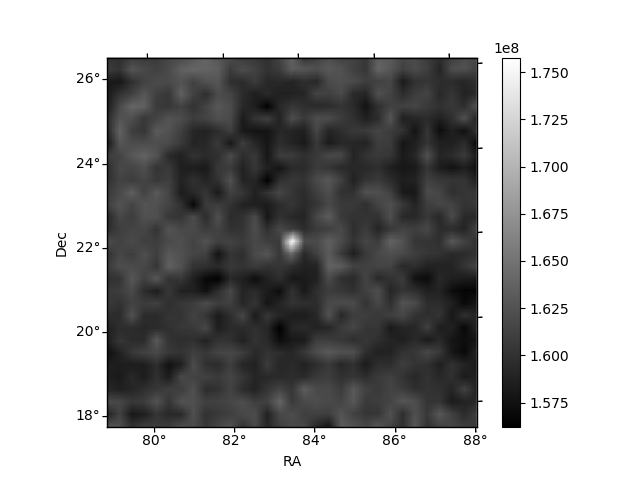
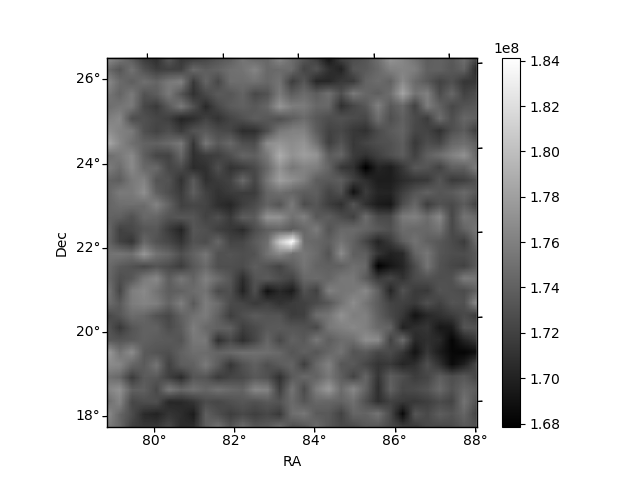
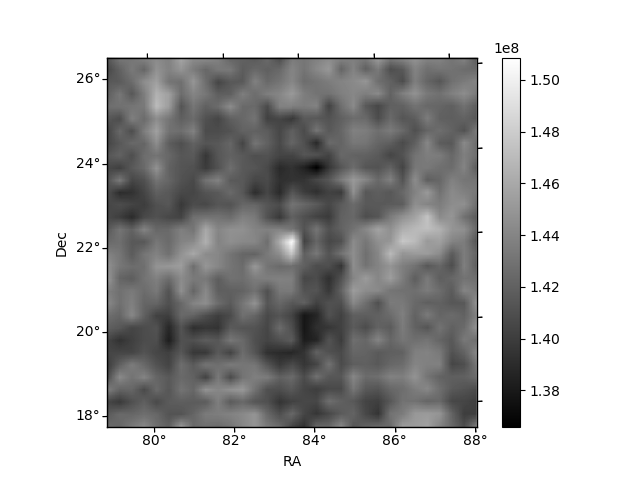
Histogram calculated using DETX and DETY for each event in the final _common_clean file
| Quadrant A | 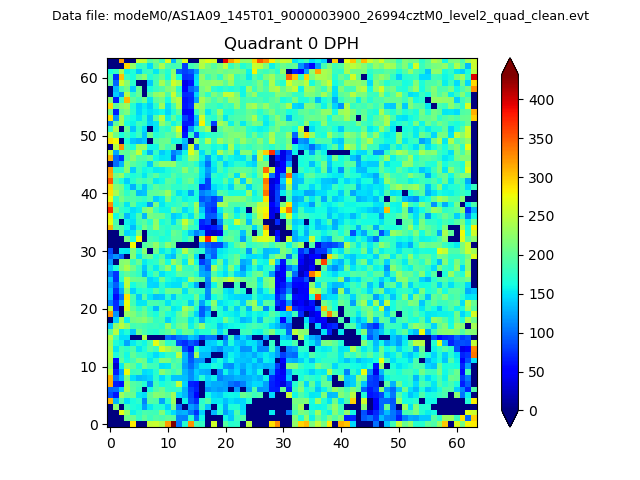 |
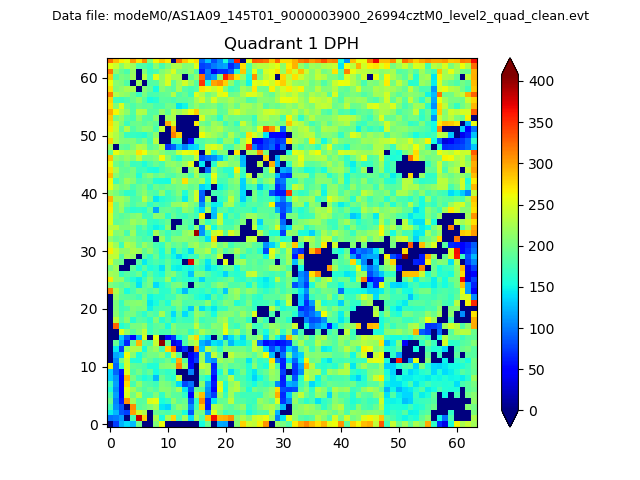 |
Quadrant B |
|---|---|---|---|
| Quadrant D | 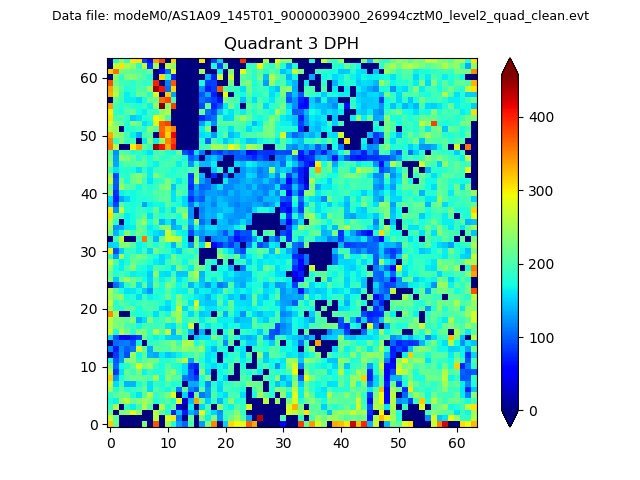 |
 |
Quadrant C |
| Plot type | Count rate plots | Images |
|---|---|---|
| Comparison with Poisson distribution Blue bars denote a histogram of data divided into 1 sec bins. Red curve is a Poisson curve with rate = median count rate of data. |
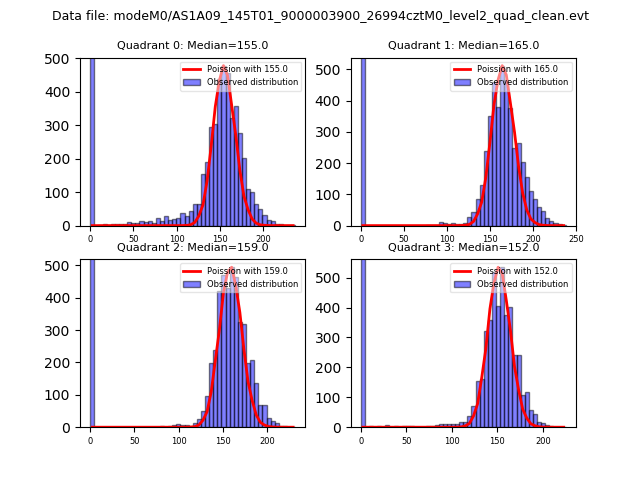 |
 |
| Quadrant-wise count rates Data is divided into 100 sec bins |
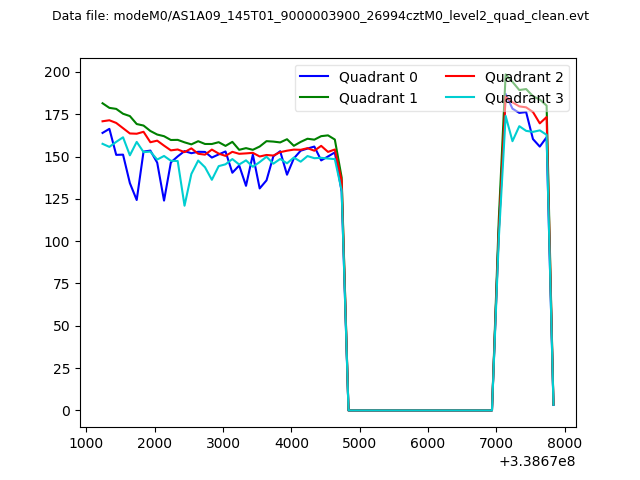 |
|
| Module-wise count rates for Quadrant A Data is divided into 100 sec bins |
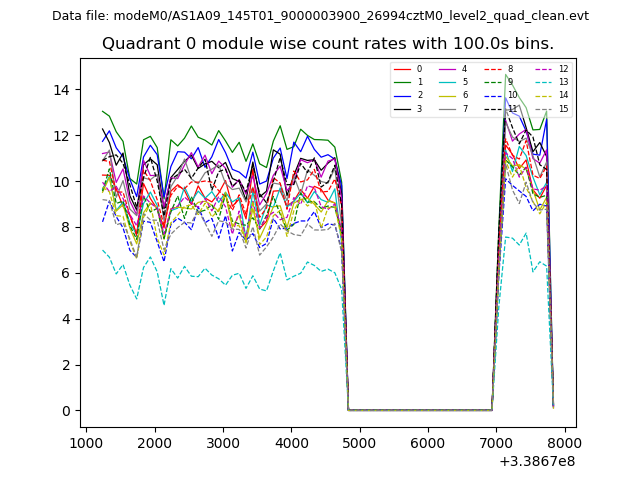 |
 |
| Module-wise count rates for Quadrant B Data is divided into 100 sec bins |
 |
 |
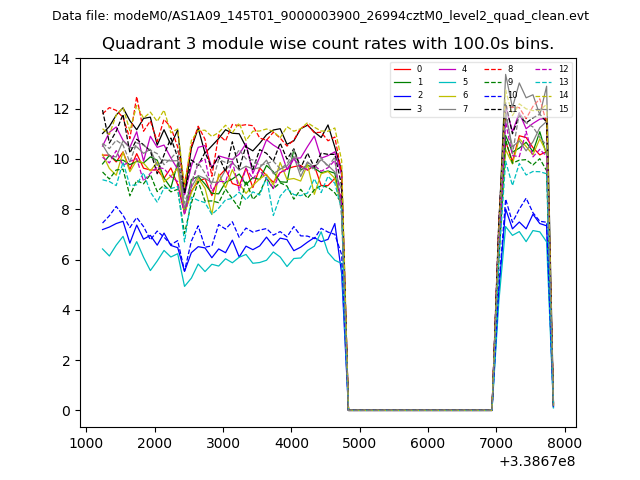
| Module-wise count rates for Quadrant C Data is divided into 100 sec bins |
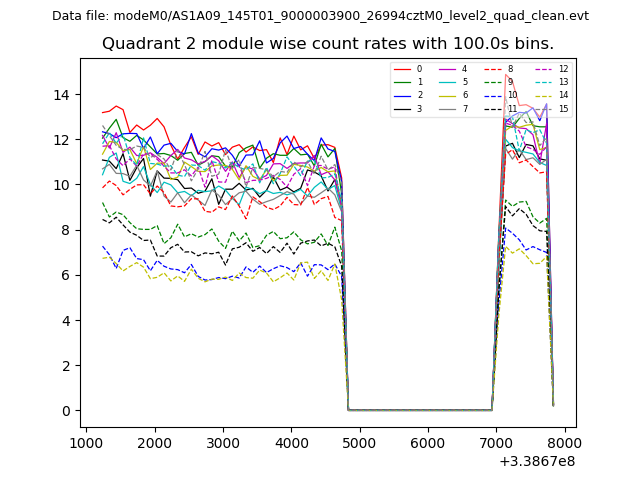 |
 |
| Module-wise count rates for Quadrant D Data is divided into 100 sec bins |
 |
 |
| Parameter | Plot |
|---|---|
| CZT HV Monitor | 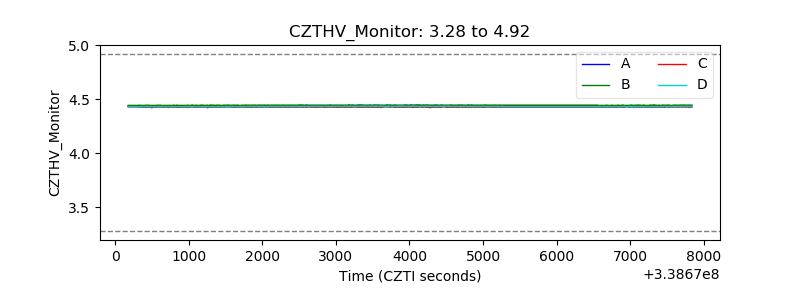 |
| D_VDD | 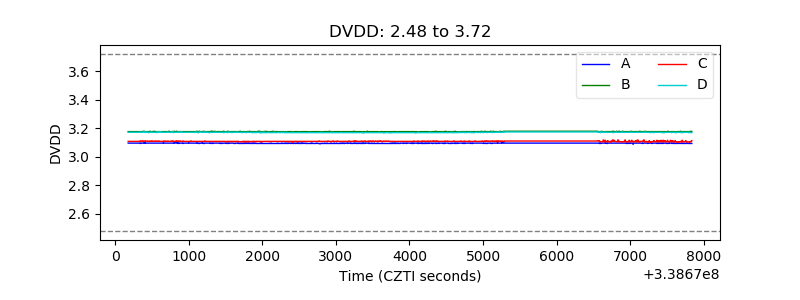 |
| Temperature 1 | 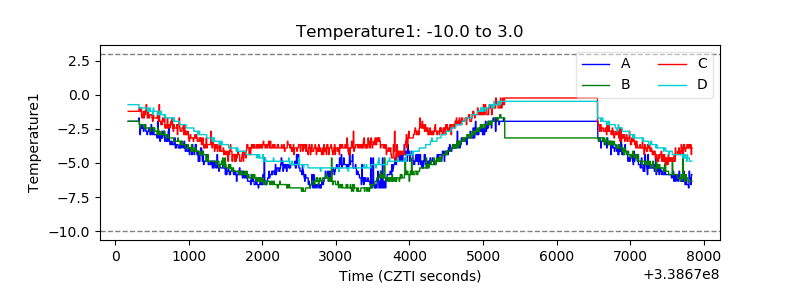 |
| Veto HV Monitor | 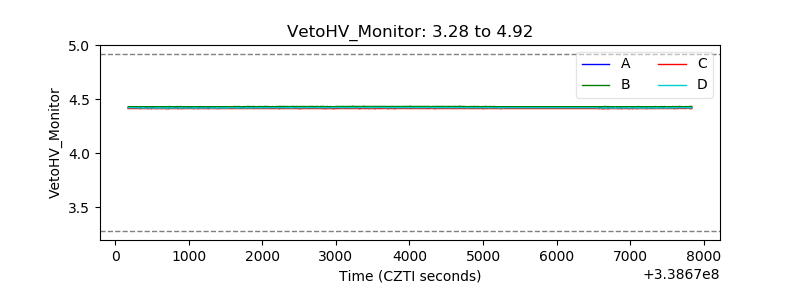 |
| Veto LLD | 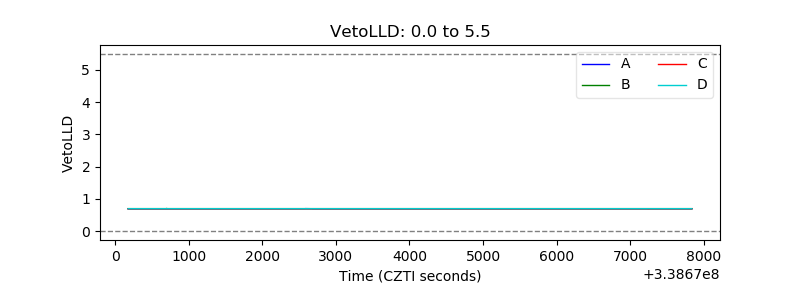 |
| Alpha Counter | 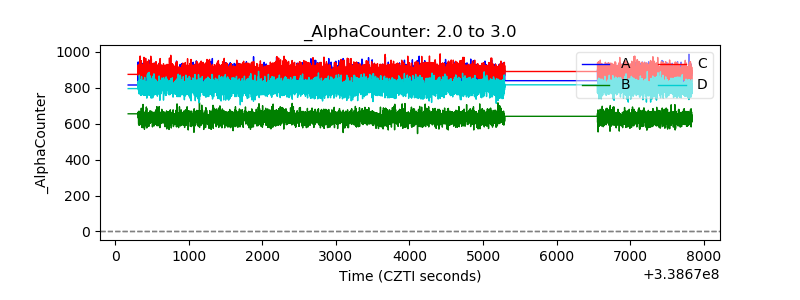 |
| _CPM_Rate | 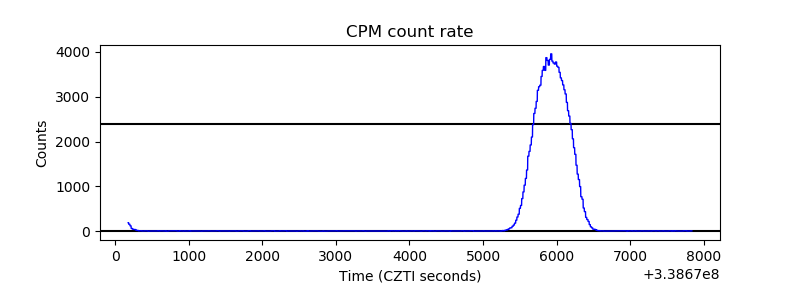 |
| CZT Counter | 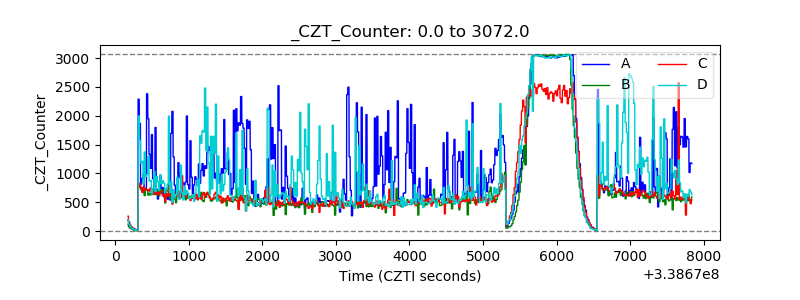 |
| +2.5 Volts monitor |  |
| +5 Volts monitor |  |
| _ROLL_ROT | 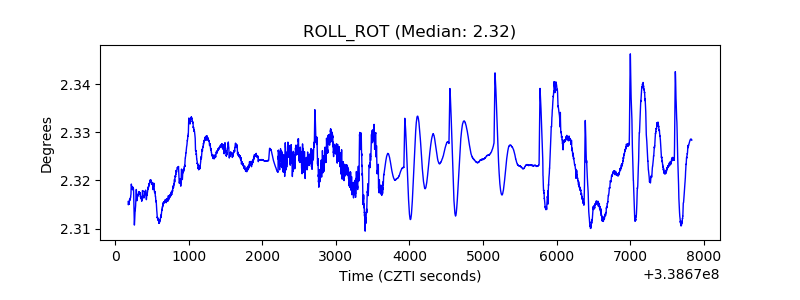 |
| _Roll_DEC | 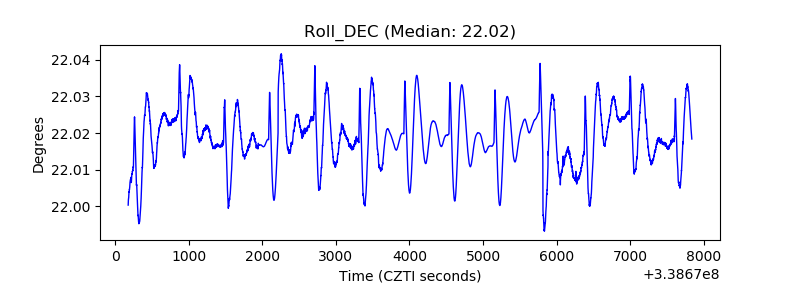 |
| _Roll_RA | 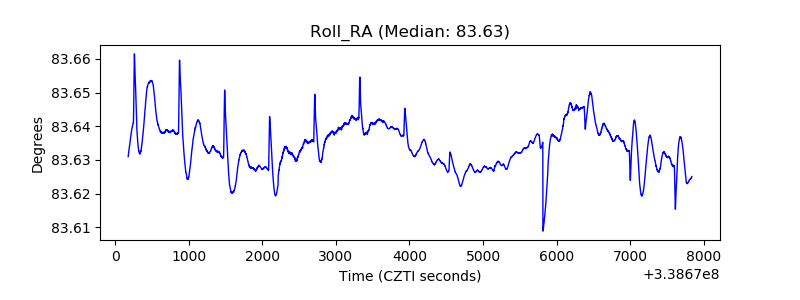 |
| Veto Counter |  |